
Elliott Wave chart analysis for the SPX500 for 12th October, 2010. Please click on the charts below to enlarge.
Yesterday’s upwards movement invalidated the alternate wave count. The main wave count is correct and price is now within the target zone.
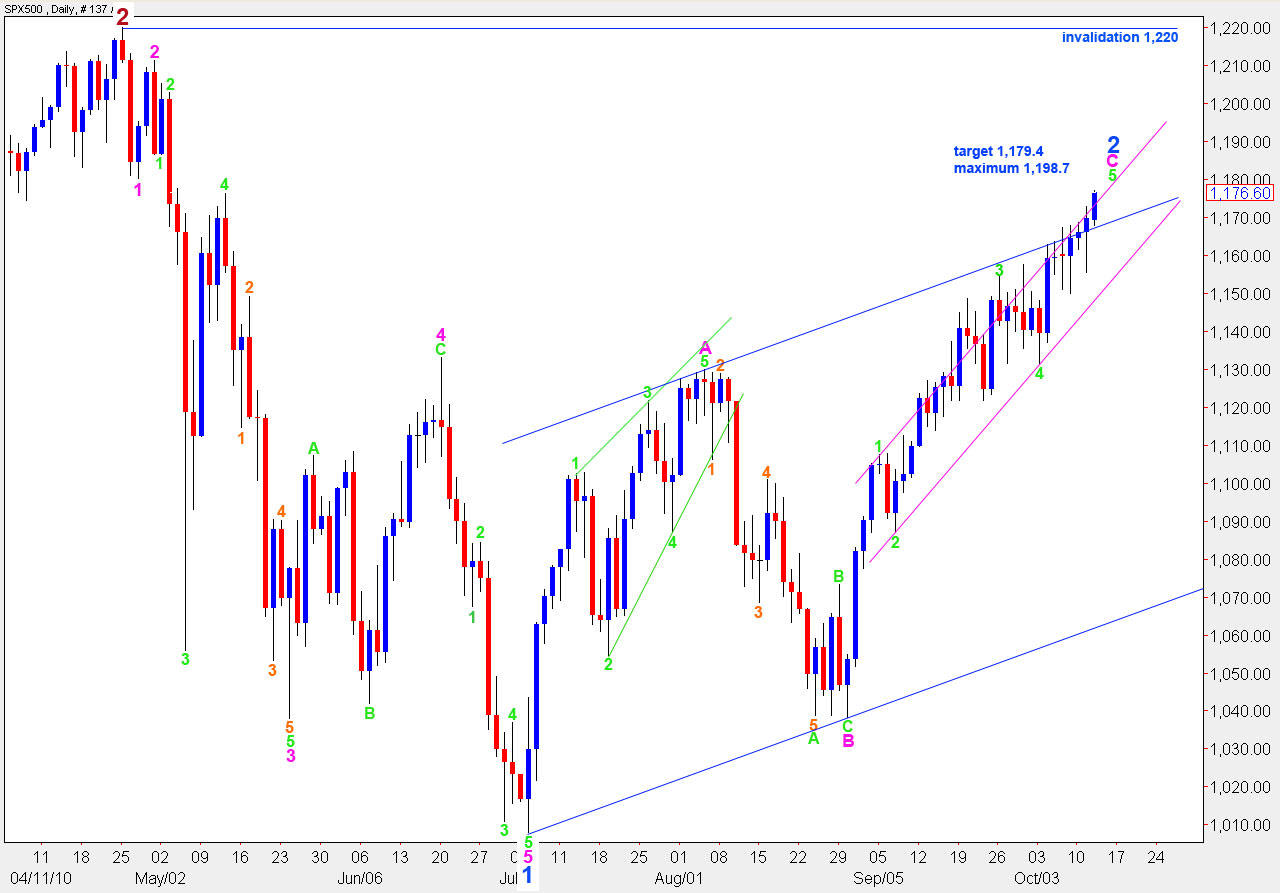
I have adjusted the main wave count, within wave C pink, today. This wave count has better fibonacci ratios than yesterday’s interpretation, and perhaps a better look also.
Ratios within wave C pink are: wave 3 green is just 1.9 points short of equality with wave 1 green. Wave 5 green therefore cannot be longer than 3 green and upwards movement is limited to no higher than 1,198.7.
If wave C pink ends with one more trading day to the upside it will have a fibonacci time relationship. The next probable end to upwards movement therefore could be October 13th, 14th or 15th.
The upper blue trend line of the parallel channel containing wave 2 blue is now providing support for downwards movement. There is a clear overshoot of this blue trend channel which is very common for C waves.
We will use the smaller pink parallel channel for indication of a trend change. When we have a full candlestick outside the lower edge of the parallel channel we will have confirmation of our trend change. Confirmation will also come with movement below 1,131.4.

The hourly chart shows all of green wave 5.
Within green wave 5, orange wave 5 will reach equality with orange wave 3 at 1,179.4. This is our target.
Ratios within orange wave 1 are: purple wave 3 is just 0.9 points short of 1.618 the length of purple wave 1 and purple wave 5 is just 0.3 points longer than equality with purple wave 1.
Ratios within orange wave 3 are: purple wave 3 is 3.4 points short of 4.236 the length of purple wave 1 and purple wave 5 is just 1.1 points short of 0.618 the length of purple wave 3.
Within orange wave 5 purple wave 3 passed equality with purple wave 1 at 1,174.3. About this point we may see downwards movement for a fourth wave at purple degree which may not move into wave 1 purple price territory below 1,168.6.
When the downwards purple fourth wave correction is over one more push upwards for a fifth wave may end upwards movement.
At that stage we will again be at a critical stage for the S&P. We will have a complete impulse structure to the upside so upwards movement could be over.
While price remains above 1,131.4 the possibility of further upwards movement to a maximum at 1,198.7 will remain. We need to see movement below this point to eliminate the possibility of further upwards movement.
Wow, what a day! Based on your count, I thought we could go no higher than about 1185.1 or so,since 3 was shorter than 1 purple.
Took a small short at 1183 this pm anticipating an ABC 4th. So far, looking good.
Hope you read this before your next post, because will be interested to know if first indication of trend change is now 1168.6 vs 1151.4.
Also, further to my previous comment, do you think truncation can happen here in the 5th wave, given the strength of today’s upmove?
This is more exciting than the last 2 minutes of a tied soccer match, eh, Kiwi?
Thanks.
With the previous count we could go no higher than 1,183.4. With this revised count today the maximum is now 1,198.7. I would not be going short until we have confirmation of a trend change, and we don’t have that yet. First confirmation of the trend change will come with a breach of the pink parallel trend channel on the daily chart. Final confirmation will come with movement below 1,131.4.
Going short is trying to pick the top. You could get lucky and make a perfect entry, or more likely you will kill your account slowly with a series of small losses (assuming you set stops, if you don’t then you are likely to kill your account with a few big losses).
The trend is your friend. For now the trend is up.
Thanks Lara!!
John
Hi lara,
I am typing this here, cause you check this section more than the forum i think. I have problems with the “message” section of the website (I have also heard from andrew that he has had trouble in past). When i try to read a incoming message, i get the error “jQuery.splitter(): jQuery cookie plugin required”. Also, when i try to forward a message from within my “sentbox” area, i can not add message recipients. I think the message area needs to be tested at different fronts. thanks.
Hi Lara,
Does the wave behavior in this purple set give you any indication yet of what we might expect from the final 5th wave?
My basic understanding is that momentum should slow down during 5 purple. Do you believe there are decent odds it may truncate based on your read, or is it too soon to tell.
Don’t know if truncations are unusual in EDs, which this appears to be.
Thanks, Mike