
Elliott Wave chart analysis for the SPX500 for 11th October, 2010. Please click on the charts below to enlarge.
Main Wave Count
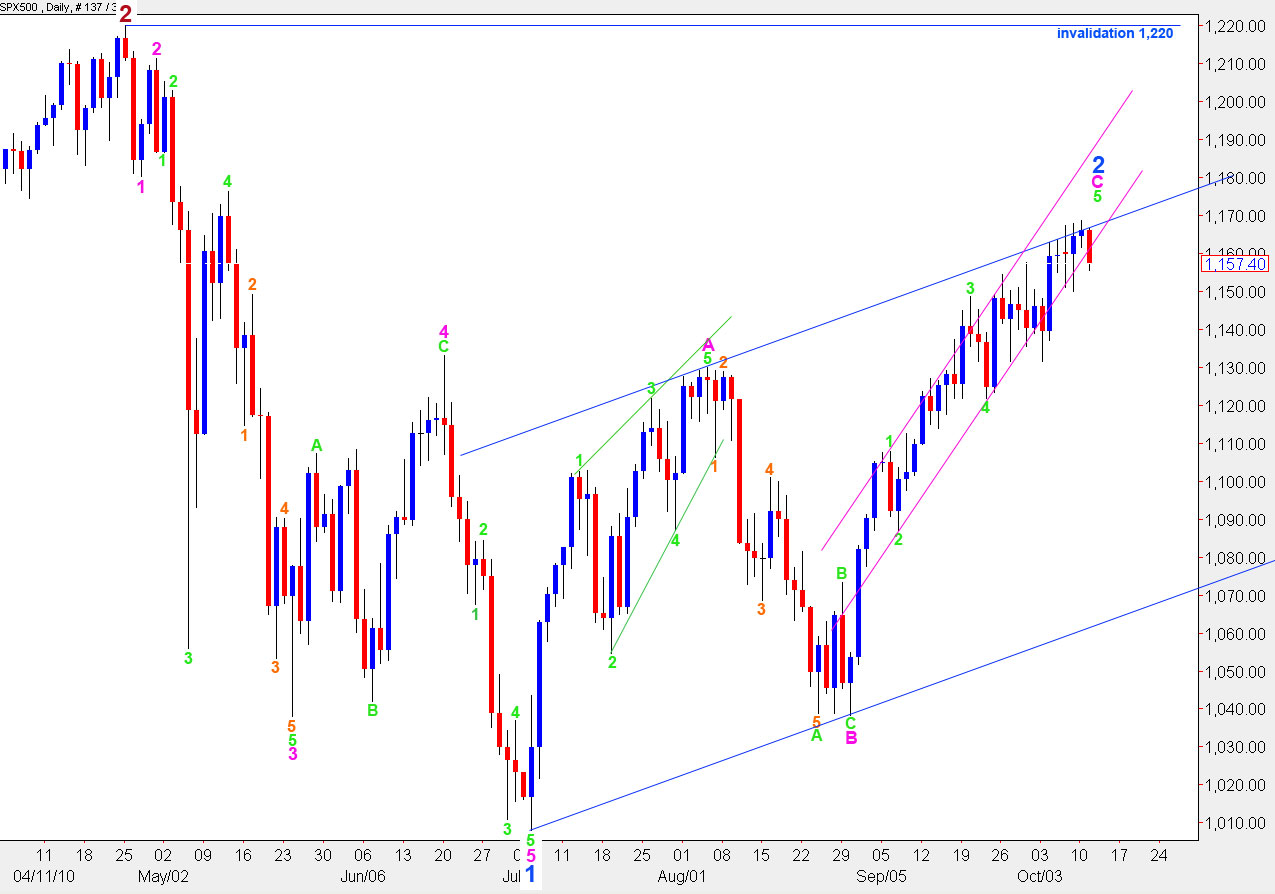
The S&P moved lower during Monday’s session. If this week sees further upwards movement then we may see a fibonacci time relationship when the high is achieved from 13th to 15th October (Wednesday, Thursday or Friday). At that stage wave C pink will have lasted a fibonacci 34 days, give or take a day either side.
Ratios within wave C pink are: wave 3 green is 7.7 points short of equality with wave 1 green.
As wave 3 green cannot be the shortest this wave count has a maximum price point at 1,183.4 for upwards movement. This is the upper end of our target zone.
At 1.174.63 upwards movement will reach the 0.786 ratio for wave 1 blue.
Movement below 1.149.9 will be our initial invalidation of this wave count at the hourly level.
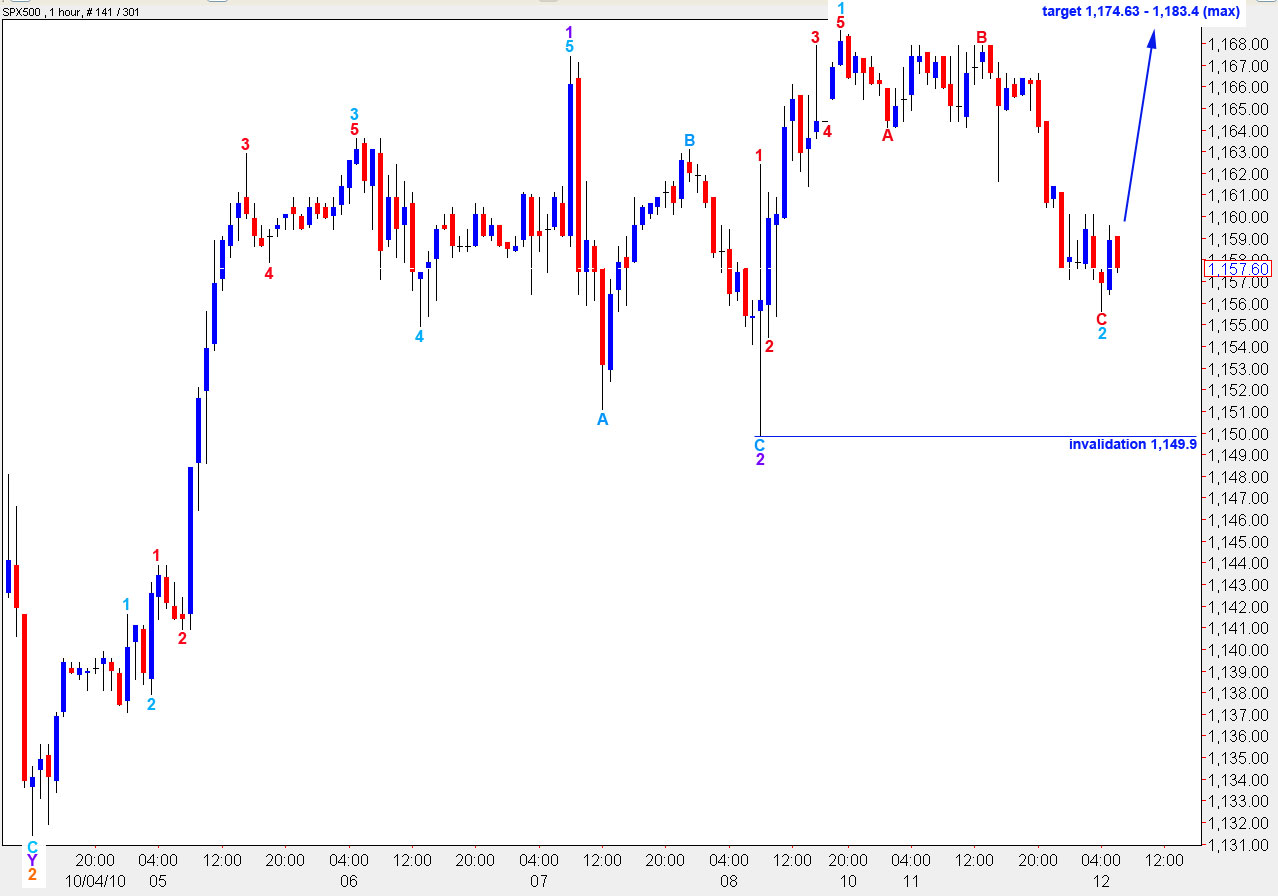
This wave count requires significant further upwards movement. Wave behaviour is not supporting this wave count; for the middle of a third wave we should be seeing clearer upwards movement.
A short term target for the end to wave 3 purple lies at 1,170.9 where it will reach 0.618 the length of wave 1 purple.
Alternate Wave Count
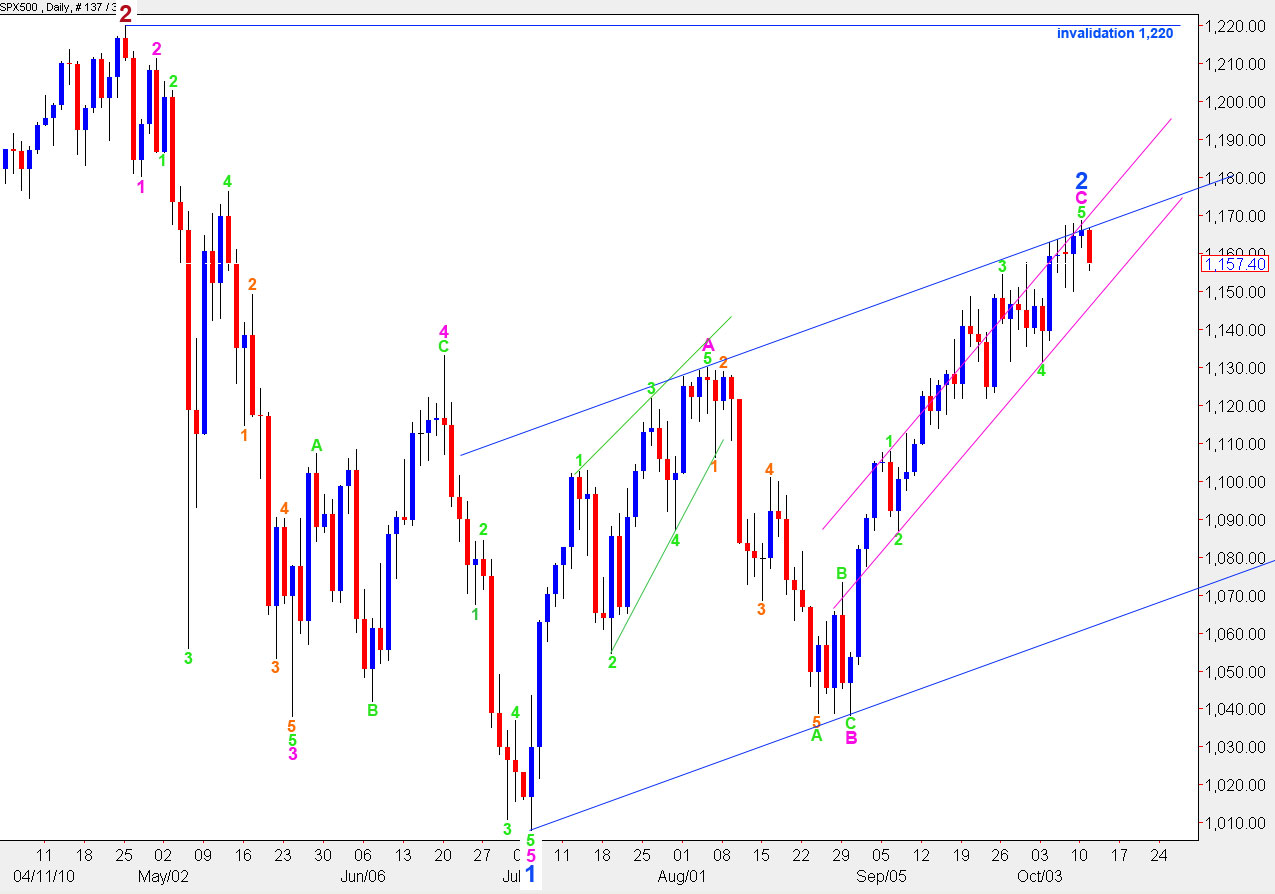
This wave count has better ratios within wave C pink than the main wave count.
Ratios within wave C pink are: wave 3 green is just 1.9 points short of equality with wave 1 green and wave 5 green is 5.57 points short of 0.618 the length of wave 1.
Ratios within wave 5 green are: wave 3 orange is 5.71 points short of 4.236 the length of orange wave 1 and orange wave 5 is exactly 0.618 the length of orange wave 3.
If upwards movement was over at 1,168.8 on 11th October then wave 2 blue lasted just one day longer than wave 1 blue.
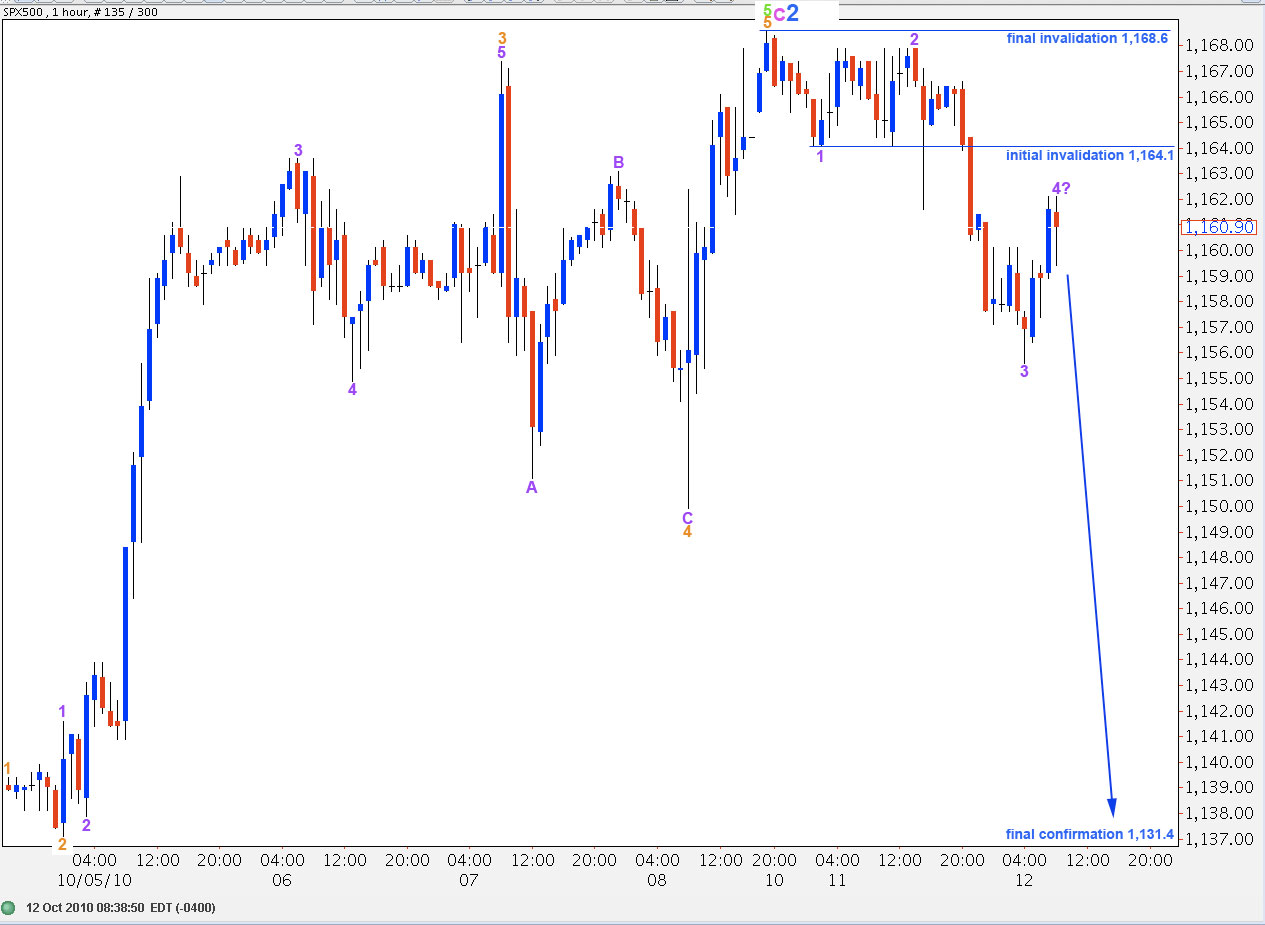
Ratios within wave 3 orange are: wave 3 purple is 4.9 points longer than 2.618 the length of wave 1 purple and wave 5 purple is just 1.53 points short of 0.618 the length of wave 3 purple.
If upwards movement is over we need to see confirmation below 1.149.9 initially. Final confirmation will be seen with movement below 1,131.4 and a full daily bar opening and closing below the parallel trend channel drawn on the daily chart about wave C pink (pink lines).
Thank you Lara for all your hard work. It is greatly appreciated.
I also want to thank you for the advice on risk management. It is so prudent to wait for the turns. As you say, one’s account can take a beating if leaping in too soon.
But, I will say, that maybe losing money has taught me to follow the counts even closer. I find myself gaining confidence, especially in the corrective moves. These are real buggers indeed!!
I hope your adjusting well to the time zones shifts and that you’re enjoying the “Lone Star” state. It’s a fun and great place to be as it is sometimes viewed as a country in and of itself.
Hope you got a nice cowboy hat too. It’s great to be able to wear one. I’m up in Philadelphia Pennsylvania, and one just stands out with a cowboy hat. But, I remember a trip I had in Texas and that was a fun and memorable part of it.
Thanks,
John