
Elliott Wave chart analysis for the SPX500 for 8th October, 2010. Please click on the charts below to enlarge.
Friday’s session saw a very slightly new high. I have two wave counts for you again today. With this very long wave C pink there are several ways to count this. I am presenting a main wave count which follows on from the one we have been using and this indicates a fair bit more upwards movement. The alternate count sees only one more small upwards wave which may or may not make a new high, the target is very close. Again we may use invalidation and confirmation points to indicate which wave count is correct.
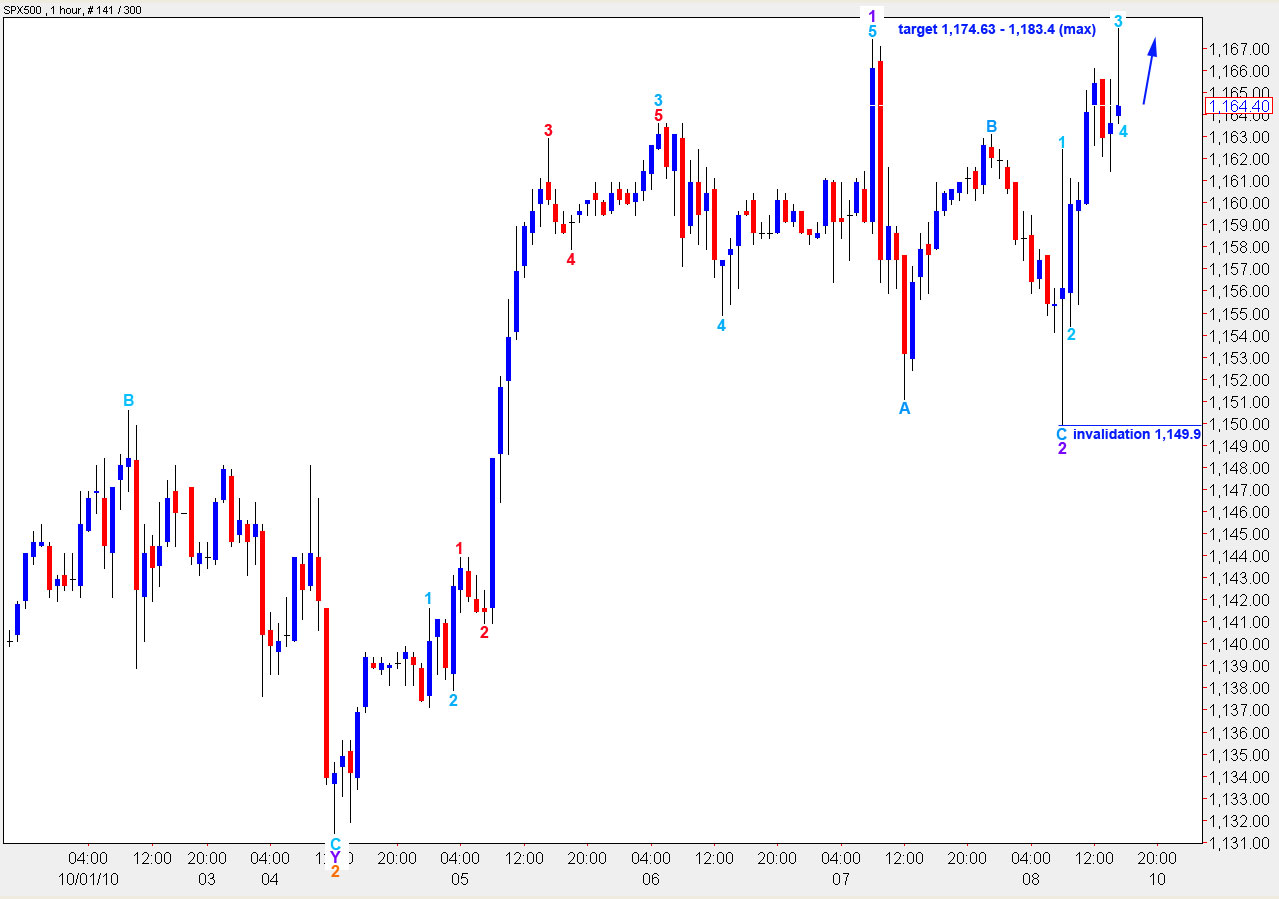
The main wave count now is looking a bit less likely than today’s alternate. The main wave count expects strong upwards movement to a maximum price point at 1,183.4. There is still divergence on 4 and 8 hour charts between price trending upwards for wave C pink and MACD trending downwards. This is an expiring trend but that does not mean it is over already. It could limp along for a few more days yet, but it seems unlikely that we should see a third wave up at this late stage.
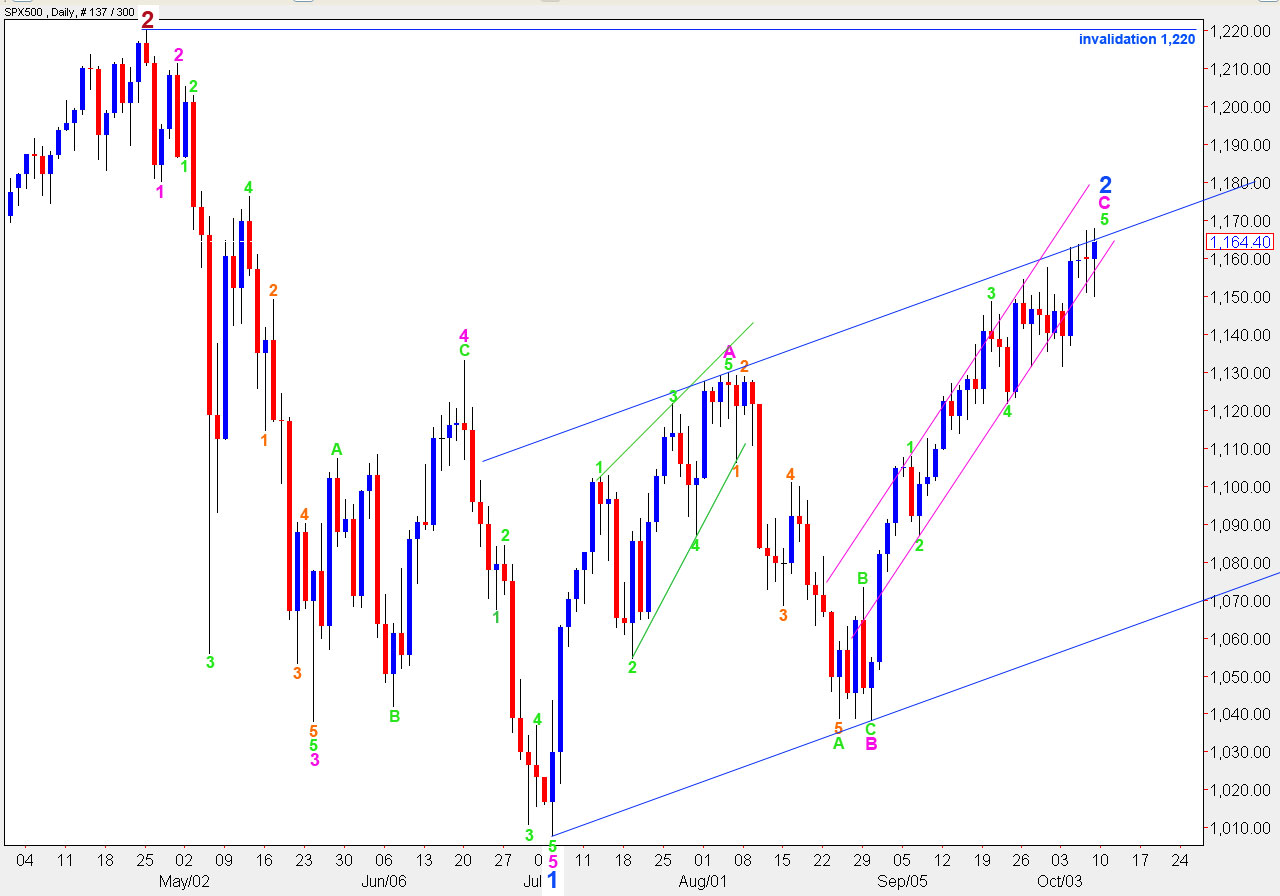
To confirm an end to upwards movement (after one final small push up) we now need to see two things. First, a full daily bar opening and closing below the lower edge of the pink parallel channel drawn here about C pink on the daily chart. Second, we need to see movement below 1,131.4 which is the start of wave 5 green for the alternate wave count (please note: this point has changed from 1,121.9).
Ratios within wave C pink are: wave 3 green is 7.7 points short of equality with wave 1 green. Wave 5 green has a maximum upwards price point at 1,183.4 where it will reach equality with wave 3 green.
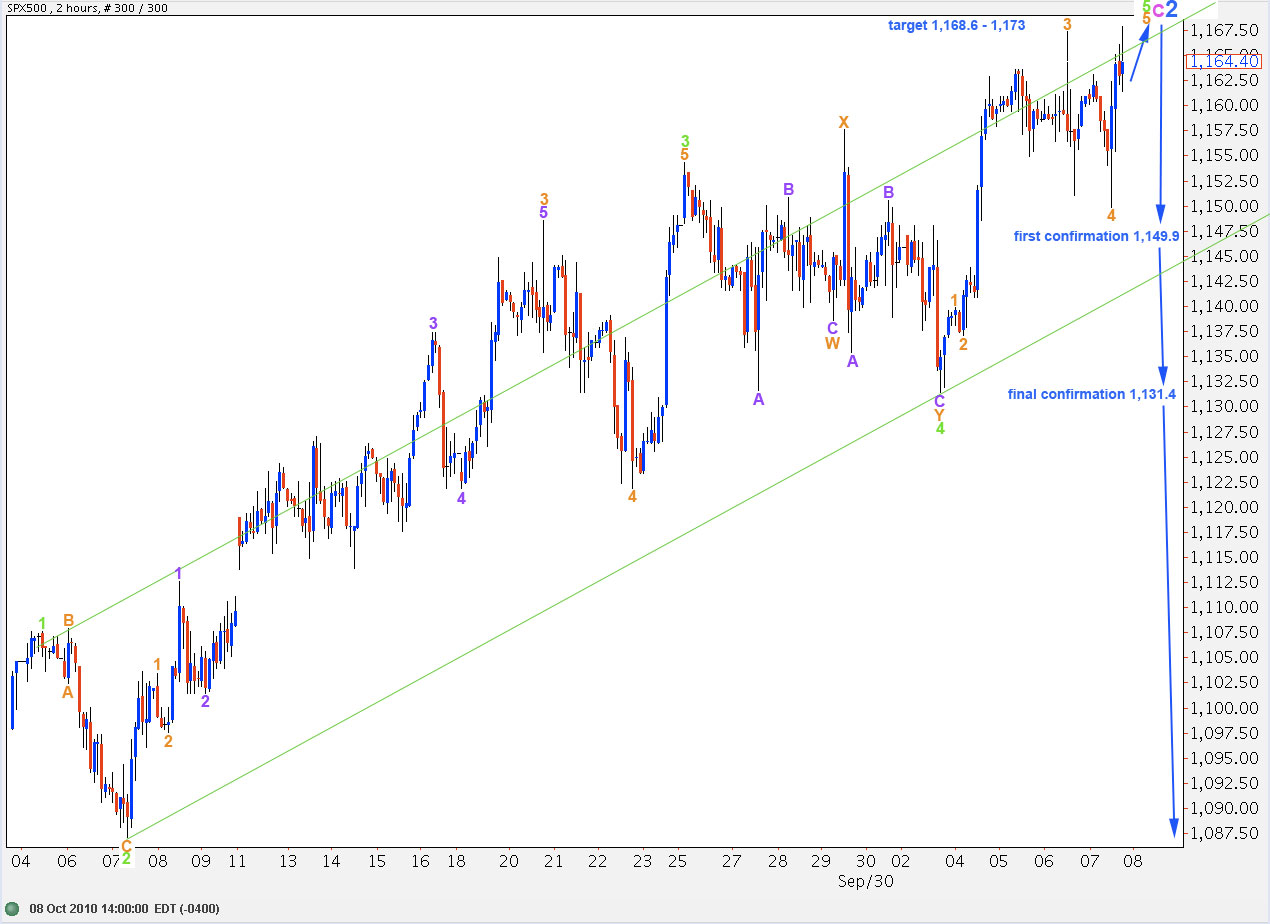
It is not possible to see wave 4 orange ending at 1,149.9 as this point overlaps the high of wave 1 orange to the left of the chart (wave 1 orange ended at 1,154.4). Therefore, Friday’s movement must still be within wave 3 orange which according to this wave count requires significant upwards movement to complete this structure.
Movement up to the last high is also an incomplete five wave structure. We need to see one final wave up to end wave 5 orange. Wave 5 orange will reach 0.618 the length of wave 3 orange at 1,168.6. On a 15 and 5 minute chart this last upwards wave is an incomplete five wave structure and needs one final fifth wave within it to complete.
Alternate Wave Count
Wave 3 green for this wave count is higher, but the length of wave 3 green is still less than wave 1 green. Therefore, this wave count has a maximum price point for upwards movement at 1,198.7.
Ratios within wave C pink are: wave 3 green is just 1.9 points short of equality with wave 1 green.
Ratios within wave 3 green are: wave 3 orange has no fibonacci ratio to wave 1 orange but wave 5 orange is almost perfectly 0.618 the length of wave 3 orange.
At 1,173 wave 5 green will reach 0.618 the length of wave 3 green.
At 1,168.6 wave 5 orange within wave 5 green will reach 0.618 the length of wave 3 orange.
Within wave 5 orange this wave count needs one final small wave upwards to end the fifth wave within it. This last wave does not need to make a new high. We may see a truncated fifth but it is more likely that it will make a new high. Thereafter, price should turn strongly down.
When price moves below 1,149.9 we shall have our first indication of a high in place and below 1,131.4 this will be confirmed.
Nice targets lara. I like the alternate wave count too.