
Elliott Wave chart analysis for the SPX500 for 7th October, 2010. Please click on the charts below to enlarge.
This is a brief analysis of the New York session for Thursday while I am in Los Angeles. The end of week analysis will be the usual text and video.
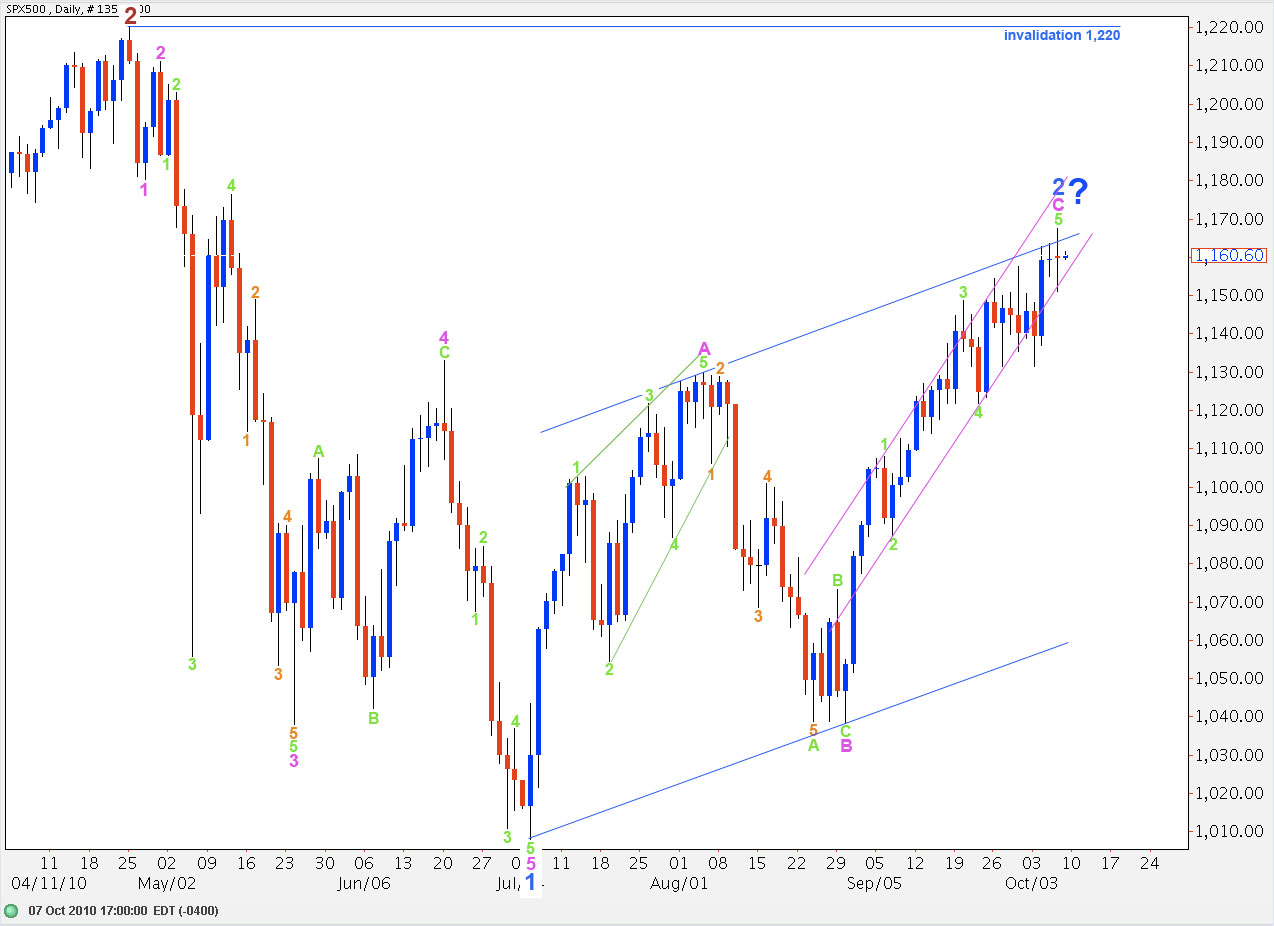
The S&P has moved up a little to a new high exactly as expected. Target #1 was at 1,167.2 and upwards movement ended at 1,167.4. Thereafter, price has turned back down.
Again, it is now possible to see a complete and satisfactory five wave structure within wave C pink to end this second wave correction.
If wave 2 blue was over here it is a 75% correction of wave 1 blue.
Within wave 2 blue wave C pink is 7.1 points longer than equality with wave A pink and we now can see a very nice small overshoot of the upper blue trend line containing wave 2 blue.
If it was over on the 6th of October then neither wave 2 blue nor C pink have a fibonacci time duration.
If this wave count is invalidated with upwards movement above 1,167.4 then we may expect price to rise quite a lot higher. For this wave count the maximum upwards price point is 1,183.4 where wave 5 green reaches equality with wave 3 green, as wave 3 cannot be the shortest.
We need to see a full daily bar opening and closing below the lower edge of the small pink parallel trend channel containing wave C pink as confirmation of a trend change. The safest approach to this market is to be patient and wait for this confirmation before entering short positions. If price moves higher (above 1,167.4) and you wish to trade to the upside please be careful and use stops, as the next move for the S&P is very strong downwards movement.
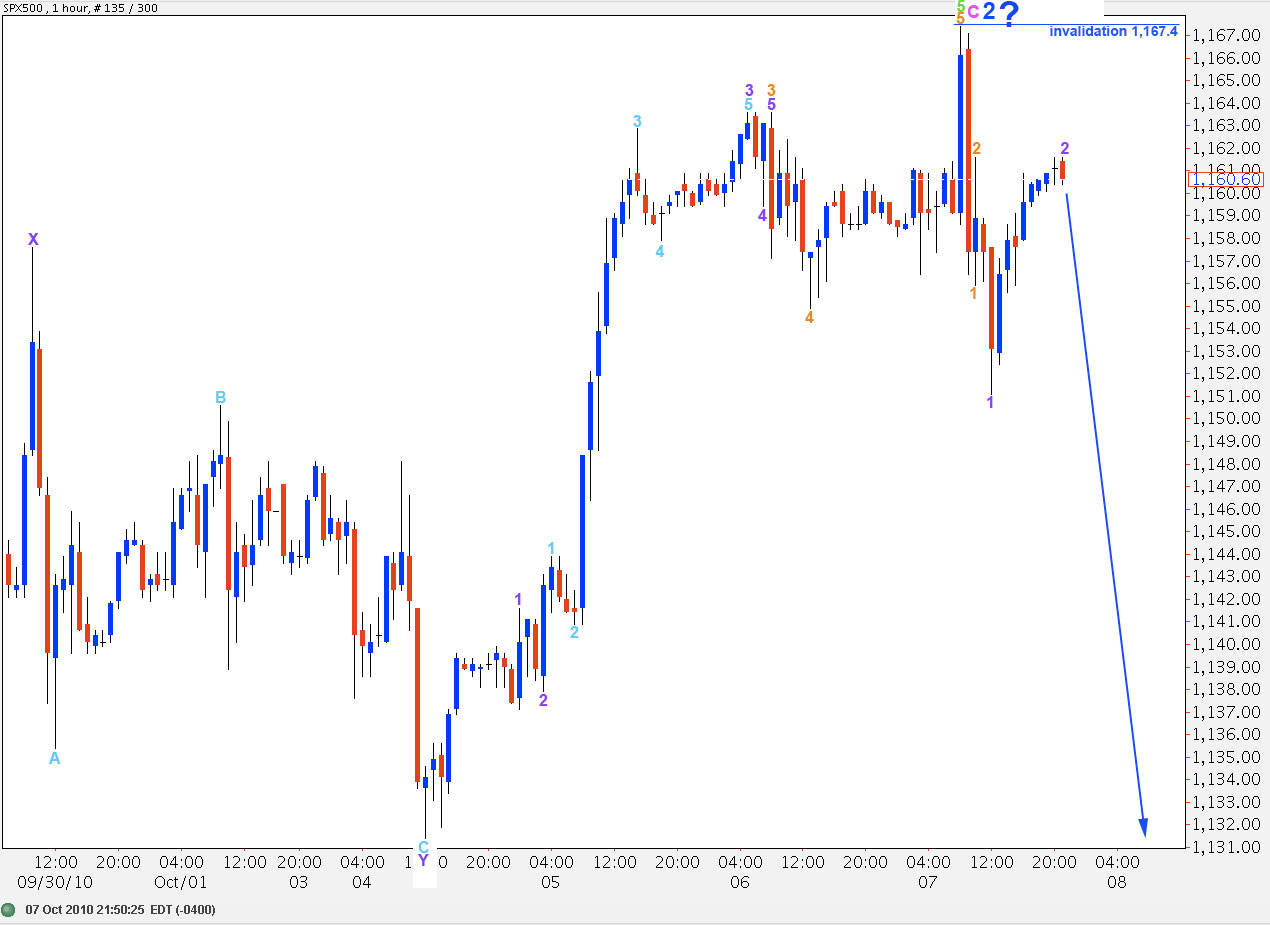
Price stayed above our invalidation point of 1,154.4 and moved up to just above our first target.
So far the S&P is behaving exactly as expected for this wave count.
If this wave count is correct we should see strong downwards movement. Price must remain below the last high of 1,167.4.
If this labeling of recent downwards movement is correct then price should remain below 1,161.6 also. However, this labeling may be premature.
We must see movement below the start of wave 5 green at 1,121.9 for our confirmation of this major trend change.
Alternatively it is also possible that we could move the degree of labeling within wave 5 green here on the hourly chart all down one degree. We may have only seen wave 1 of wave 5 green. If this alternate possibility plays out then the next move for the S&P is a third wave to the upside. We will know if this is possible as soon as price moves to a new high. Therefore, if this wave count is invalidated we may expect price to move considerably higher. In this event I will calculate targets for you in the next analysis. This could see the S&P reach its final high for wave 2 blue on the 13th to 15th of October next week where wave C pink will have lasted a fibonacci 34 days.
Hi Lara, Thanks – be great if there was only one possibility! dreaming on.
Lara,
Nice analysis,just was wondering your charting service shows different numbers on SPX high and lows. So far we have only seen the high of 1164.84 till Thursday yet you have them as 1167.4 please recheck on TOS or stock charts etc. thanks
Today Friday,s high is 1167.73 so far
Hi Sandy, that’s a common query. I’m using a data feed from Net Dania http://www.dailyfx.com/charts/netdaniachart/ which includes after hours data. I am of the opinion that after hours market movement should be taken into account as to ignore it may be ignoring movement that could invalidate a wave count, e.g. if wave 4 moves into wave 1 after hours then I think this should be taken into account.
Hi Lara,
Like your objective style.
What IF we moved above the April high, what would your count look like ?
Kind regards,KM
Love the analysis Lara, there’s not much further this market has left to travel if any at all.
My only observation is could wave 1 (down) that started 26th April 10, have ended 25th May 10? and the subsequent correction from 25th May 10 has been a “Double Three”?
Yes, definitely. I know that is the count EWI have. But this count that I have is the one I started with when I began counting the SPX. It makes no difference to how high this correction can go, the invalidation point is the same, but it does make a difference to calculation of targets for the next wave down. Obviously I prefer my count, and I try to avoid looking at EWI’s counts, I find sometimes they put me off.