
Elliott Wave chart analysis for the SPX500 for 6th October, 2010. Please click on the charts below to enlarge.
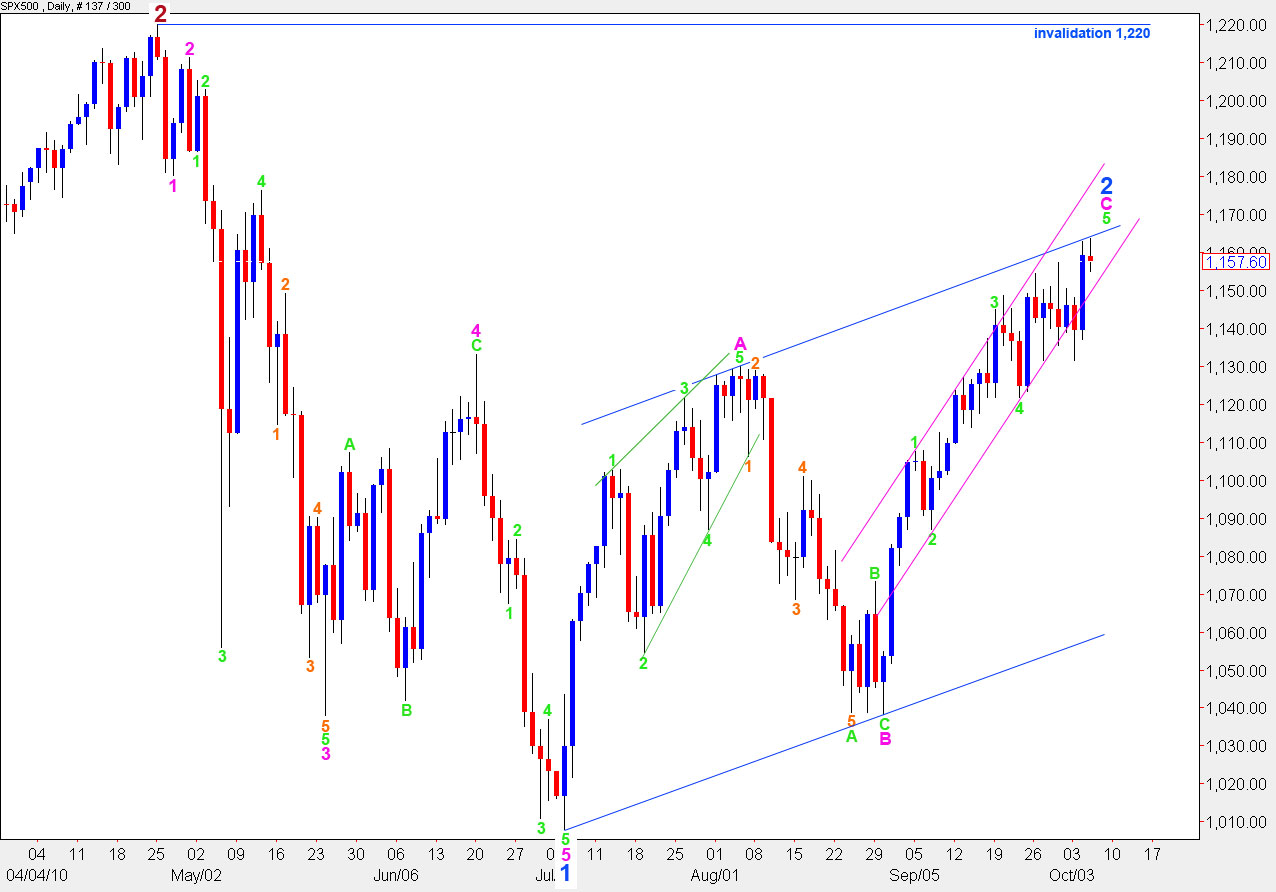
At this stage, the S&P is held down by strong resistance from the upper trend line. It is extremely common for C waves to overshoot the upper trend line at their end. We may see this occur in the next day or so.
The maximum upwards point for wave 5 green where it will reach equality with wave 3 green is at 1,183.4.
This wave count is invalidated at the daily level only with movement above 1,220
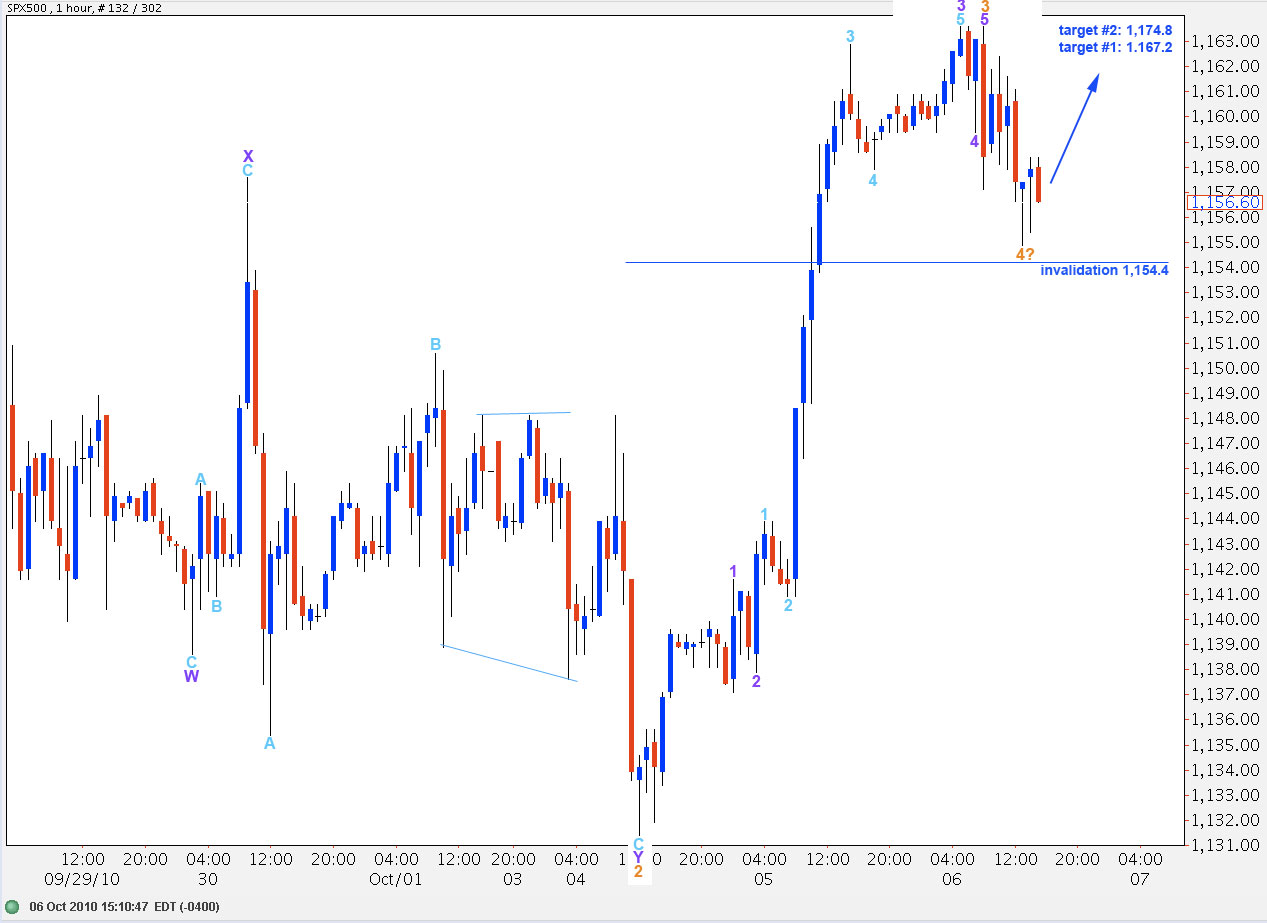
We most likely have an end today to wave 3 orange within this terminal wave 5 green.
If wave 4 orange ended (and was remarkably brief) at 1,154.4 then the initial target for wave 5 orange to end wave 5 green is at 0.382 the length of wave 3 orange, at 1,167.2. Thereafter, the next target is 0.618 the length of wave 3 orange at 1,174.8.
If wave 4 orange extends further sideways price must remain above 1,154.4 as wave 4 orange cannot move into wave 1 orange price territory.
Wave 3 orange is almost perfectly equal with wave 1 orange; it is just 0.3 points shorter. Wave 5 is likely to have a fibonacci ratio to wave 3. All we need to see now for upwards movement to be complete is a satisfactory impulsive structure to the upside for this fifth wave.
If this wave count is correct then upwards movement may end sooner than the middle of next week. We are in a fifth wave at green degree of a terminal C wave at pink degree. We may see the beginning of wave 3 at minor degree in the next couple of days.
Welcome to the great Lone Star State of the US of A. Hope you have your stetson and boots in tow!
Happy (and safe) trails!
As for the market, we have just about hit Wave 4 of Minor Wave 1 in the ES-Minis but remain 13 or so points from it in the S&P Cash Index. This, of course, is the most common point for reversals. This also coincides nicely with the 78.6% retrace of wave 1 which is also a very common reversal point. Add to this sentiment figures for the indexes and the inverse of this in the dollar and we may have hit the wall in this counter trend rally.
Great to hear! This was one heck of a correction that seemed to never end.
John
i still think we get a spike to clear W4 of MW1 (which we have not quite met yet) and then this beast gets sold. one last gasp. BTW, it might be shaping up as an ending diagonal.
good luck!
I’ve figured out what you’re referring to; wave 2 correction may end about the fourth wave of one lesser degree. Which according to your wave count would be at 1,176.4 (on mine it’s already passed it at 1,133.1. I’ve just finished the analysis for today, and although there’s no video it’s still a thorough analysis. It looks like again another critical juncture, with all of pound, euro and S&P. It’s all in the degree of labeling. So yes, it could go higher, and we should know in another 24 hours trading.
I’m in LA tonight and off to Austin tomorrow.
What goes up must come down. It will end. Volume is very light, MACD is still showing divergence. It will end.
Thanks so much Lara!!
Hope your trip goes well and you enjoy your time in Texas!!
John
Nicely done. Have a safe trip.