
Elliott Wave chart analysis for the SPX500 for 5th October, 2010. Please click on the charts below to enlarge.
Yesterday’s upwards movement has again invalidated our wave count. We did not get the confirmation of a high that we were seeking but we were aware that a new high was a possibility.
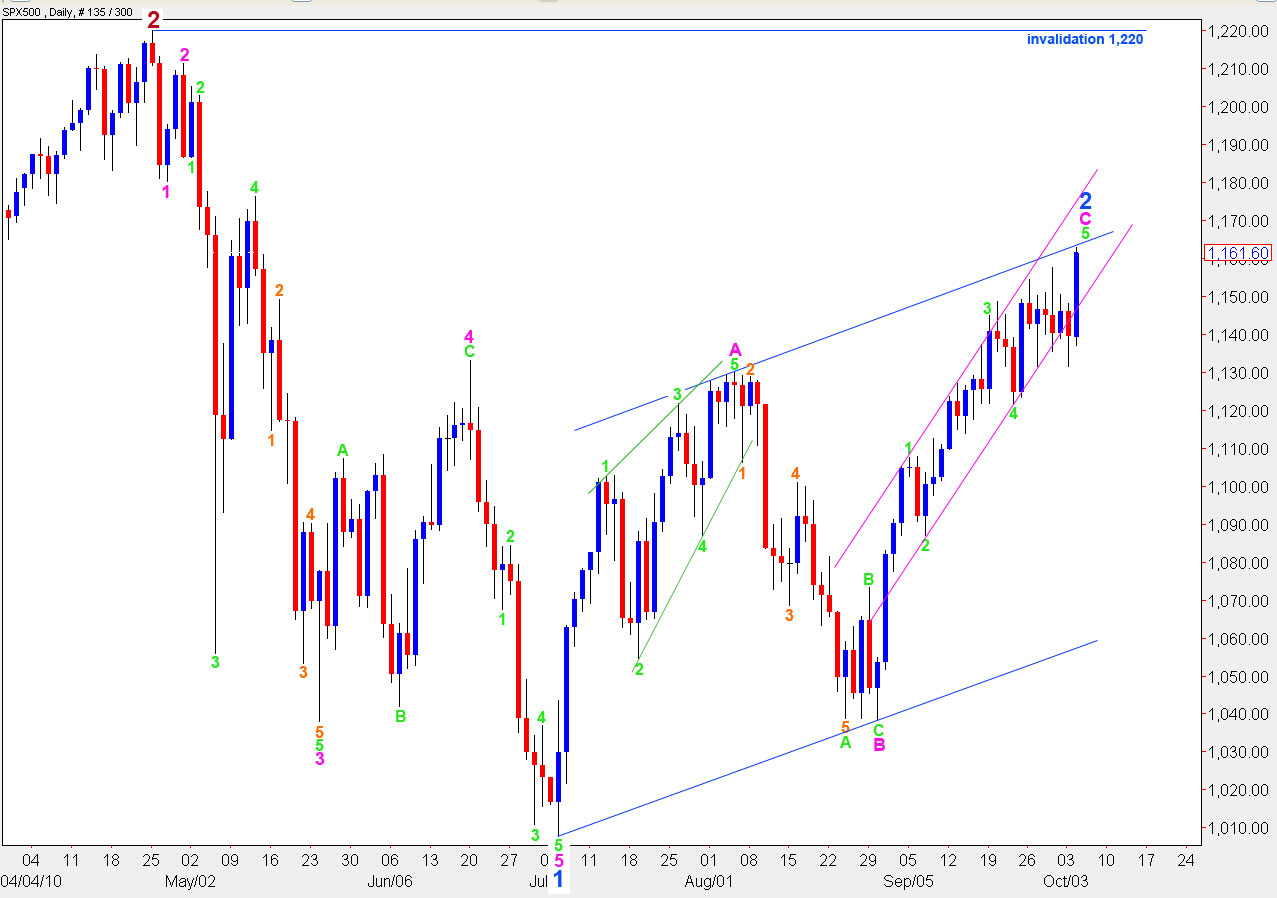
Because green wave 3 is shorter than green wave 1 within wave C pink, the maximum upwards movement for this fifth wave is to 1,219.1.
On the 14th of October wave C pink will be 34 days in duration. It may end at this date, give or take one day either side.
The next upwards target for green wave 5 is at equality with green wave 1 at 1,183.4. This is also a maximum allowable length for green wave 5 as 3 cannot be the shortest.( – edited at 7th October)
There is more than one valid wave count for this second wave correction at orange degree. This interpretation has the best fit. This is a double combination: flat, X, zigzag.
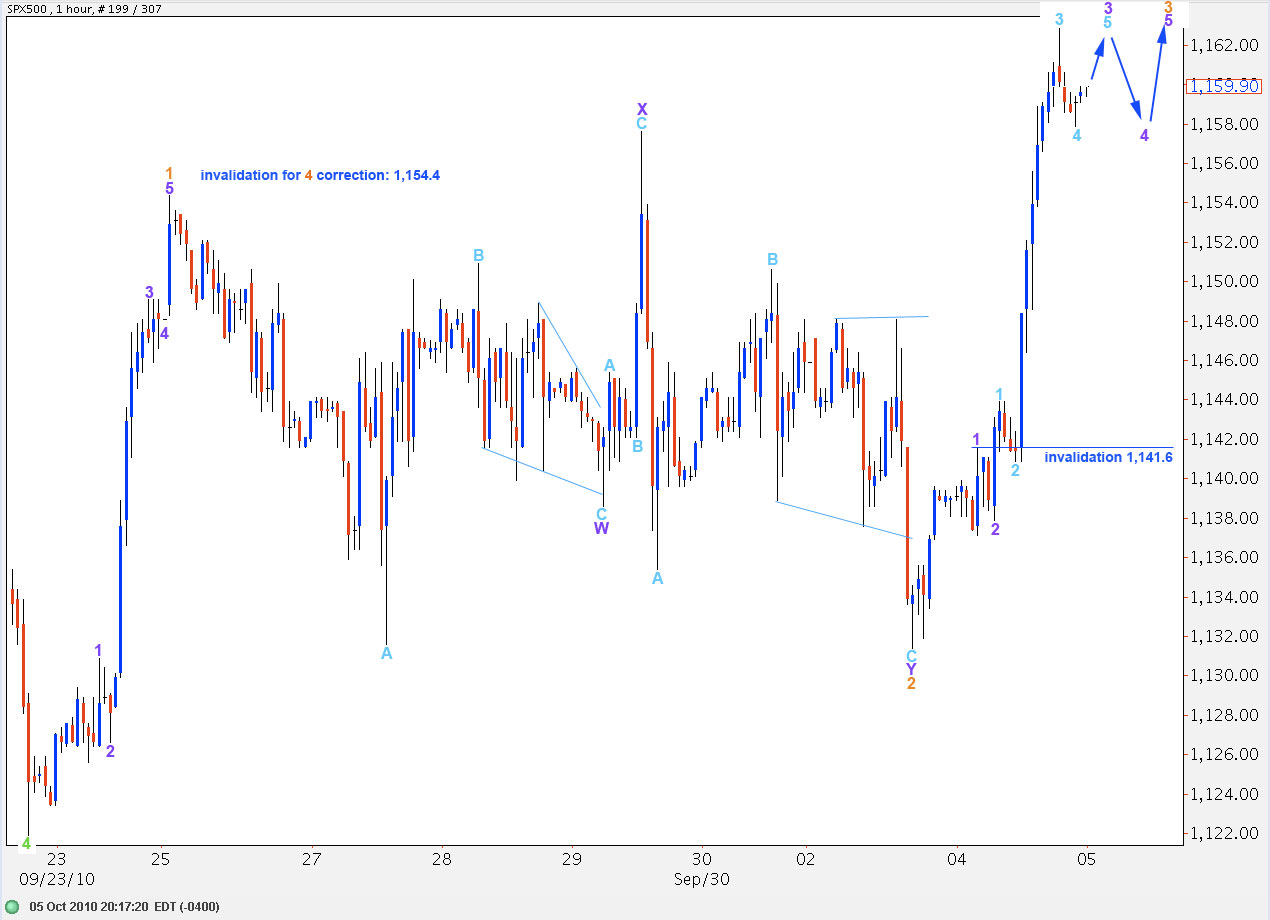
Yesterday’s upwards movement is an incomplete impulsive structure. We need three more waves to complete it. While this is completing wave 4 purple cannot move into wave 1 purple price territory at 1,141.6.
When wave 3 orange is complete the S&P will then be due for a fourth wave correction that cannot move into wave 1 price territory at 1,154.4.
Thereafter, one final push upwards for a fifth wave should end upwards movement.
When we have a known length for wave 3 orange and an end to wave 4 orange I can calculate a more accurate upwards target for the final fifth wave.
Lara,
Sorry. I meant if Green 3 is shorter than Green 1.
Peter
Am of the same mind,Peter. Think wave 5 can’t exceed the 1181 target without the entire count being invalidated.
I’m so sorry! You are all absolutely right. I have made an error in my calculations yesterday. I’ll be fixing that now. I used the wrong figure for the start of green wave 5.
The wave count at green degree has not changed, green 3 is still shorter than green 1 therefore the maximum for green 5 is 1,183..4 (and I’ve triple checked THAT figure!)
Lara,
Have you changed your count at green degree?
If Green 3 is shorter than Green 5, how can Green 5 extend all the way to 1219? Looks like invalidation point should be lower?
Am I reading your chart incorrectly?
I know you are traveling, so no worries if you do not have time to respond.
Peter
I’ve not changed it Peter, I’ve made an error yesterday. I’ll be fixing the text now, but I’ll leave the charts as is. I’ll be doing another quick analysis now before my flight. I’m terribly embarrassed at such a dumb mistake, but I think it’s the only one that I’ve made so far (to my knowledge). I’ll be settled in another 3 days, next week I’ll have more time.
No problem. Just wanted to make sure. Thanks for your diligence. It is much appreciated.