
Elliott Wave chart analysis for the SPX500 for 4th October, 2010. Please click on the charts below to enlarge.
It is looking increasingly likely that the S&P ended its upwards movement on the 30th of September at 1,157.6.
If wave C pink ended there it is just 2.7 pips short of equality with wave A pink, and it lasted 23 days as did wave A pink. So they are very similar in length and identical in duration. Plus, alternation is achieved in form: wave A was a leading contracting diagonal and wave C was an impulse.
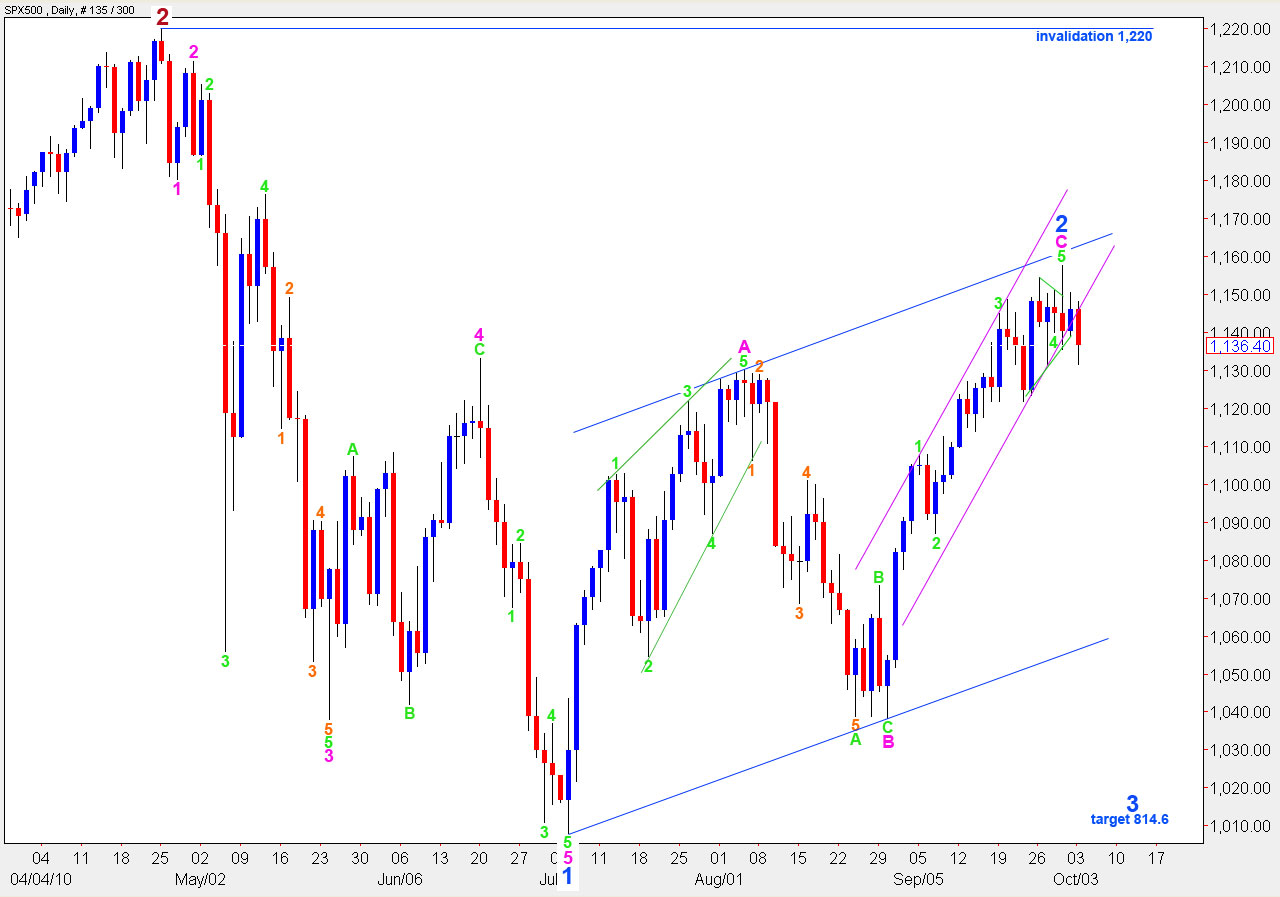
We have movement below our first two confirmation points: 1,135.4 and 1,131.6. This downwards movement has also taken price below the lower edge of the pink parallel trend channel on the daily chart which contains wave C pink.
We still need to see movement below 1,121.9 to confirm this wave count. Movement to this point would also likely see a full daily bar opening and closing below the lower edge of the pink parallel channel, providing our final confirmation of this wave count which sees a high in place.
If this wave count is correct we should expect to see downwards movement gather momentum in the next few days.
If we see confirmation of this wave count, we should use upwards corrections as opportunities to join the trend and invalidation points may be used as one place to set stops (just above).
Wave 3 blue will reach equality with wave 1 blue at 945.6 but that target may not provide enough room for an upwards fourth wave correction, which must not move into wave 1 blue price territory. Therefore, the more likely target for wave 3 blue looks like 814.6 where it will reach 1.618 the length of wave 1 blue.
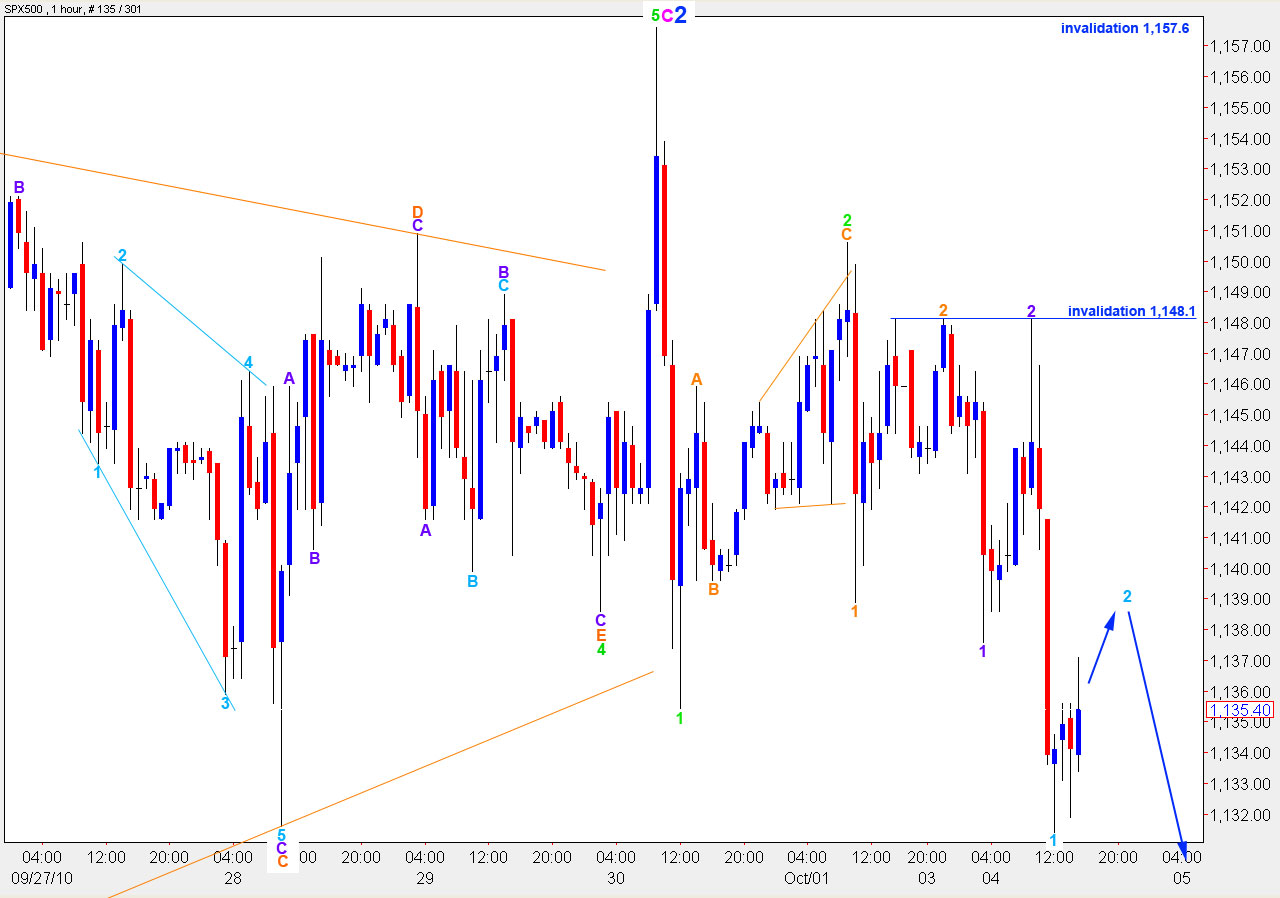
This wave count is invalidated with movement above 1,157.6. If we see a new high at this stage it is then fairly likely that price is going to continue to move upwards towards 1,160.3 at a minimum, and likely a fair bit higher than that.
So far recent downwards movement looks impulsive and subdivides to impulsive counts on a 15 minute chary. Upwards movement looks corrective. Wave behaviour supports this wave count.
If this wave count is correct we should not see price move above 1,148.1 as wave 2 aqua cannot move beyond the start of wave 1 aqua.
In the short term a target for wave 3 purple to complete the first satisfactory five wave impulse on the hourly chart may lie about 1,131.1. This may occur next session. Thereafter, we may see a small fourth wave correction with price remaining below 1,137.6 followed by a fifth wave which may move below our confirmation point at 1,121.9.
Although each downwards movement subdivides nicely on a 15 minute chart into a five wave impulse, we still cannot see a satisfactory five wave impulse to the downside here on the hourly chart. We need to see this also to add weight to this wave count.
Hi Lara-Do you think we’re headed for W4 of Minor Wave 1?
Robert
Nope. Wave 4 of minor (blue) wave 1 ended 20th June, 2010.
Excellent. 1148 is now my new stop limit for my SPXU short position. That should pretty much guarantee I make some money now, regardless of what happens (unless we have a huge gap-up before the market opens). Thanks! I also think we go up overnight, probably open higher, but hopefully roll over. We shall see. 🙂
Traders note: The NY Fed is pumping money into the market tomorrow and Wednesday (see their web site for details). It may make us rally for a bit, depending on how much they print ‘n pump (they don’t say how-much).
Thanks also for the warnings Lara, duly noted!!
Safe travels later this week. 🙂
Andrew
Well the Fed money worked. We spiked at 5:00-5:30 as the market got ready for the Fed treasury purchase. It came at mid-morning and took the market up again.
We should sell off a little now, but repeat the whole cycle tomorrow as the Fed is doing one more buy. After that, all bets are off and we may start to decline.
I am 100% out now, and as bad as the pre-market rise was today, I am actually slightly up.
It’s so hard trying to trade this from the short side though.
GL all.
Andrew
PS – that’s 5:00 PST, so 8AM EST, sorry!!
Thanks lara, its nice to see we are hitting the target/validation points again. One small correction. Monday’s low was 1131.76 and so we have not yet breached 1131.6, but we got pretty close monday.
That depends what charting package you’re using I guess. Net Dania has the low at 1,131.4, so it’s only 0.2 below the point we were looking for.