
Upwards movement was expected for Tuesday’s session. The session completed a green daily candlestick, but it was an inside day with no new high.
Summary: A little downwards movement may unfold for one to three sessions. Price should remain above 2,322.25. If this happens as expected, it may offer a good opportunity to join the upwards trend, but reduce position size to only 1-3% of equity at this time.
There is still some concern from classic technical analysis for the main Elliott wave count. ADX at the weekly chart level indicates now the trend is extreme. This is most commonly (not always) followed by a few weeks of downwards movement. On Balance Volume at the daily chart level gives a bearish signal.
The alternate wave count is possible.
New updates to this analysis are in bold.
Last monthly and weekly charts are here. Last historic analysis video is here.
MAIN ELLIOTT WAVE COUNT
WEEKLY CHART
Click chart to enlarge.
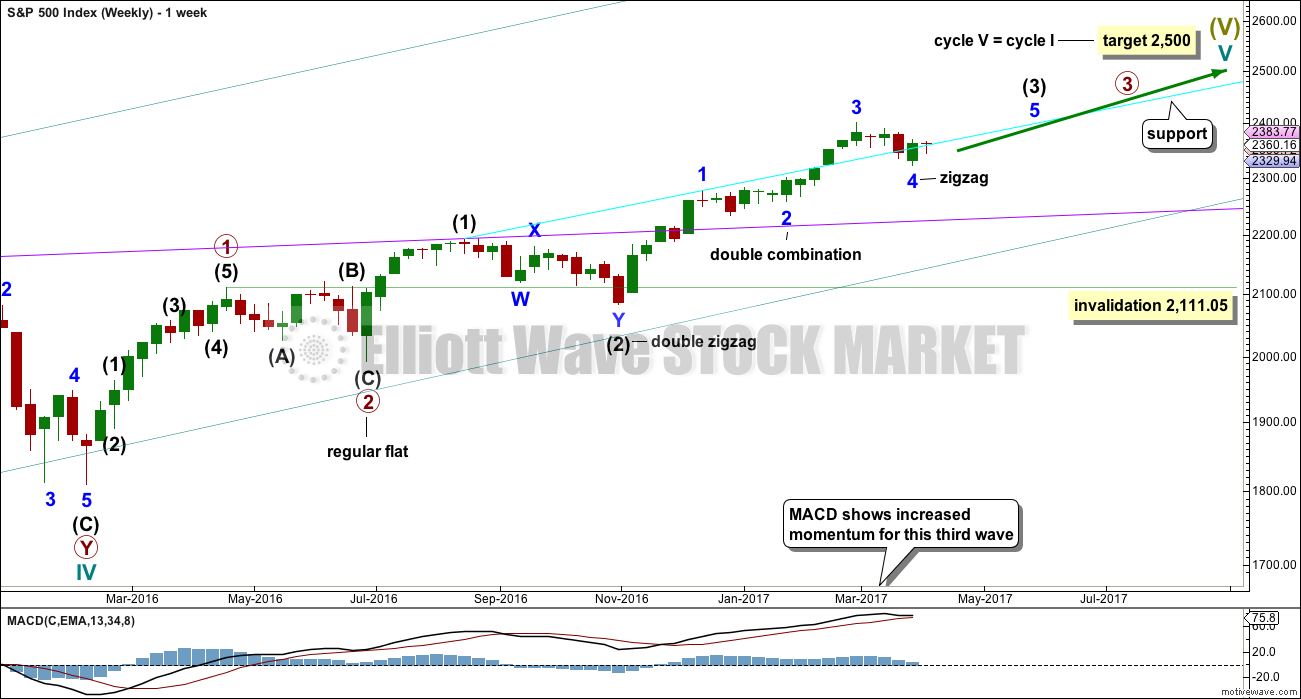
Cycle wave V is an incomplete structure. Within cycle wave V, primary wave 3 may be incomplete or it may be complete (alternate wave count below).
Primary wave 4 may not move into primary wave 1 price territory below 2,111.05.
DAILY CHART
Click chart to enlarge.
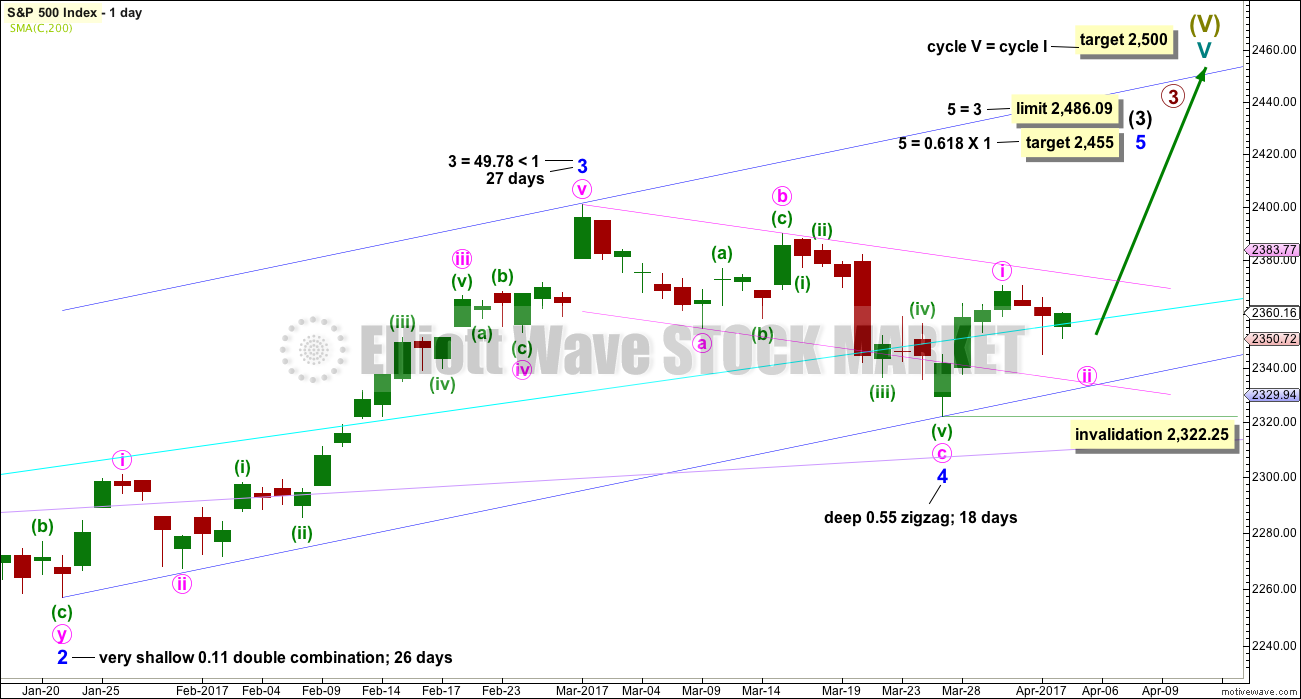
All subdivisions are seen in exactly the same way for both daily wave counts, only here the degree of labelling within intermediate wave (3) is moved down one degree.
This wave count expects the just completed correction is minor wave 4. Within minor wave 5, minute wave ii may not move beyond the start of minute wave i below 2,322.25.
Minor wave 4 is a little below the fourth wave of one lesser degree. Because it has now clearly breached an Elliott channel drawn using the first technique, the channel is now redrawn using Elliott’s second technique. There is good alternation between the very shallow combination of minor wave 2 and the deeper zigzag of minor wave 4.
If minor wave 4 is over, then a target for minor wave 5 is calculated.
The Elliott channel about minor wave 4 is drawn on the daily chart. The upper edge may be providing some resistance. Once price can break above this channel, then upwards momentum may build.
Minor wave 3 is shorter than minor wave 1. So that the core Elliott wave rule stating a third wave may not be the shortest is met, minor wave 5 is limited to no longer than equality in length with minor wave 3.
HOURLY CHART
Click chart to enlarge.
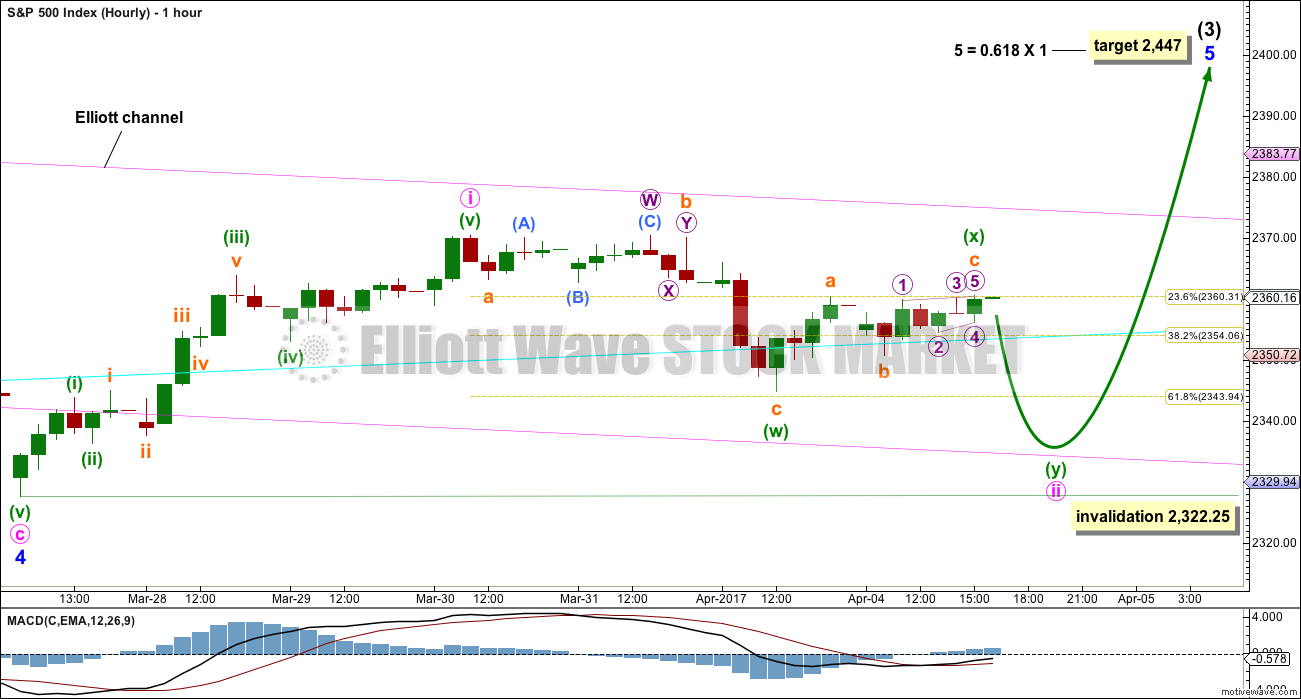
Minute wave i is complete, and it looks like minute wave ii is continuing further today.
Upwards movement for Tuesday’s session fits as a contracting diagonal. This may be an ending diagonal to complete a zigzag upwards. If this is correct, then minute wave ii is not over and this zigzag may be an X wave within a combination or double zigzag for minute wave ii.
The first zigzag in the correction now labelled minuette wave (w) has reached to the 0.618 Fibonacci ratio of minute wave i. If minute wave ii continues further as a double zigzag, it would move price lower to achieve the purpose of a double zigzag. It may find support at the lower edge of the pink Elliott channel copied over from the daily chart.
If minute wave ii continues as a combination, then the second structure in the double should move price sideways, so that it ends close to the same level of minuette wave (w) at 2,344.73 achieving the purpose of a combination.
Minuette wave (w) lasted two days. Minuette wave (y) may also last about two days.
Minute wave ii may not move beyond the start of minute wave i below 2,322.25.
A new low below 2,322.25 would see this main Elliott wave count discarded in favour of the alternate below.
ALTERNATE DAILY CHART
Click chart to enlarge.
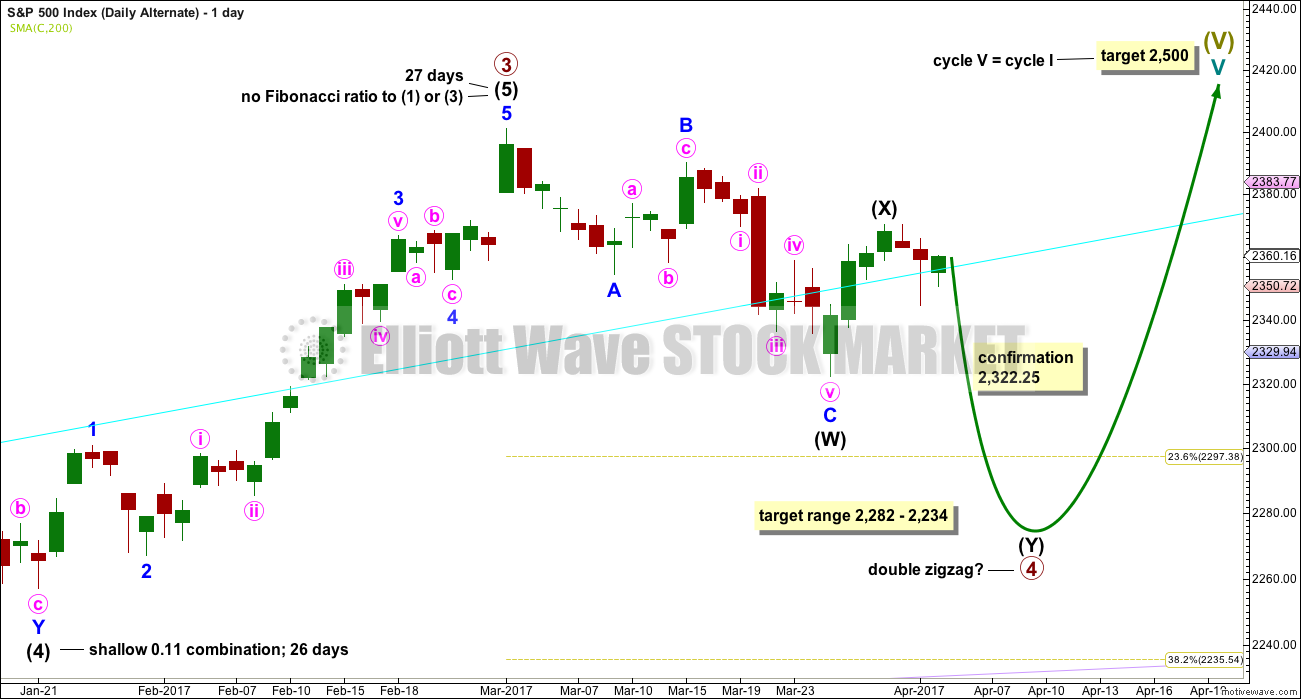
The subdivisions of upwards movement from the end of intermediate wave (2) are seen in the same way for both wave counts. The degree of labelling here is moved up one degree, so it is possible that primary wave 3 could be over.
Primary wave 2 was a flat correction lasting 47 days (not a Fibonacci number). Primary wave 4 may be unfolding as a double zigzag. It may total a Fibonacci 34 or 55 sessions.
Within double zigzags, the X wave is almost always brief and shallow. There is no rule stating a maximum for X waves, but they should not make a new price extreme beyond the start of the first zigzag in the double.
X waves within combinations may make new price extremes (they may be equivalent to B waves within expanded flats), but in this instance primary wave 4 would be unlikely to be a combination as it would exhibit poor alternation with the flat correction of primary wave 2.
For this alternate wave count intermediate wave (X) may now be complete. Both wave counts expect downwards movement: this alternate wave count to new lows for a second zigzag, which would be labelled intermediate wave (Y), and the main wave count for a brief pullback labelled minute wave ii. How low the next wave goes should indicate which wave count is correct. A new low now below 2,322.25 would see the main wave count discarded and this alternate confirmed.
If a new high above 2,400.98 is seen, then this alternate would be discarded.
The correction for primary wave 4 should be a multi week pullback, and it may not move into primary wave 1 price territory below 2,111.05.
TECHNICAL ANALYSIS
WEEKLY CHART
Click chart to enlarge. Chart courtesy of StockCharts.com.
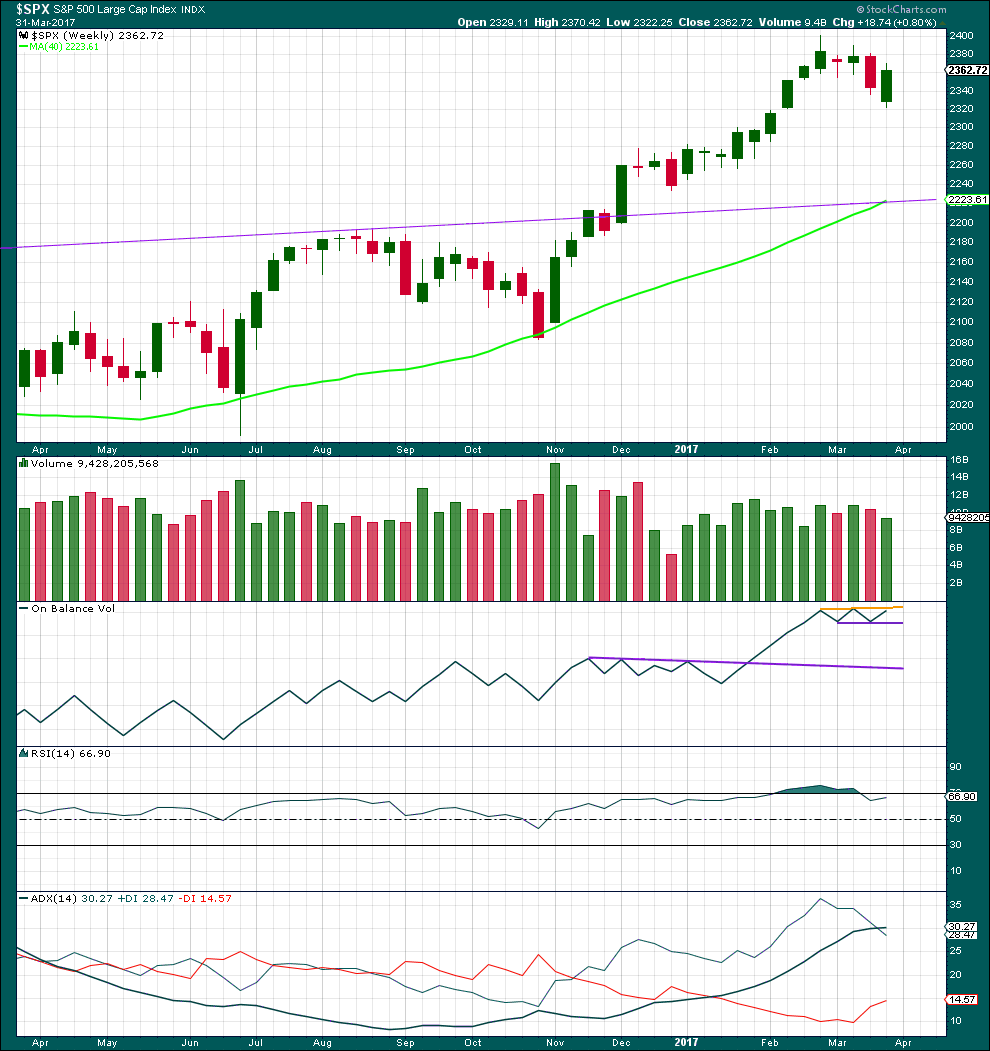
Last week completes a downwards week with a lower low and a lower high, but the week closes green and the balance of volume for the week is upwards. Although price has moved lower, the bulls rallied through to the end of the week to push price up above the open. This is bullish.
On Balance Volume now has a small range and it is constrained within. A breakout above or below would be a reasonable signal.
RSI is not overbought. There is room for price to rise.
ADX is now above both directional lines, so the trend is extreme. Looking back over the last 15 years at instances at the weekly chart level where ADX rose above both directional lines, this was most often followed by at least three or four downwards weeks. In one instance in December 2006 it was not, and this was towards the end of a third wave. In that instance, price continued overall higher for several weeks before a reasonable pullback.
ADX at the weekly chart level favours the alternate wave count, but it does not rule out the main wave count.
DAILY CHART
Click chart to enlarge. Chart courtesy of StockCharts.com.
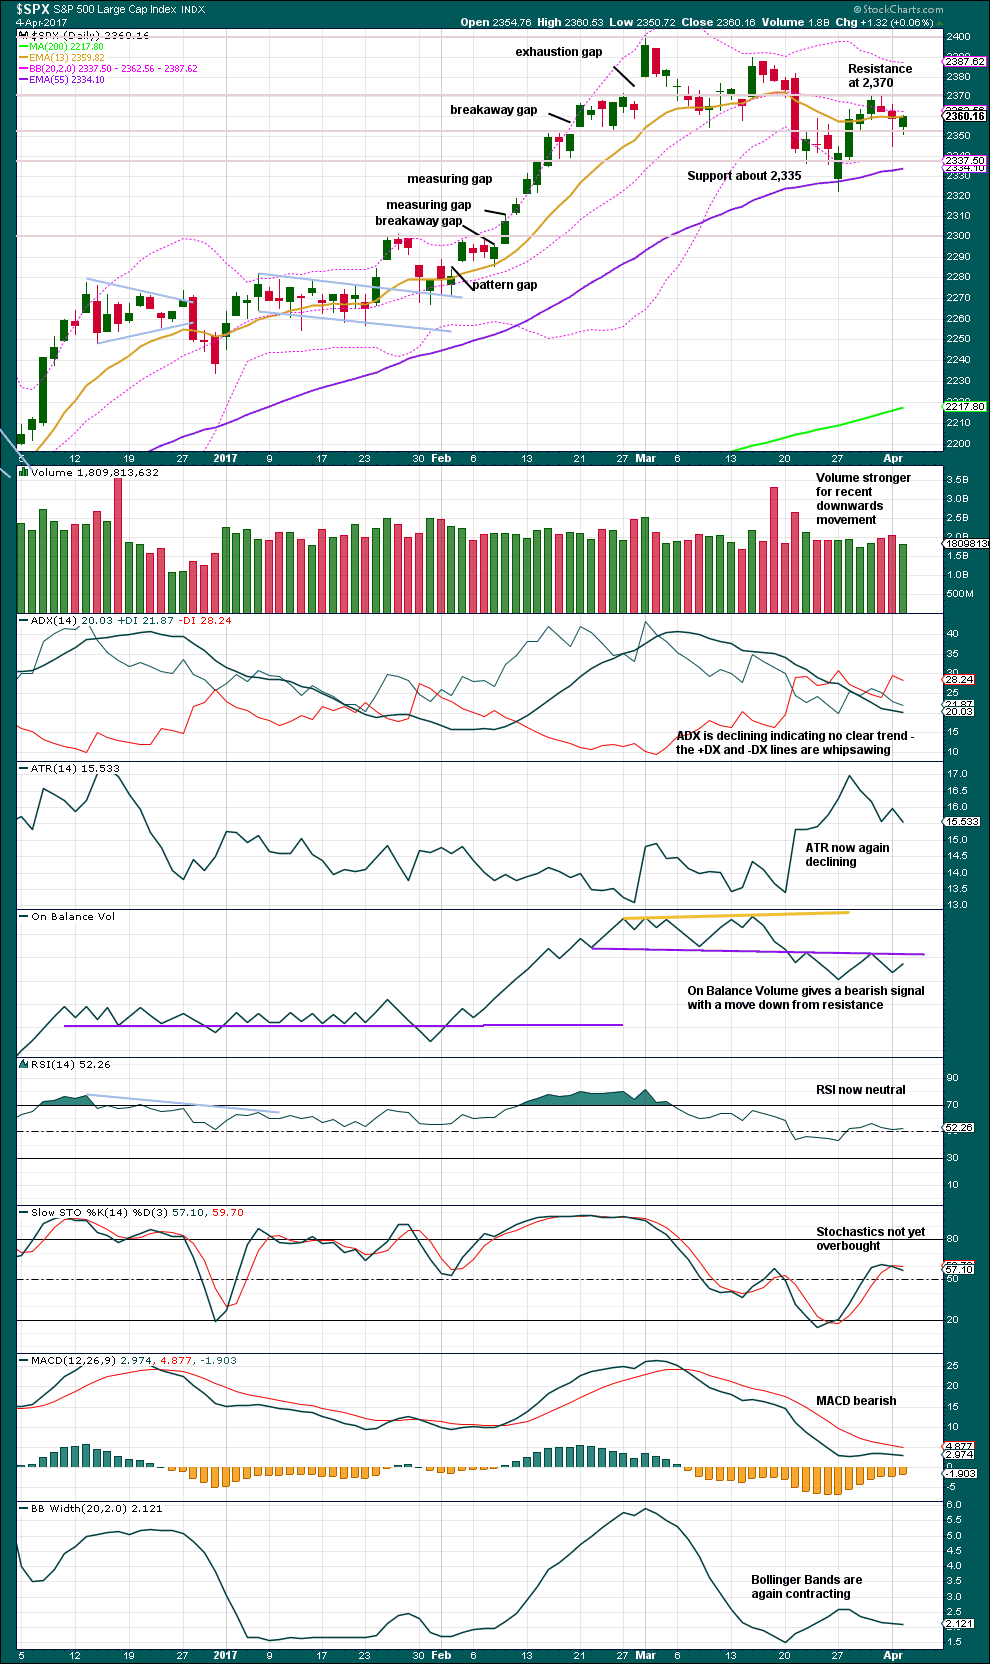
A small inside day has a balance of volume upwards and a decline in volume.
The S&P is range bound with resistance about 2,270 and support about 2,335. During this range bound period, it is the downwards days of the 31st of March and the 2nd of April that have strongest volume. This suggests a downwards breakout is more likely than upwards, and it favours the alternate Elliott wave count.
ADX, ATR and Bollinger Bands all indicate this market is consolidating.
On Balance Volume is bearish.
VOLATILITY – INVERTED VIX CHART
Click chart to enlarge. Chart courtesy of StockCharts.com.
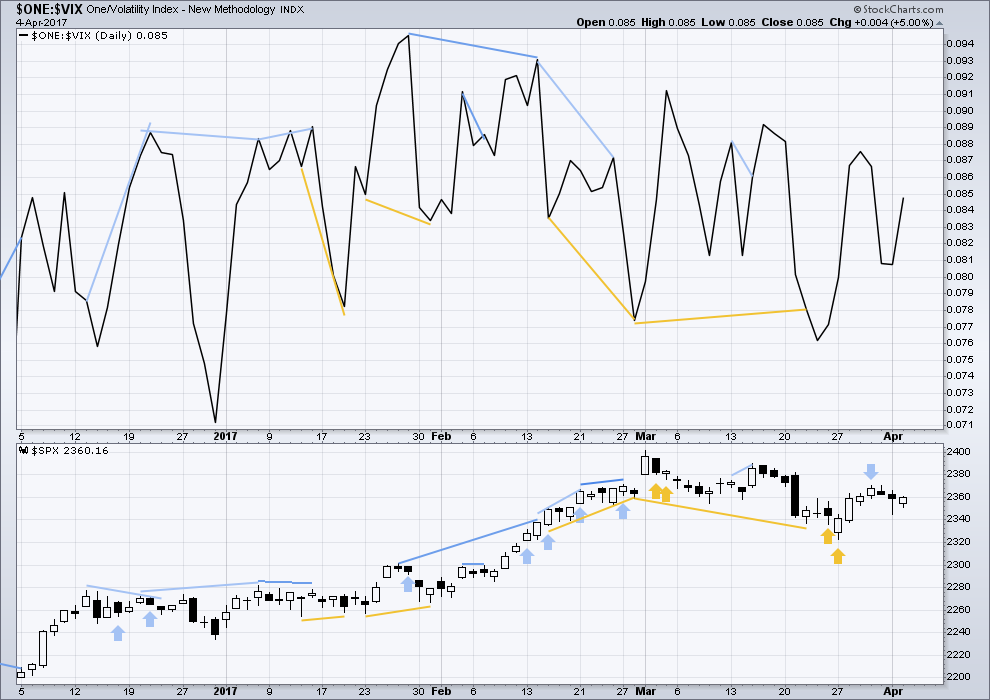
Normally, volatility should decline as price moves higher and increase as price moves lower. This means that normally inverted VIX should move in the same direction as price.
Bearish divergence and bullish divergence spanning a few short days used to be a fairly reliable indicator of the next one or two days direction for price; normally, bearish divergence would be followed by one or two days of downwards movement and vice versa for bullish divergence.
However, what once worked does not necessarily have to continue to work. Markets and market conditions change. We have to be flexible and change with them.
Recent unusual, and sometimes very strong, single day divergence between price and inverted VIX is noted with arrows on the price chart. Members can see that this is not proving useful in predicting the next direction for price.
Divergence will continue to be noted, particularly when it is strong, but at this time it will be given little weight in this analysis. If it proves to again begin to work fairly consistently, then it will again be given weight.
There is no new divergence noted today between price and inverted VIX.
BREADTH – AD LINE
Click chart to enlarge. Chart courtesy of StockCharts.com.
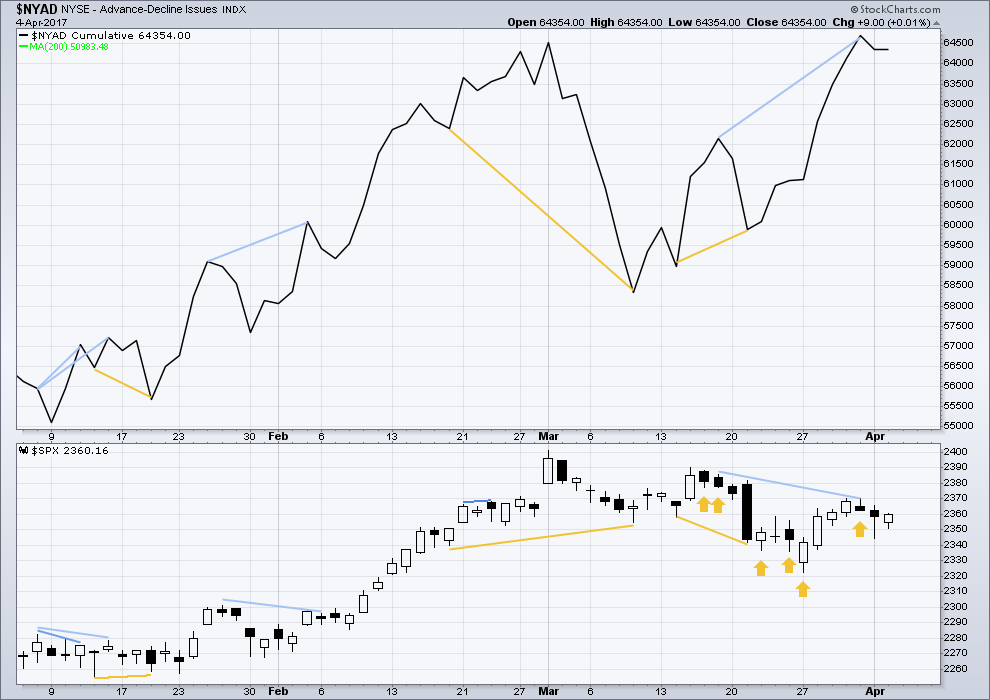
The rise in price has support from a rise in market breadth. Lowry’s OCO AD line also shows new highs along with price. Normally, before the end of a bull market the OCO AD line and the regular AD line should show divergence with price for about 4-6 months. With no divergence, this market has support from breadth.
There is short term bullish divergence between the AD line and price from yesterday’s low to the low of 14th of March (and also back to the 9th of March). Price has not come with a corresponding decline in market breadth while it has made a new low. There is weakness within this downwards movement from price. This supports the main hourly Elliott wave count which sees a low in place.
There is no new divergence today between price and the AD line.
DOW THEORY
The DJIA, DJT, S&P500 and Nasdaq continue to make new all time highs. This confirms a bull market continues.
This analysis is published @ 07:53 p.m. EST.
I have had to take a relative for surgery today, and we had a long detour on our route thanks to the tail end of ex Tropical Cyclone Debbie.
That’s why analysis is later than usual. So please accept my apologies.
Home now and analysis will be published shortly.
Thank you all for your patience.
No worries mate. I just got home myself.
No problem. My day is only just starting.
Oh, I hope everything is okay. Family takes precedence. Thanks for the notice.
Yikes!!! So sorry about the triple posts. My tablet was stuck and like a dummy I kept pressing. Lara feel free to delete at will…
Ok, no worries. 🙂
hey. you all are much more knowledgeable than myself about Elliott wave stuff. I try to use Lara’s knowledge and your comments to inform my trading. So, if anybody is interested in trading… I recently established iron condors that realize full profit if SPX does the following on these expiration days:
April 7: closes between 2320 and 2380
April 13: closes between 2325 and 2400
April 19: closes between 2320 and 2390
April 28: closes below 2390 (that is the short of a call spread, not a condor).
Those prices are the short puts and the short calls of the condors. I did these based on two things: (1) lara’s analysis and (2) analysis of the weekly closes of the SPX over the last 5 years.
I think that the political circus approaching the April 28 expiration of the federal funding authorization will dampen the rise of the SPX. At least temporarily.
Thanks Lance. Credit spreads are the smartest trades you can make in this market. Position and swing trader are being mercilessly whipsawed. I think this will continue so one has to be extremely nimble if not using spreads.
I have some time waiting for my wife to finish shopping and spending. Quite a late day reversal. Seems to me we may have seen a bull trap with the gap up opening. Looks like more downside ahead. Baton the hatches and hold on!
Yep!
Another first wave up and now second wave down. The 0.618 Fibonacci ratio for minuette (ii) may be a preferred end point for it.
It looks like minute ii is over.
I shorted this move up…looking for more red… 🙂
Very classic bull trap, this looks like a B wave that has completed, with C of 4 coming if they allow it!! Vol trades finally getting some juice. The bearish engulfing candle on the Russell is quite sexy.
Wily Mr. Market trapped quite a few bulls today as I suspected he might. I thought that gap open was waaaaay too cute.(no volume)
Nice double on timely acquired 133 triple Q puts!
Also grabbed miners at the lows…
Nice Verne, I happen to tag NUGT at 5.78 a ways back, targeting 16. Triple Top Breakout on the 1 box Point and Figure today too! Gold looks like its got $60 of near term upside in it as well. A lot of the big fund traders I know have been using GLD as a hedge instead of VIX as they know the banksters are shorting VIX>
The big question now in my mind is if they can continue to suppress volatility on this C wave down. It should be a sharp impulsive 5 wave down to complete what looks to me like a 5,3,5 zig zag correction. VIX should print mostly green candles for its duration. I think the key will be the 200 day moving average as every single attempt to take it has been smacked down. If VIX does not rise above it on this C wave down we may not see capitulation on this correction. The BBs need to expand as the C wave down progresses and the 200 dma around 13.50 for VIX will have to switch from being resistance to support until the wave completes. All eyes are now looking to the fall for a final top and I think they are right. I do expect quite a few giddy bulls to get shaken out on this leg down prior to the final run. There is stll waaaaaay to much complacency in this market, and VIX is way long overdue for a rise up to touch its descending trend line. VIX went down to 10.9 today…incredible!!!
This chart got squashed in the last 20 mins. What a dump.
What is the confirmation/confidence level that minute wave iii has begun? I see the invalidation of main wave count being 2322.25 but no confirmation level for wave iii in the analysis (maybe I’m missing it in my reading?). I see SPX500 hit 2378 this morning, so would be curious if this ‘breakout’ over the previous 2370 resistance level is confirmation of wave iii having begun?
Thanks,
Rob
Same thoughts. Figured 2370 was the magic number moving upward and away.
Hello Robert & Joshua,
Please see my annotation on Lara’s hourly chart, sent after the close of Monday for how I confirm the wave 3 using trend line. It is closer to 2370 by coincidence. Welcome comments from Lara & everyone.
Best
Ranjith
I haven’t given one because there can’t be an upper invalidation point for the alternate daily count.
Within primary 4 it’s possible that intermediate (X) could make a new high. Primary 4 could be a combination; zigzag – X – flat or triangle.
It’s a massive nuisance I know, but it is what it is.
When there’s a five up then I’ll discard the alternate.
Frost and Prechter state that rarely wave 2 takes the form of a triangle which in their estimation is actually a double 3. Struggled with that last night as that sure looks like a triangle breakout abcde. Glad to be on the right side of it
Pole position.
ah ha,, so you are a pole dancer? Alan is a strange name for a pole dancer, usually something like Bambi, or Precious..
Nah. In motor racing, pole position means clinching the first position. Duh.
I see you have only just been introduced to Doc’s wry sense of humor. I suspect that he was just pulling your leg! (so to speak!) 😀
I think we just had the end of a B wave up and should complete the correction with a sharp C to the downside….
Yep. Doc is our resident jokester 🙂
I apolergize,, dumb joke
I got a chuckle and I am sure Alan understands. I am glad I restrained the witty rejoinder I contemplated… 🙂
No problemo.