
Upwards movement continues as the Elliott wave count expects overall at the daily chart level.
Summary: The next wave up to a target at 2,455 may have begun. The invalidation point is at 2,322.25. When a five up for minute wave i is complete, then a three down for minute wave ii may be brief and shallow and may offer a good entry opportunity to join the upwards trend.
New updates to this analysis are in bold.
Last monthly and weekly charts are here. Last historic analysis video is here.
MAIN ELLIOTT WAVE COUNT
WEEKLY CHART
Click chart to enlarge.
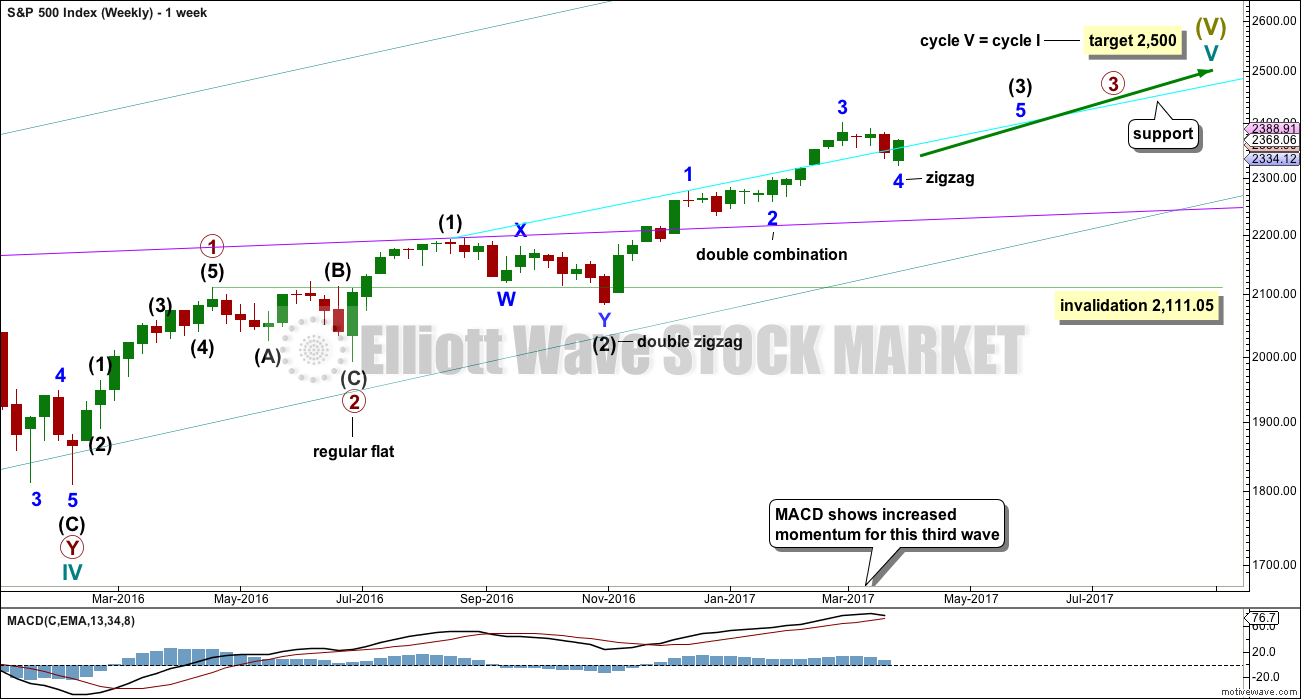
Cycle wave V is an incomplete structure. Within cycle wave V, primary wave 3 may be incomplete or it may be complete (alternate wave count below).
Primary wave 4 may not move into primary wave 1 price territory below 2,111.05.
DAILY CHART
Click chart to enlarge.
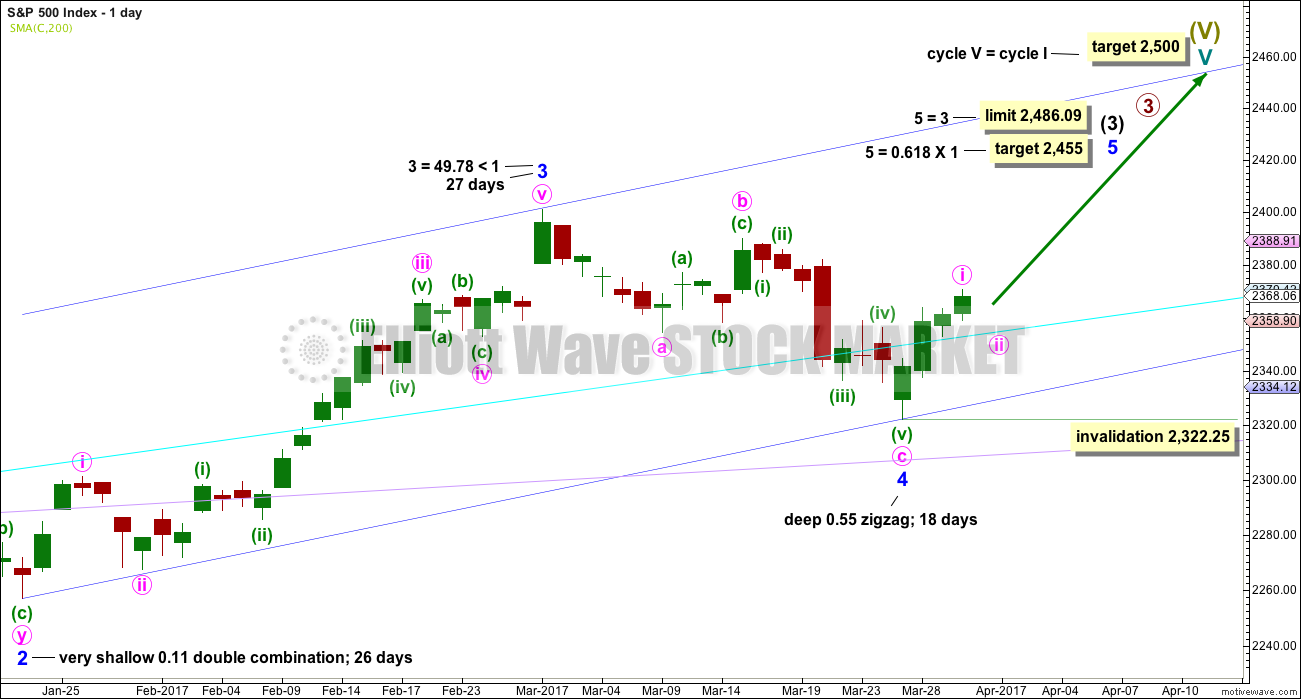
All subdivisions are seen in exactly the same way for both daily wave counts, only here the degree of labelling within intermediate wave (3) is moved down one degree.
This wave count expects the just completed correction is minor wave 4, which may not move into minor wave 1 price territory below 2,277.53. Now that minor wave 4 looks complete and price has moved up and away for three days, the invalidation point is moved up for this main wave count. Within minor wave 5, no second wave correction may move beyond its start below 2,322.25.
Minor wave 4 is a little below the fourth wave of one lesser degree. Because it has now clearly breached an Elliott channel drawn using the first technique, the channel is now redrawn using Elliott’s second technique. There is good alternation between the very shallow combination of minor wave 2 and the deeper zigzag of minor wave 4.
If minor wave 4 is over, then a target for minor wave 5 is calculated.
The cyan line may now offer some support.
Minor wave 3 is shorter than minor wave 1. So that the core Elliott wave rule stating a third wave may not be the shortest is met, minor wave 5 is limited to no longer than equality in length with minor wave 3.
HOURLY CHART

Click chart to enlarge.
The structure of minute wave i may be very close to completion. At the five minute chart level, minuette wave (v) can be seen as a complete five wave impulse. Within minuette wave (v), the second wave corrections are more time consuming and show up on the hourly chart, but their counterpart fourth wave corrections are quick and brief and do not show up on the hourly chart.
A best fit channel is drawn about minute wave i. The bottom line here is that while price remains within this channel expect it is likely to continue higher. Only when this channel is breached may confidence be had in this view that minute wave ii is underway. This analysis comes with a strong caveat while price remains within the channel: the channel needs to be breached for confidence.
Classic technical analysis today indicates strong resistance, so it looks reasonably likely that minute wave i could be over and minute wave ii could begin tomorrow.
If minute wave ii does begin tomorrow, then it may end about the 0.382 Fibonacci ratio, about 2,354, and may find support at the cyan trend line.
Minute wave ii may not move beyond the start of minute wave i below 2,322.25.
ALTERNATE DAILY CHART
Click chart to enlarge.
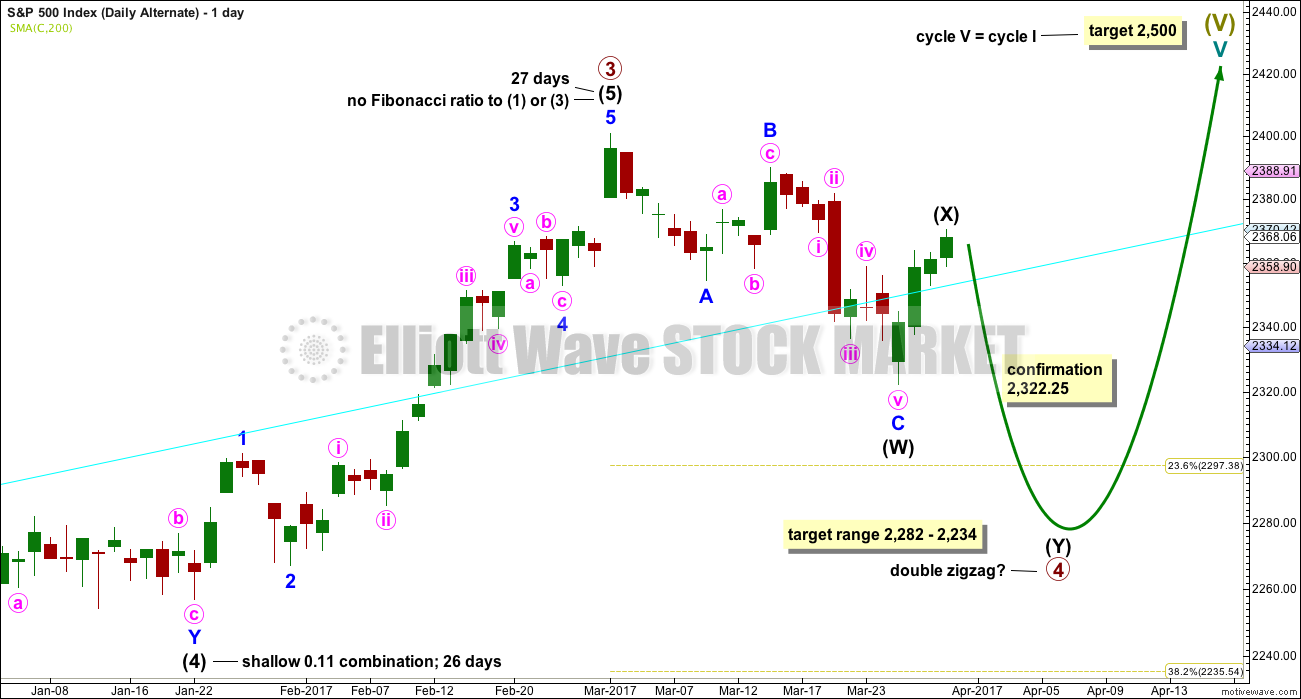
The subdivisions of upwards movement from the end of intermediate wave (2) are seen in the same way for both wave counts. The degree of labelling here is moved up one degree, so it is possible that primary wave 3 could be over.
Primary wave 2 was a flat correction lasting 47 days (not a Fibonacci number). Primary wave 4 may be unfolding as a double zigzag. It may total a Fibonacci 34 or 55 sessions.
Within double zigzags, the X wave is almost always brief and shallow. There is no rule stating a maximum for X waves, but they should not make a new price extreme beyond the start of the first zigzag in the double.
X waves within combinations may make new price extremes (they may be equivalent to B waves within expanded flats), but in this instance primary wave 4 would be unlikely to be a combination as it would exhibit poor alternation with the flat correction of primary wave 2.
For this alternate wave count intermediate wave (X) may end very soon. Thereafter, both wave counts would expect downwards movement: this alternate wave count to new lows for a second zigzag, which would be labelled intermediate wave (Y), and the main wave count for a brief shallow pullback labelled minute wave ii. How low the next wave goes should indicate which wave count is correct. A new low now below 2,322.25 would see the main wave count discarded and this alternate confirmed.
If a new high above 2,400.98 is seen, then this alternate would be discarded.
The correction for primary wave 4 should be a multi week pullback, and it may not move into primary wave 1 price territory below 2,111.05.
TECHNICAL ANALYSIS
WEEKLY CHART
Click chart to enlarge. Chart courtesy of StockCharts.com.
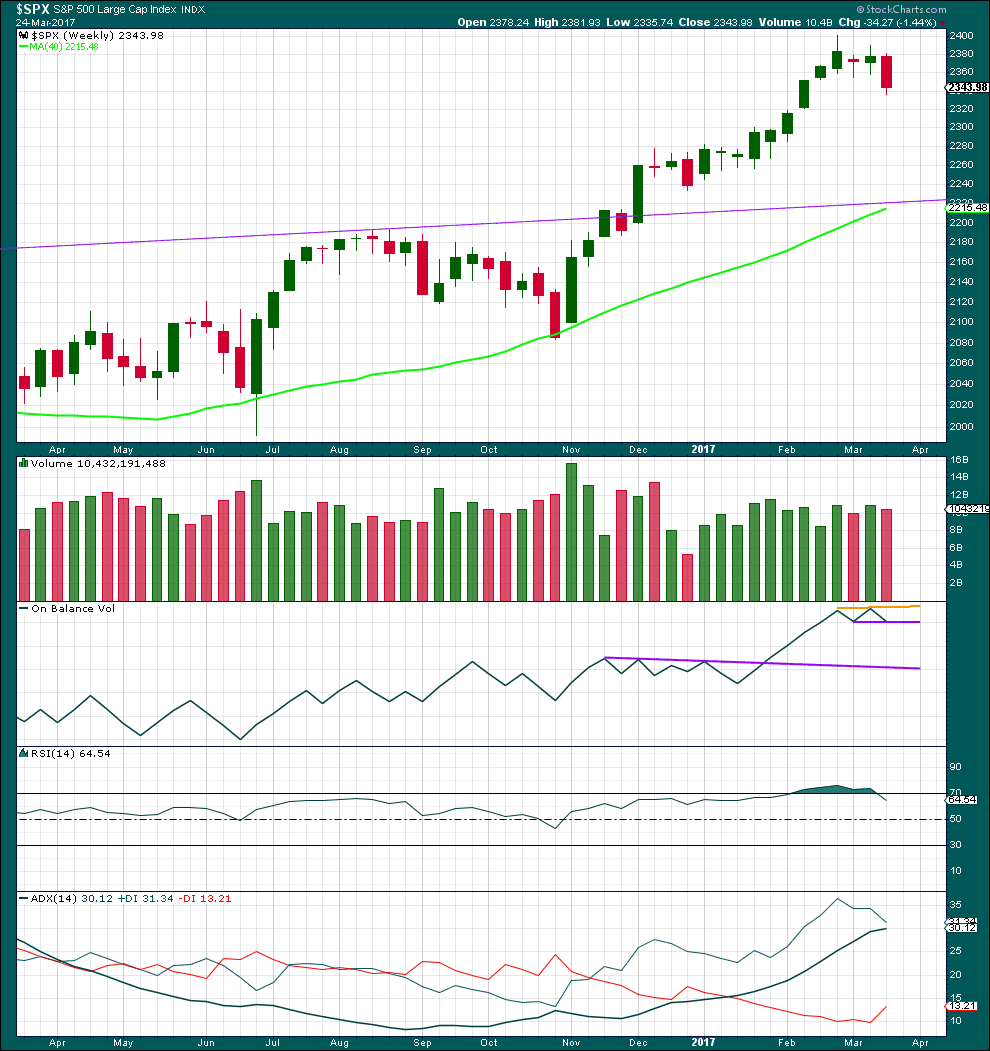
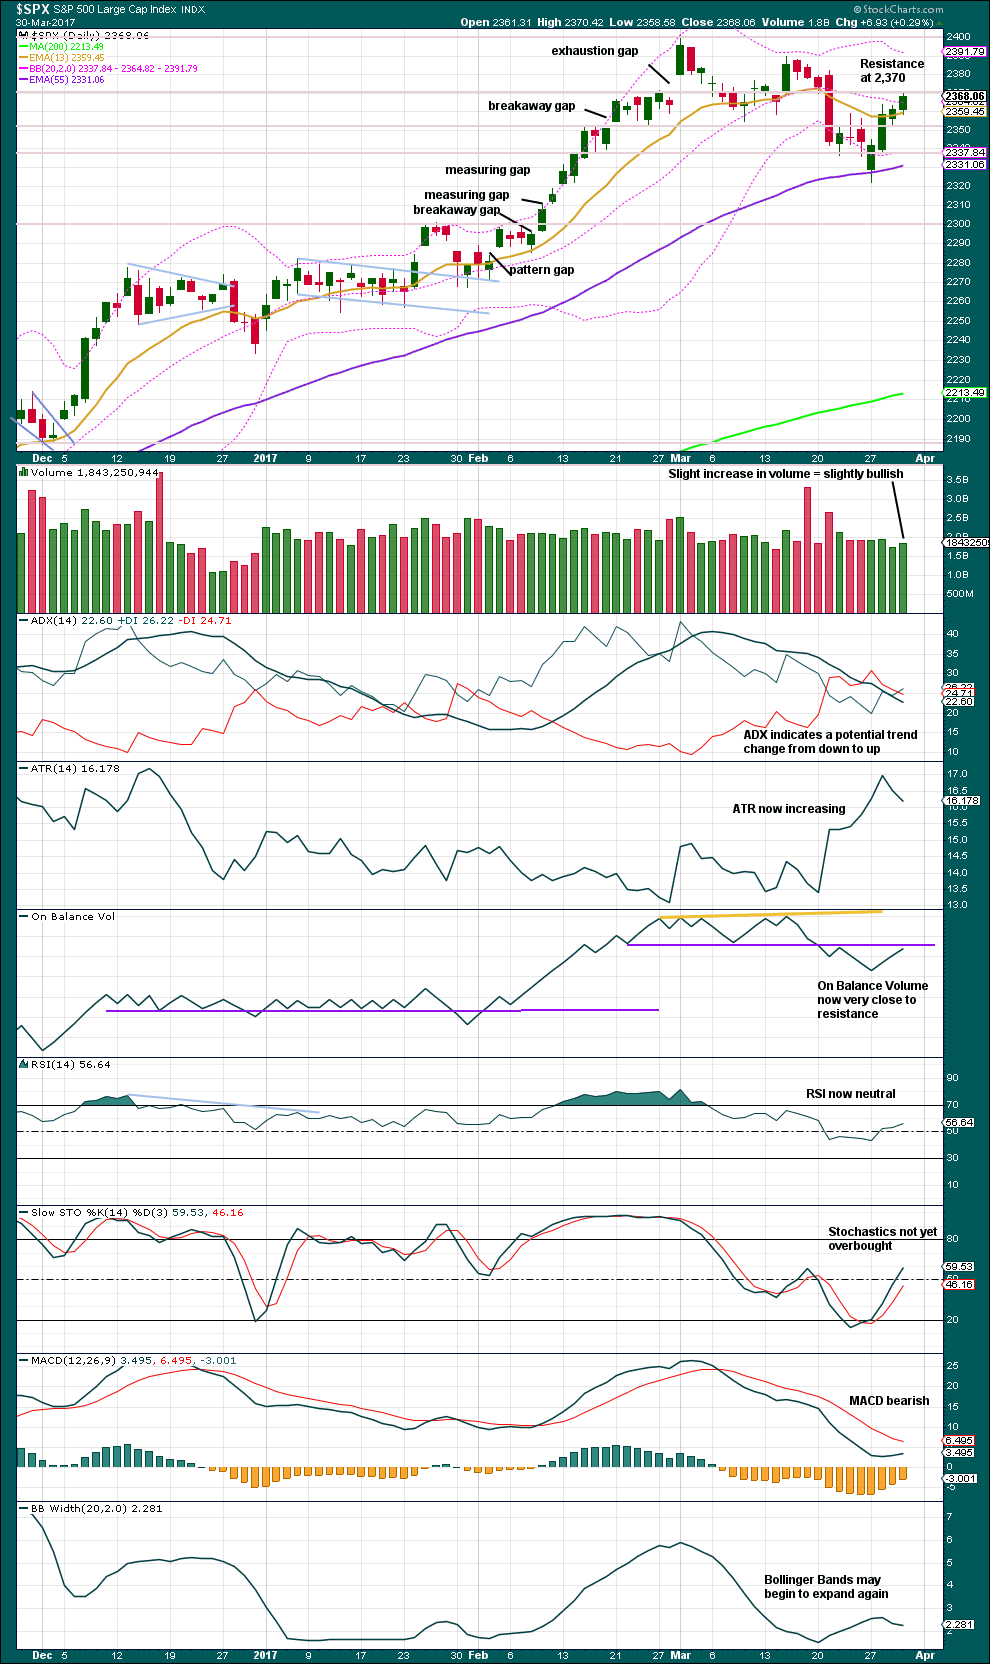
The week before last completed a green weekly candlestick that moved price upwards on some increase in volume. Now last week completes a red weekly candlestick that moves price lower on a slight decline in volume. The volume profile short term looks bullish.
New trend lines are drawn across On Balance Volume, but these do not yet have any reasonable technical significance.
RSI is now back down from overbought.
ADX still indicates an upwards trend that is not yet extreme, but it is nearing extreme.
DAILY CHART
Click chart to enlarge. Chart courtesy of StockCharts.com.
Price is at strong resistance about 2,370. Some reaction here would be a reasonable expectation.
Volume is bullish. ATR is mostly bullish.
MACD is still bearish.
RSI and Stochastics are both neutral.
On Balance Volume is important today. It is at or very close to resistance. The purple line may force the end of minute wave i and the start of minute wave ii.
VOLATILITY – INVERTED VIX CHART
Click chart to enlarge. Chart courtesy of StockCharts.com.
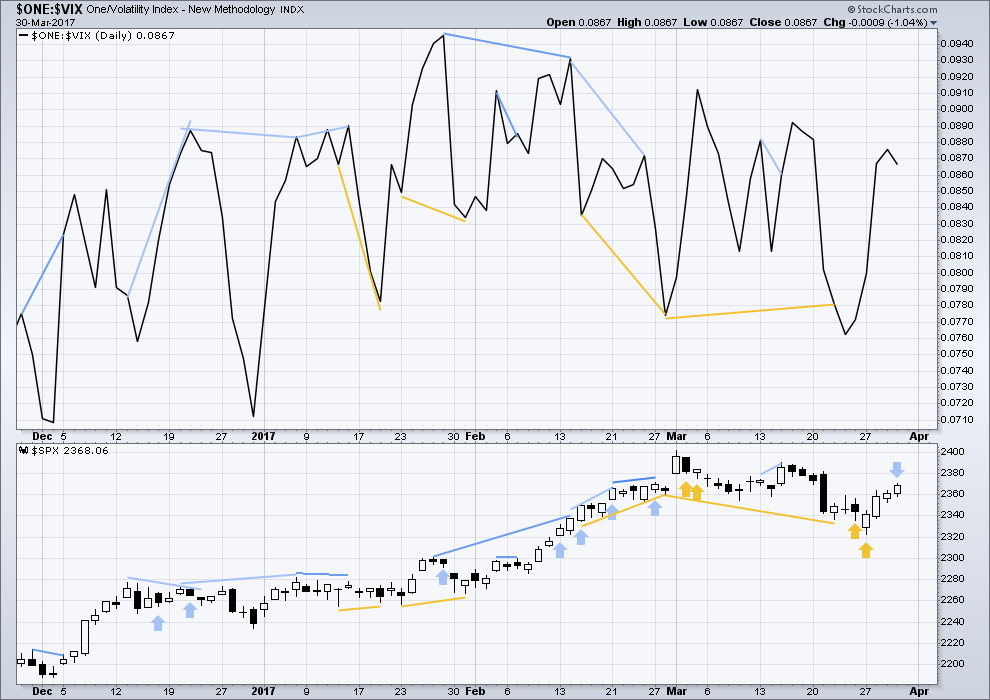
Normally, volatility should decline as price moves higher and increase as price moves lower. This means that normally inverted VIX should move in the same direction as price.
Bearish divergence and bullish divergence spanning a few short days used to be a fairly reliable indicator of the next one or two days direction for price; normally, bearish divergence would be followed by one or two days of downwards movement and vice versa for bullish divergence.
However, what once worked does not necessarily have to continue to work. Markets and market conditions change. We have to be flexible and change with them.
Recent unusual, and sometimes very strong, single day divergence between price and inverted VIX is noted with arrows on the price chart. Members can see that this is not proving useful in predicting the next direction for price.
Divergence will be continued to be noted, particularly when it is strong, but at this time it will be given little weight in this analysis. If it proves to again begin to work fairly consistently, then it will again be given weight.
Price moved higher today with a higher high and a higher low, but inverted VIX has moved lower. Volatility increased as price moved up today, and this should be interpreted as bearish. This divergence today offers slight support for the hourly Elliott wave count.
BREADTH – AD LINE
Click chart to enlarge. Chart courtesy of StockCharts.com.
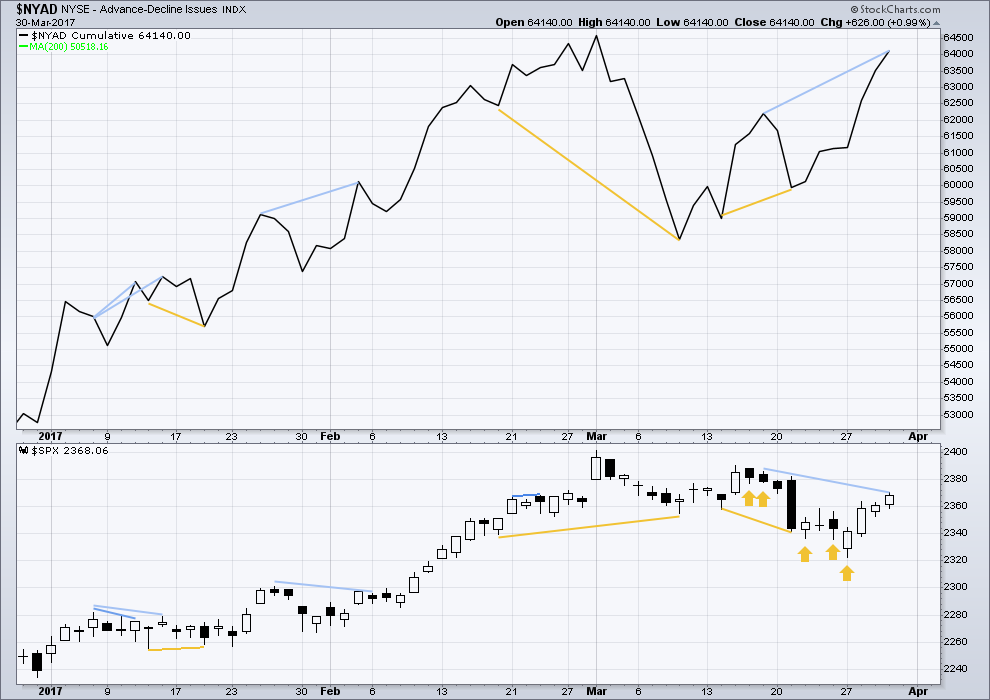
The rise in price has support from a rise in market breadth. Lowry’s OCO AD line also shows new highs along with price. Normally, before the end of a bull market the OCO AD line and the regular AD line should show divergence with price for about 4-6 months. With no divergence, this market has support from breadth.
There is short term bullish divergence between the AD line and price from yesterday’s low to the low of 14th of March (and also back to the 9th of March). Price has not come with a corresponding decline in market breadth while it has made a new low. There is weakness within this downwards movement from price. This supports the main hourly Elliott wave count which sees a low in place.
There is still short term bearish divergence today between today’s high and the high of the 17th of March. This indicates weakness in price and it may be followed by one or two downwards days. This divergence has persisted now for three days and has not been followed by any downwards movement. The divergence still exists, but as price moves higher it gets weaker.
DOW THEORY
The DJIA, DJT, S&P500 and Nasdaq continue to make new all time highs. This confirms a bull market continues.
This analysis is published @ 08:29 p.m. EST.
Minute wave i looks to be done and minute ii looks to be underway. So far it’s just a very shallow sideways move, but we have seen that before back in July and November 2016. At the start of those waves up the very first second wave correction was 0.296 (July) and 0.34 (November).
So we shouldn’t necessarily wait for minute ii to get deep, it may not do it.
In fact, the November 2016 second wave didn’t even print a doji or a red candlestick. Only a long lower wick on a green candlestick.
However, minute ii is especially shallow and I am having a bit of a hard time trying to see it as a complete structure. It will fit as a double combination, but within the second structure subminuette wave b looks forced.
I’m skeptical TBH that minute ii is over here, not even at the 0.236 Fibonacci ratio. Which makes me a bit nervous to go long right now…
Let’s see how the session ends and what volume has to say to us.
I am hoping to deploy my other 1/2 position in my short term account. Looking to move both long and medium accounts to 100% long as well. First move up to breakout I am looking to pounce on it. Otherwise, I will wait to see if we can go long on the down move.
I missed both of the breakout moves to new highs you mention above, July and November. I was waiting for a deeper pullback that did not materialize. Those were both within a third wave. Perhaps relatively short and shallow corrections should be expected in the most powerful wave of the full impulse.
Even though SPX was down 1/4% today, IWM was up a bit and TNA added another 1/2%. IWM has achieved a bullish crossover on the daily chart. Perhaps IWM will lead the break higher to new ath’s.
Have a great weekend.
They were both within a third wave, if my main wave count is correct. They were both within primary wave 3, it’s early stages.
Now we’re still in a third wave, but now we’re within it’s fifth wave.
I cannot tell you for sure how price is going to behave here, only that with us missing those second wave corrections (expecting them to be deeper than they were) I don’t want that to happen again.
my Kiwi calling must be improving,, I found a whole bunch of em at Costco
Do you mean in the frozen fryers section or the live farm animals? Or rather did you meet a bunch of New Zealanders carousing the store?
Funny, once you take their skin off you got some good eatin.
Really hoping you mean the fruit and not the people…
LMAO
Yeah, I think he means the fruit 🙂
Nice one Doc
yup,, its me again
Hiya Doc!