
A small inside day fits within the Elliott wave count. The candlestick closed green and the balance of volume for the session was upwards. Overall, today may be read as neutral.
Summary: The next wave up to a target at 2,455 may have begun. The invalidation point is at 2,327.58. When a five up for minute wave i is complete, then a three down for minute wave ii may be brief and shallow and may offer a good entry opportunity to join the upwards trend.
New updates to this analysis are in bold.
Last monthly and weekly charts are here. Last historic analysis video is here.
MAIN ELLIOTT WAVE COUNT
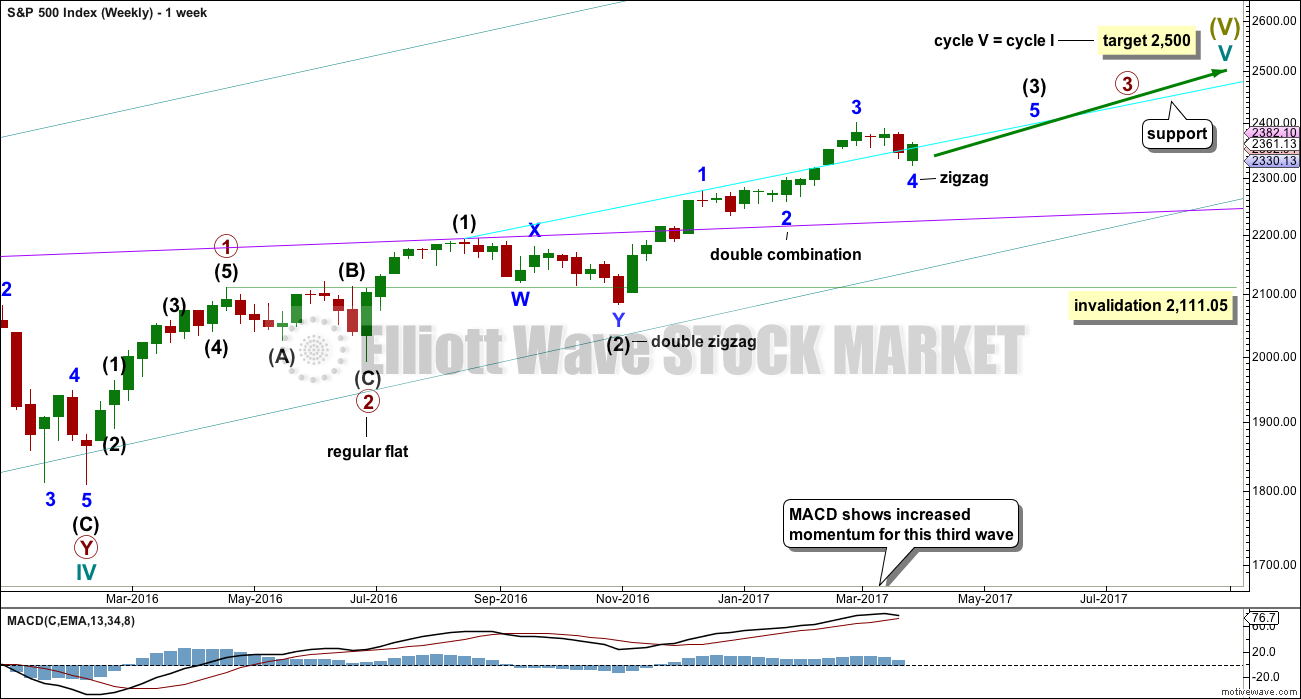
WEEKLY CHART
Click chart to enlarge.
Cycle wave V is an incomplete structure. Within cycle wave V, primary wave 3 may be incomplete or it may be complete (alternate wave count below).
Primary wave 4 may not move into primary wave 1 price territory below 2,111.05.
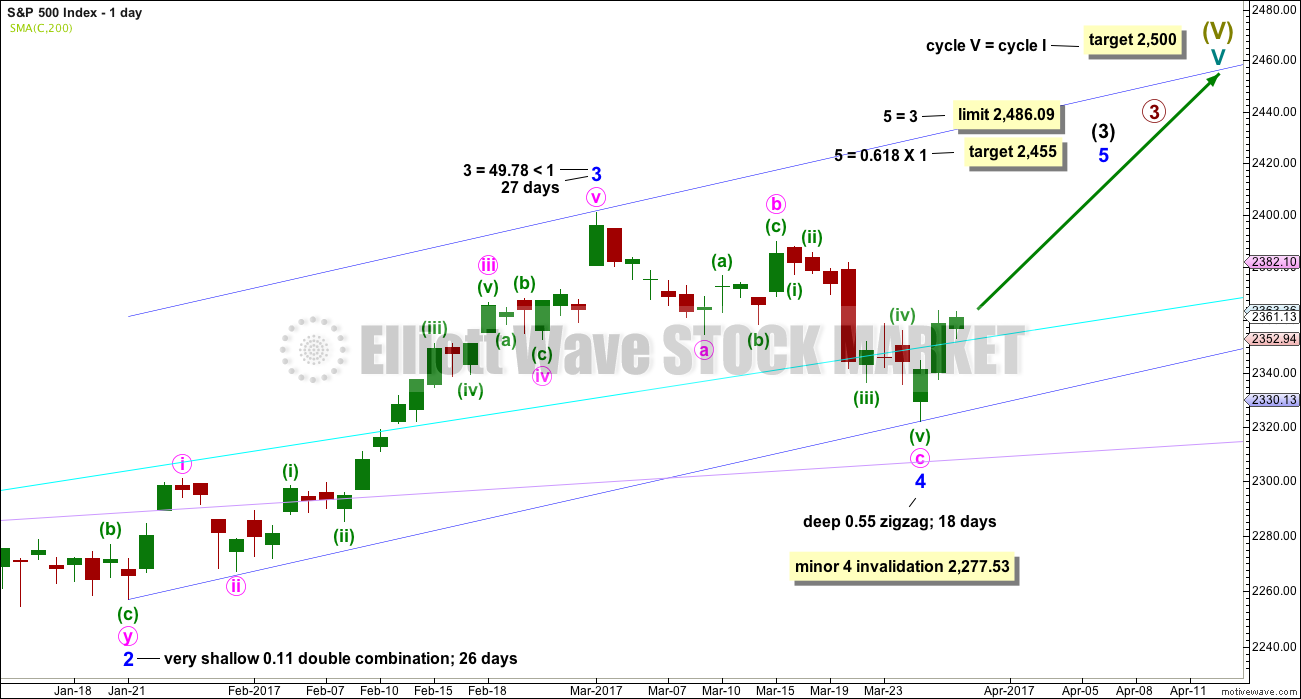
DAILY CHART
Click chart to enlarge.
All subdivisions are seen in exactly the same way for both daily wave counts, only here the degree of labelling within intermediate wave (3) is moved down one degree.
This wave count expects the current correction is minor wave 4, which may not move into minor wave 1 price territory below 2,277.53. A new low below this point would confirm the correction could not be minor wave 4 and that would provide confidence it should be primary wave 4.
Minor wave 4 is a little below the fourth wave of one lesser degree. Because it has now clearly breached an Elliott channel drawn using the first technique, the channel is now redrawn using Elliott’s second technique. There is good alternation between the very shallow combination of minor wave 2 and the deeper zigzag of minor wave 4.
If minor wave 4 is over, then a target for minor wave 5 is calculated.
Although price breached the cyan trend line, price has today printed a full daily candlestick back above the trend line. The cyan line may now offer some support.
Minor wave 3 is shorter than minor wave 1. So that the core Elliott wave rule stating a third wave may not be the shortest is met, minor wave 5 is limited to no longer than equality in length with minor wave 3.
HOURLY CHART

Click chart to enlarge.
The structure of minute wave i may be very close to completion. At the five minute chart level, it looks like minuette wave (v) may possibly be unfolding as an ending contracting diagonal. If this is correct, it would be extremely unlikely to end in a truncation. Minuette wave (v) is extremely likely to make a slight new high above the end of minuette wave (iii) at 2,363.78.
As soon as minuette wave (v) makes a slight new high, then it would be possible that minute wave i could be over. If price then turns downwards, expect that minute wave ii has arrived.
At that stage, draw a Fibonacci retracement alone the length of minute wave i. If either the 0.382 or 0.618 Fibonacci ratios bisect the cyan or pink trend lines, then look out for price to find support there.
Minute wave i may end tomorrow lasting a Fibonacci three days. If that is how it unfolds, then expect minute wave ii to last only two or three days.
Minute wave ii may not move beyond the start of minute wave i below 2,327.58.
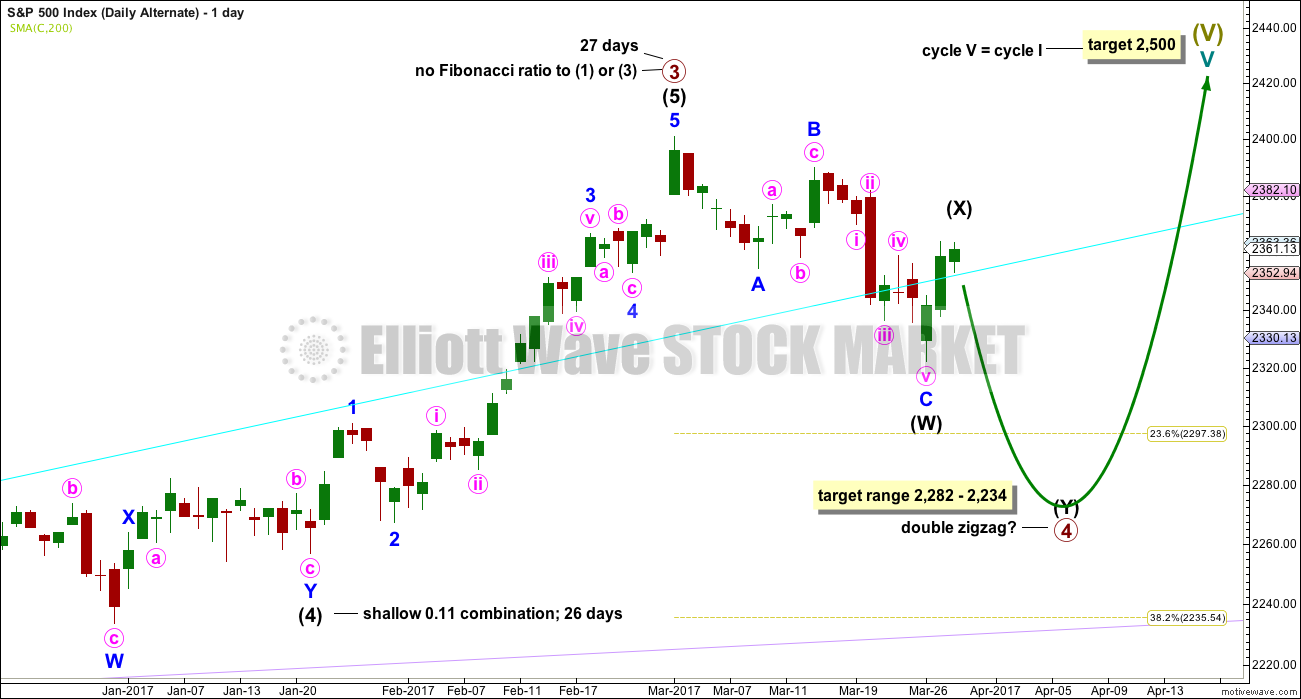
ALTERNATE DAILY CHART
Click chart to enlarge.
The subdivisions of upwards movement from the end of intermediate wave (2) are seen in the same way for both wave counts. The degree of labelling here is moved up one degree, so it is possible that primary wave 3 could be over.
Primary wave 2 was a flat correction lasting 47 days (not a Fibonacci number). Primary wave 4 may be unfolding as a double zigzag. It may total a Fibonacci 34 or 55 sessions.
Within double zigzags, the X wave is almost always brief and shallow. There is no rule stating a maximum for X waves, but they should not make a new price extreme beyond the start of the first zigzag in the double.
X waves within combinations may make new price extremes (they may be equivalent to B waves within expanded flats), but in this instance primary wave 4 would be unlikely to be a combination as it would exhibit poor alternation with the flat correction of primary wave 2.
For this alternate wave count intermediate wave (X) may end very soon. Thereafter, both wave counts would expect downwards movement: this alternate wave count to new lows for a second zigzag, which would be labelled intermediate wave (Y), and the main wave count for a brief shallow pullback labelled minute wave ii. How low the next wave goes should indicate which wave count is correct.
If a new high above 2,400.98 is seen, then this alternate would be discarded.
The correction for primary wave 4 should be a multi week pullback, and it may not move into primary wave 1 price territory below 2,111.05.
TECHNICAL ANALYSIS
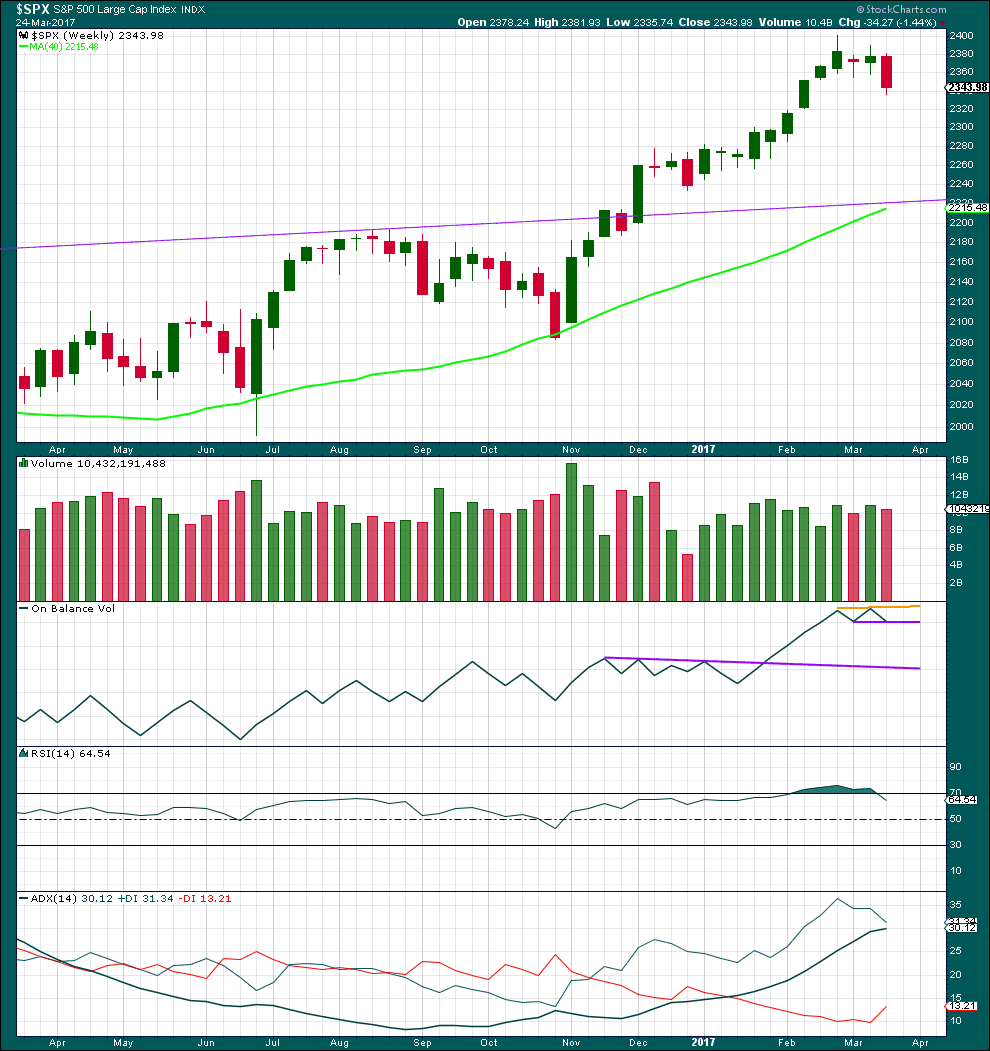
WEEKLY CHART
Click chart to enlarge. Chart courtesy of StockCharts.com.
The week before last completed a green weekly candlestick that moved price upwards on some increase in volume. Now last week completes a red weekly candlestick that moves price lower on a slight decline in volume. The volume profile short term looks bullish.
New trend lines are drawn across On Balance Volume, but these do not yet have any reasonable technical significance.
RSI is now back down from overbought.
ADX still indicates an upwards trend that is not yet extreme, but it is nearing extreme.
DAILY CHART
Click chart to enlarge. Chart courtesy of StockCharts.com.
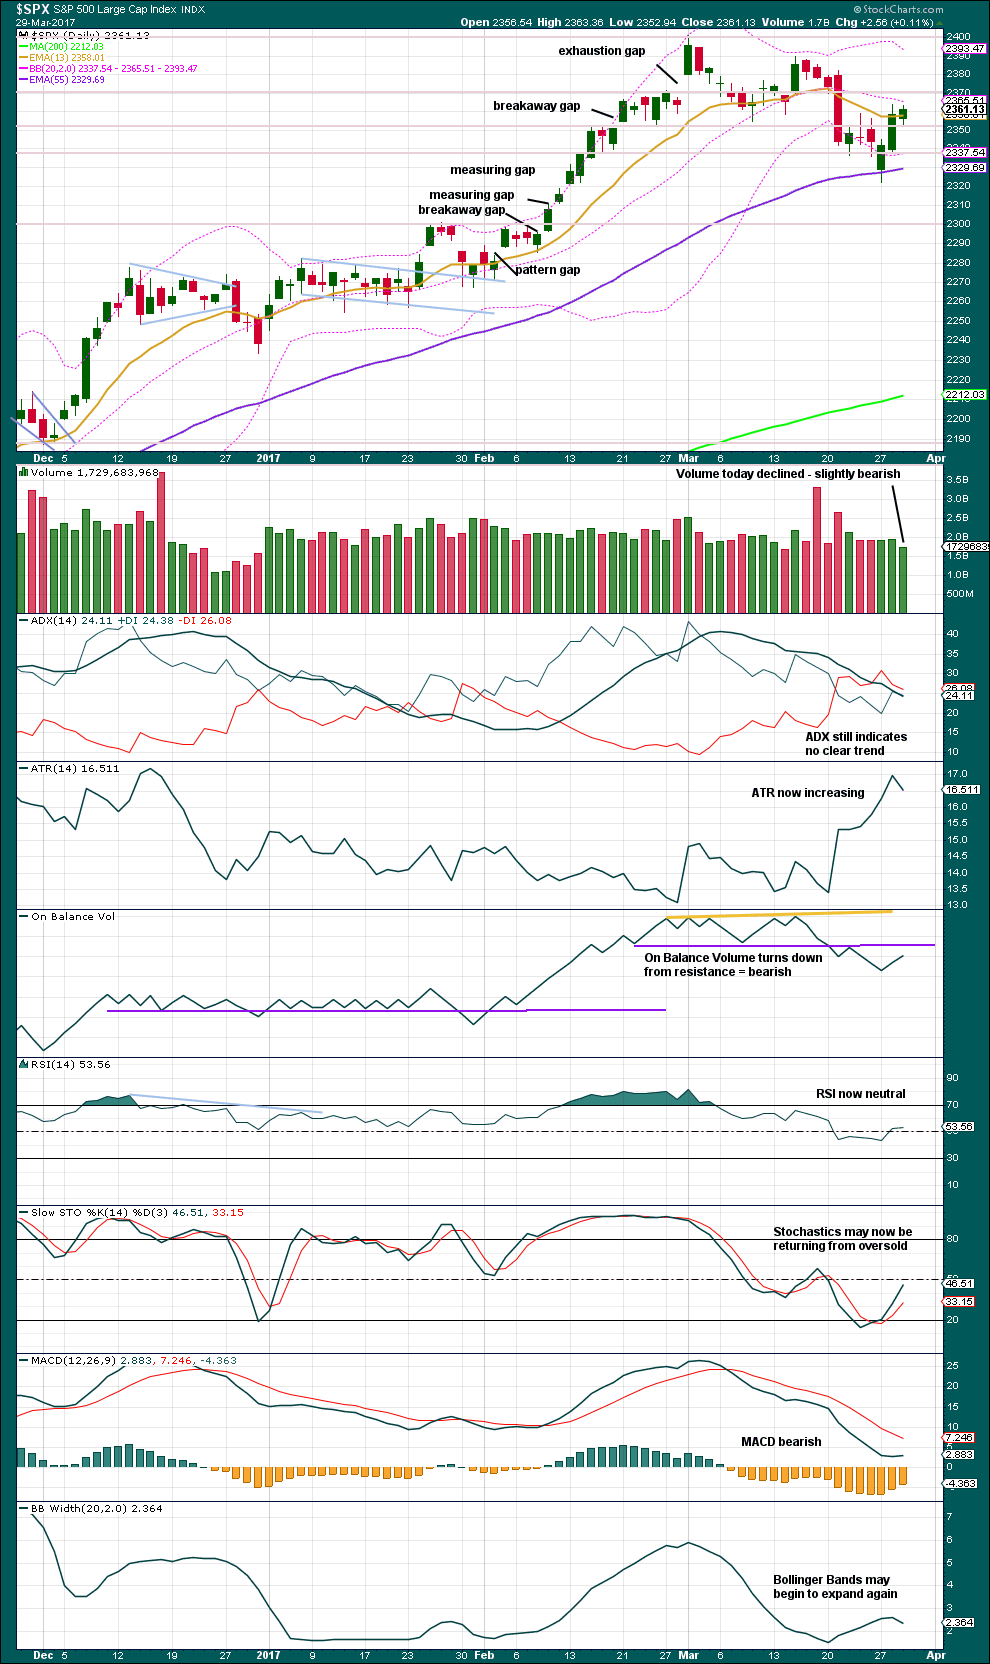
Yesterday completed a bullish engulfing candlestick pattern. This is a fairly reliable reversal pattern when coming after a downwards movement.
Volume for a small inside day today is lighter. This is only slightly bearish, but it may also be read as neutral because today was essentially a sideways day.
ADX is neutral. RSI is neutral.
Stochastics suggests a continuation of an upwards swing, so it may be interpreted today as bullish. ATR increasing as price moves higher is bullish.
MACD and On Balance Volume are still bearish. On Balance Volume is now closing back in on resistance at the purple line.
VOLATILITY – INVERTED VIX CHART
Click chart to enlarge. Chart courtesy of StockCharts.com.
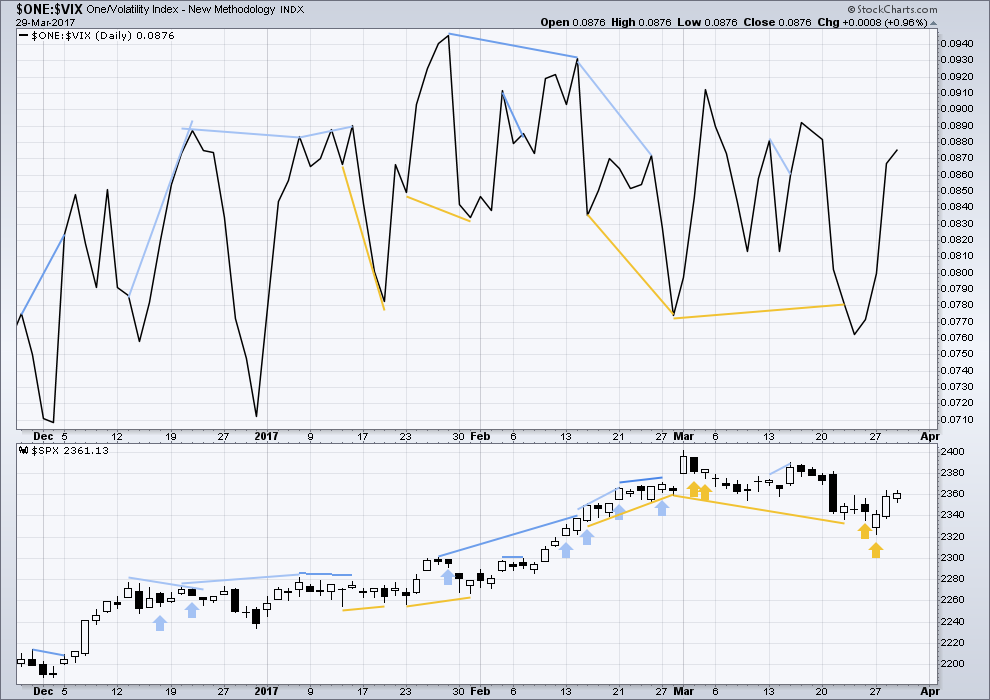
Normally, volatility should decline as price moves higher and increase as price moves lower. This means that normally inverted VIX should move in the same direction as price.
Bearish divergence and bullish divergence spanning a few short days used to be a fairly reliable indicator of the next one or two days direction for price; normally, bearish divergence would be followed by one or two days of downwards movement and vice versa for bullish divergence.
However, what once worked does not necessarily have to continue to work. Markets and market conditions change. We have to be flexible and change with them.
Recent unusual, and sometimes very strong, single day divergence between price and inverted VIX is noted with arrows on the price chart. Members can see that this is not proving useful in predicting the next direction for price.
Divergence will be continued to be noted, particularly when it is strong, but at this time it will be given little weight in this analysis. If it proves to again begin to work fairly consistently, then it will again be given weight.
Bullish divergence has now been followed by a strong upwards day. It is considered to have proven correct. It may now be resolved.
BREADTH – AD LINE
Click chart to enlarge. Chart courtesy of StockCharts.com.
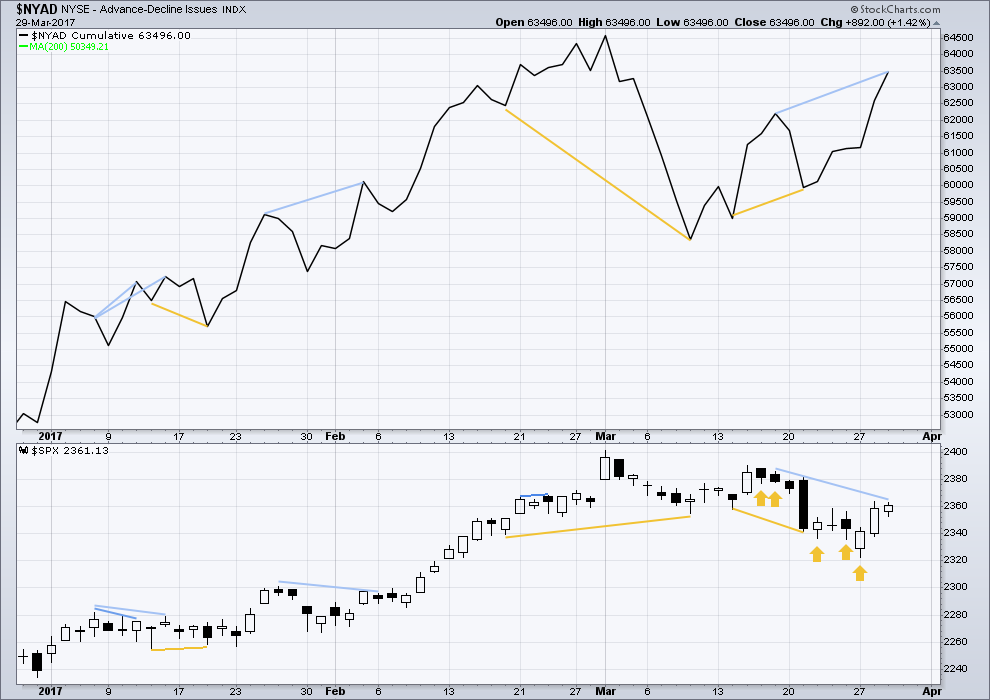
The rise in price has support from a rise in market breadth. Lowry’s OCO AD line also shows new highs along with price. Normally, before the end of a bull market the OCO AD line and the regular AD line should show divergence with price for about 4-6 months. With no divergence, this market has support from breadth.
There is short term bullish divergence between the AD line and price from yesterday’s low to the low of 14th of March (and also back to the 9th of March). Price has not come with a corresponding decline in market breadth while it has made a new low. There is weakness within this downwards movement from price. This supports the main hourly Elliott wave count which sees a low in place.
There is still short term bearish divergence today between today’s high and the high of the 17th of March. This indicates weakness in price and it may be followed by one or two downwards days. So far it has been followed by an upwards day and the divergence is now stronger.
Price moved overall sideways today, but during the session price closed above the open and the balance of volume was upwards. This was accompanied by a normal increase in market breadth; this session has support from market breadth. This may be read as bullish.
DOW THEORY
The DJIA, DJT, S&P500 and Nasdaq continue to make new all time highs. This confirms a bull market continues.
This analysis is published @ 11:49 p.m. EST.
Sometimes I need to laugh at myself. A few days ago I entered a 1/2 long position using TNA early in the trading day. Later in the day, I had a change in mind due to the downside risk. I liquidated my long positions. I thought. The market was down hard & I was glad I got out for the price of commissions. But then it was back up hard yesterday and today.
Well, it turns out I had some sort of brain lapse and did not enter the stop order the way I intended. And today I went online to make sure the trades were completed. I found out I am still long 1/2 position. Lucky me, the trade is up just over 5%. Since I tend to take large positions (against Lara’s advice and every other financial manager I know) it was a large position. I have a nice $ profit so far!
I will let it ride. I am planning on adding to it during the anticipated correction.
So, sometimes I have to laugh at myself.
Well, the diagonal scenario is proven wrong.
This too may be proven wrong. The bottom line is that while price remains within the new drawn best fit channel expect it should keep going up.
There will be a second wave correction that should print a red daily candlestick or doji. It may turn up tomorrow, or not. For now I am actually quite skeptical that minute i is over as I have labelled it here. This labelling is tentative, it may change after the end of this session.
If the channel is breached then minute ii may have begun. Look for the 0.382 Fibonacci ratio as the first target.
Hi Lara, is there any viable wave count that would view the Mar-1 high to the Mar-27 low as a corrective A wave, as part of a larger/longer correction, with the current up move from the Mar-27 low a B wave?
Thanks,
Rob
Only if the current upwards movement which would be wave B reaches 2,393.11, which is 0.9 X wave A.
Because the A wave is a three, so if the correction continues and is labelled A-B-C then it would be a flat. Or a triangle.
What you’re outlining is essentially a slightly different idea to my alternate. That sees the correction continuing.
But primary 4 is unlikely to be a flat, because that wouldn’t offer alternation with primary wave 2. A double zigzag though would offer perfect alternation.
Does that make sense?
Lara,
I would have a similar question. I am trying to judge if we have made our ATH for the year already and now we slowly grind lower for couple months (with up and down moves); until it accelerates at some point in the second half of the year. Would breaking 2327 and 2277 add confidence to that? Or do we have to wait till all the way down to 2111(missing a lot of downside move). I guess if we see a new ATH soon then we know that maybe some more juice left. But if not, then maybe we are setting up for something totally different.
On another note, Q1 comparisons from last year were easy. However as the year progresses, beating those numbers will be an uphill battle.
Thanks
It does, thank you. Also, I guess for this fourth wave to take on the pattern I described would probably make it too long in duration (potentially longer than wave 3 even). But what you described makes sense.
I feel like even without the alternation, wave 4 could still potentially be a flat, but this is based on my understanding that most flats occur in wave 4 and rarely wave 2, and zigzags mostly in wave 2 and rarely wave 4. Just thinking out loud.
Thanks for your comments! Your intraday updates are also greatly appreciated!
Margin debt in February soared to 528 billion, up from 513 billion in January, notching a new all time high since the Spring of 2015. Several analysts are saying “Not to worry; this time is different”.
The borrowing against portfolios is understandable when you take look at consumer confidence.
The contracting ED is an intriguing possibility. It implies a very deep re-trace for the second wave and could throw folk off about the possible trend change.
meep meep, thats a Kiwi call…
🙂 🙂 🙂
Pretty close actually Doc!
This is a recording of the male Northland Brown Kiwi, of which Tom is one.
I was there a few years back and saw the great white kiwi in mount Bruce, south of north Palmerston. The bird is pretty much defenseless, how can you not love them.
They have really strong legs and big claws, but yeah, their beaks look mean but they’re not a weapon. Because they’re flightless they have no breastbone, so a bite from even a small handbag dog can kill a Kiwi.
The No. 1 killer of Kiwi in Northland is dogs.
Their feathers are really soft and silky, they feel like cats. Their nostrils are at the end of their beaks and they can sense vibration and smell really well.
So Tom could feel us coming for ages. We woke him up, so he moved. We eventually found him but he’s a crafty bird, he’s learned a few good tricks. And man, that bracken is thick!
Even when they have RF transmitters it’s no easy task to track and catch a Kiwi.