
Monday was expected to be an upwards day, but this is not what happened.
Summary: The picture today looks more bearish. The alternate wave count has substantially increased in probability. A new high in the short term, above 2,354.54, would indicate the pullback is over and the next wave up should be underway. At that stage, the invalidation point may be moved up to the last low and the profit target would be 2,447.
While price remains now below 2,354.54, there is a reasonable probability this pullback may be deeper and continue for a few more weeks yet.
Today, there is now two sessions in a row of divergence between price and VIX and the AD line. This is bullish but has proven lately to be unreliable. It should be noted, but it may again prove unreliable.
New updates to this analysis are in bold.
Last monthly and weekly charts are here. Last historic analysis video is here.
MAIN ELLIOTT WAVE COUNT
WEEKLY CHART
Click chart to enlarge.
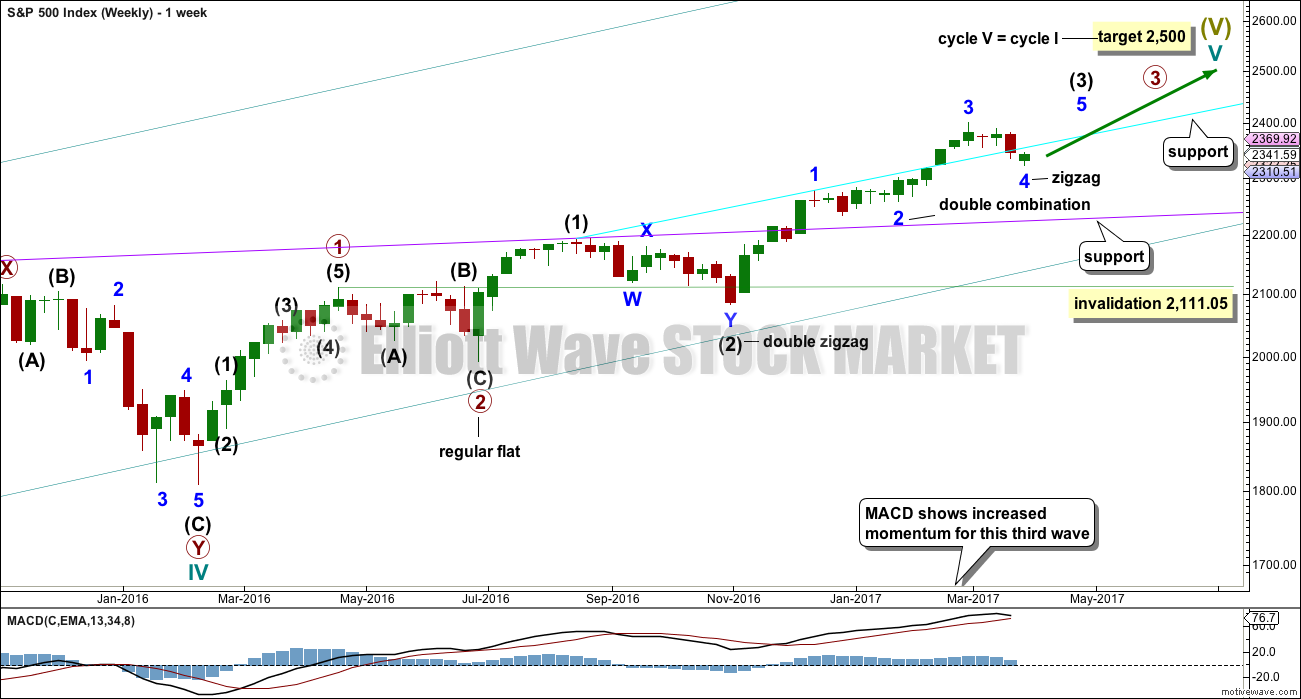
Cycle wave V is an incomplete structure. Within cycle wave V, primary wave 3 may be incomplete or it may be complete (alternate wave count below).
Primary wave 4 may not move into primary wave 1 price territory below 2,111.05.
As price moves lower look for support at each of the longer term trend lines drawn here across previous all time highs. The cyan trend line may provide support. (The trend line has been copied over to hourly charts.) The cyan line is drawn from the prior all time highs of 16th August, 2016, at 2,193.81, to 13th December, 2016, at 2,277.53. Weekly and daily charts are on a semi-log scale.
If price keeps falling here, then look for next support about the lilac line. The lilac line is drawn from the prior all time highs of 20th July, 2015, at 2,132.82, to 15th August, 2016, at 2,193.81.
DAILY CHART
Click chart to enlarge.
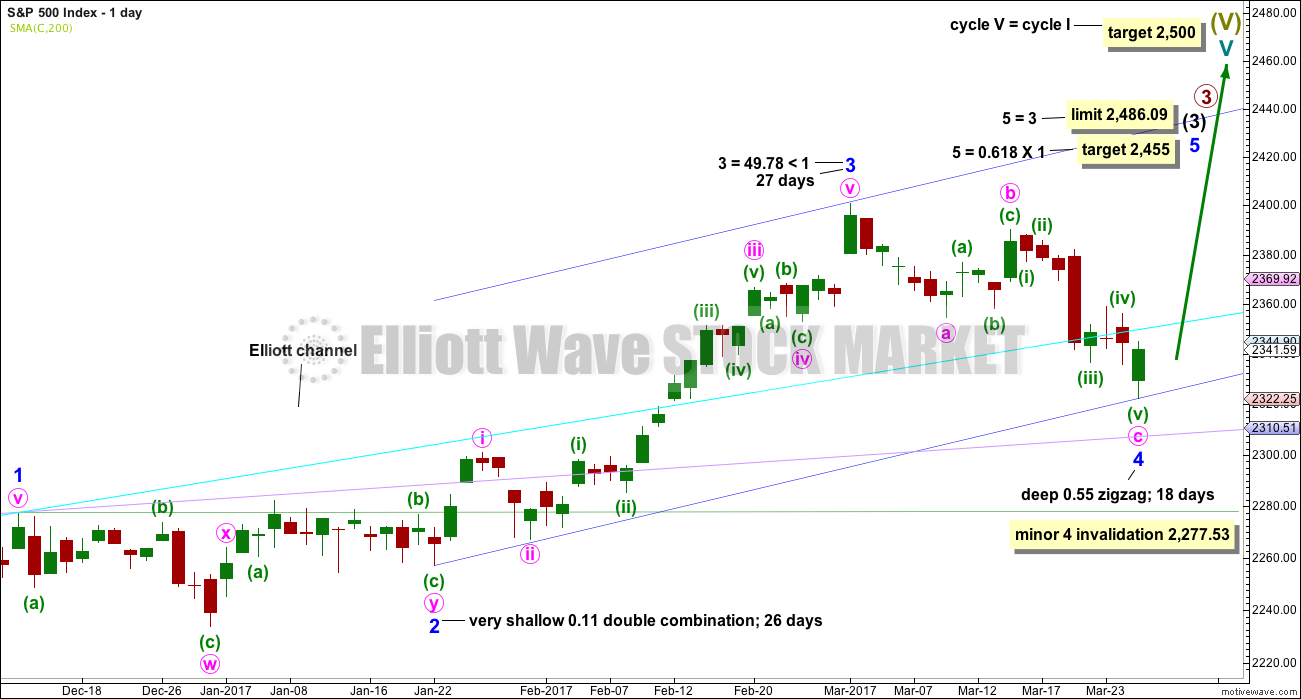
All subdivisions are seen in exactly the same way for both daily wave counts, only here the degree of labelling within intermediate wave (3) is moved down one degree.
This wave count expects the current correction is minor wave 4, which may not move into minor wave 1 price territory below 2,277.53. A new low below this point would confirm the correction could not be minor wave 4 and that would provide confidence it should be primary wave 4.
Minor wave 4 is a little below the fourth wave of one lesser degree. Because it has now clearly breached an Elliott channel drawn using the first technique, the channel is now redrawn using Elliott’s second technique. There is good alternation between the very shallow combination of minor wave 2 and the deeper zigzag of minor wave 4.
If minor wave 4 is over, then a target for minor wave 5 is calculated.
It is concerning that price has breached the cyan trend line with a full daily candlestick below and not touching the line. This would tend to support the alternate Elliott wave count now, which sees this correction as primary wave 4.
Minor wave 3 is shorter than minor wave 1. So that the core Elliott wave rule stating a third wave may not be the shortest is met, minor wave 5 is limited to no longer than equality in length with minor wave 3.
HOURLY CHART
Click chart to enlarge.
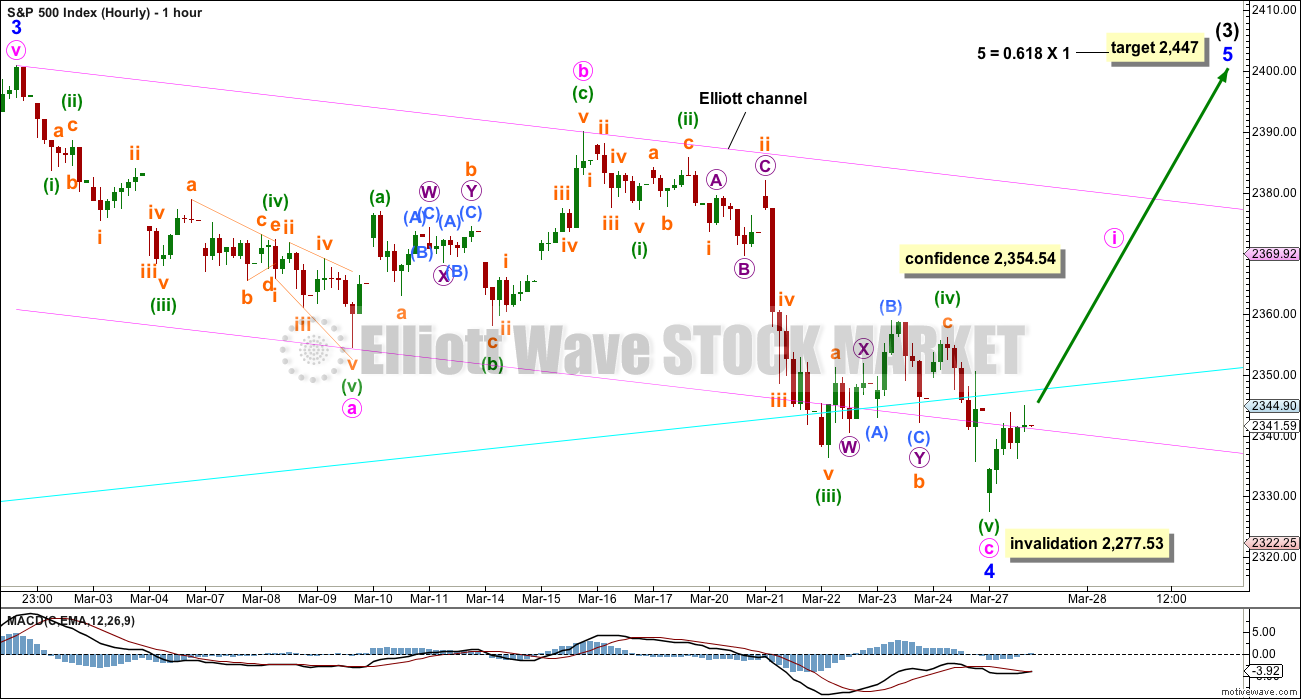
Minor wave 4 may still be seen as a complete structure, but with further downwards movement today this wave count has reduced in probability. It would be my judgement now that it may be about even in probability with the alternate.
Price has broken below the Elliott channel which contains minor wave 4. It looks like the end of this session saw a bounce to test resistance at the lower edge of the pink channel for a typical throwback, and this has a bearish look.
This wave count will remain viable as long as price remains above 2,277.53.
A new high above 2,354.54 now is required for confidence in a trend change at minor degree and confidence that the next wave up is underway. This would invalidate the alternate wave count below at the hourly chart level.
There is still no Fibonacci ratio between minute waves a and c.
ALTERNATE DAILY CHART
Click chart to enlarge.
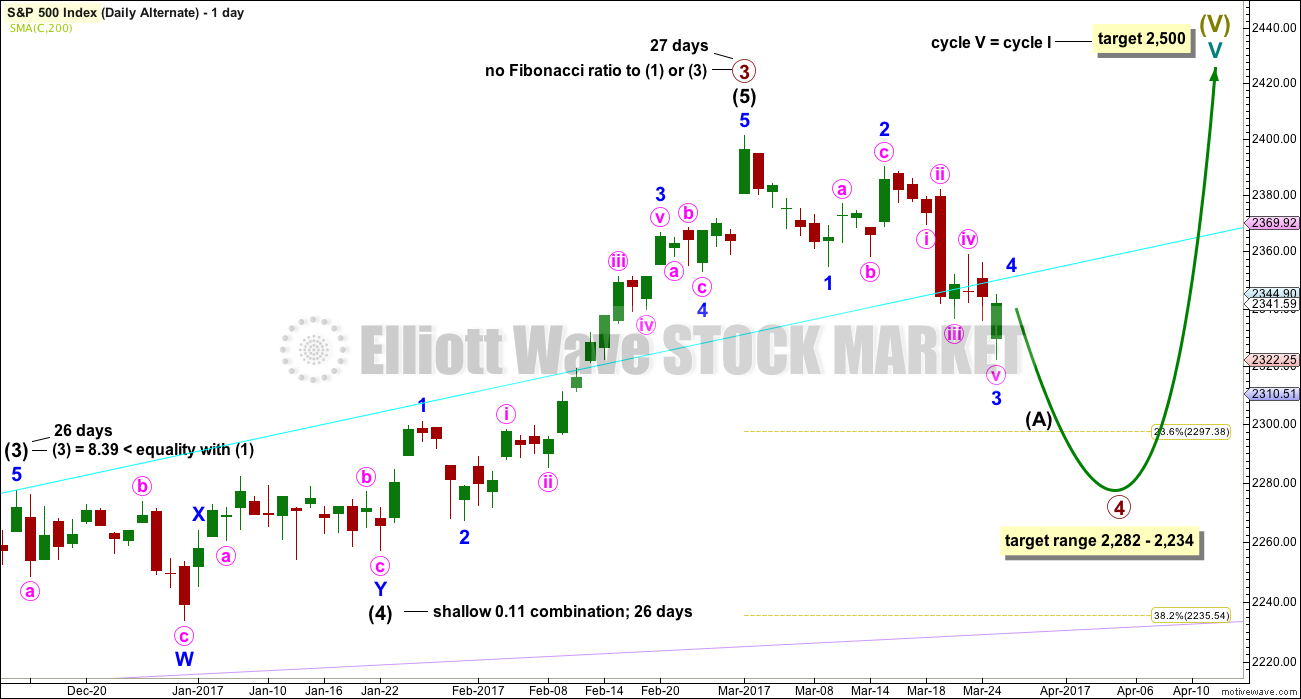
The subdivisions of upwards movement from the end of intermediate wave (2) are seen in the same way for both wave counts. The degree of labelling here is moved up one degree, so it is possible that primary wave 3 could be over.
Primary wave 2 was a flat correction lasting 47 days (not a Fibonacci number). Primary wave 4 may be expected to most likely be a zigzag, but it may also be a triangle if its structure exhibits alternation. If it is a zigzag, it may be more brief than primary wave 2, so a Fibonacci 21 sessions may be the initial expectation. If it is a triangle, then it may be a Fibonacci 34 or 55 sessions.
The correction for primary wave 4 should be a multi week pullback, and it may not move into primary wave 1 price territory below 2,111.05.
ALTERNATE HOURLY CHART
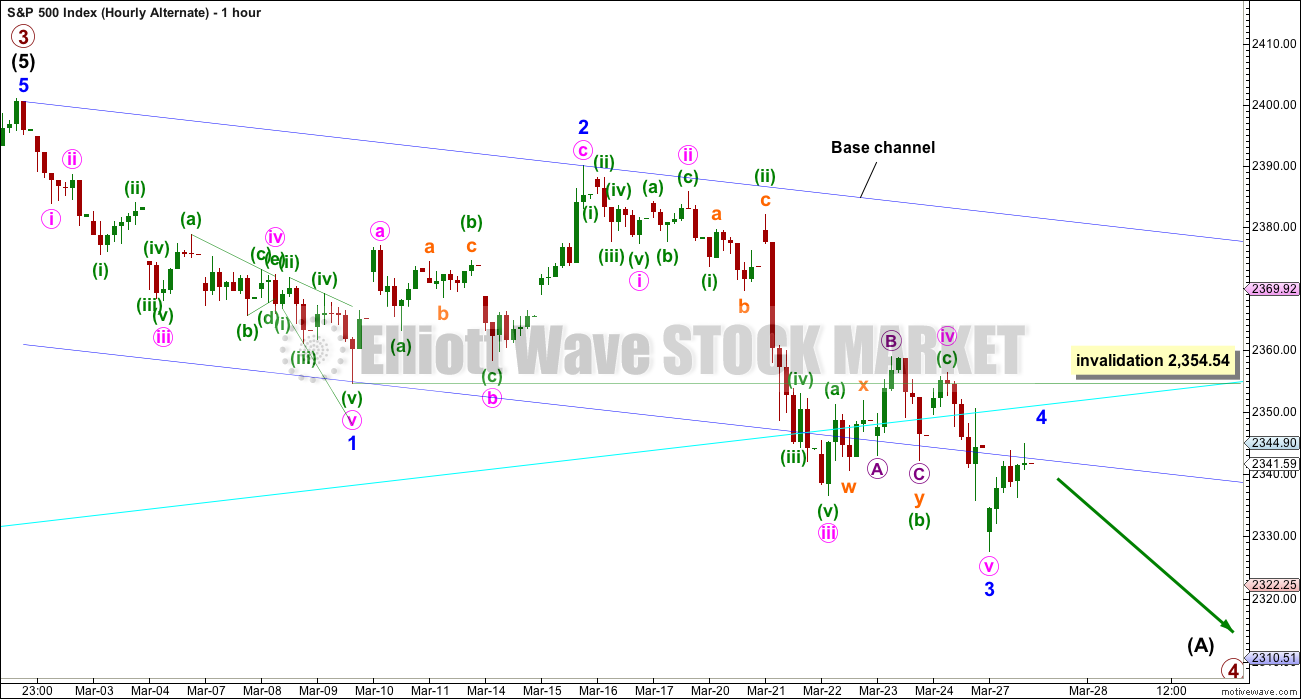
Click chart to enlarge.
A movement at primary degree should begin with a five down at the daily chart level, particularly if primary wave 4 unfolds as the most likely structure, a zigzag.
Minor wave 3 has now breached the base channel drawn about minor waves 1 and 2. This is used to confirm a third wave.
The structure of minor wave 3 may now be a complete impulse. It does not exhibit a Fibonacci ratio to minor wave 1, and it is shorter than 1.618 the length of minor wave 1.
The next correction for minor wave 4 may not move into minor wave 1 price territory above 2,354.54.
TECHNICAL ANALYSIS
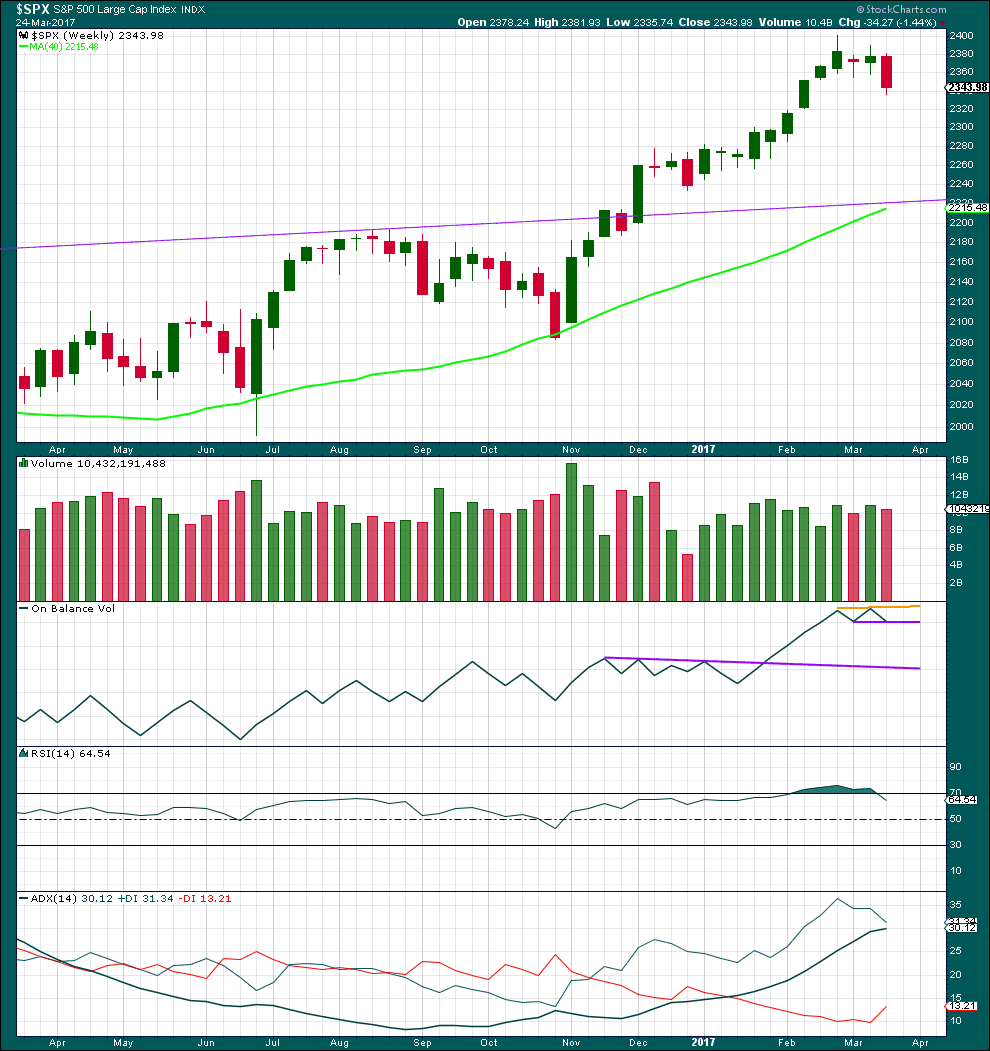
WEEKLY CHART
Click chart to enlarge. Chart courtesy of StockCharts.com.
The week before last completed a green weekly candlestick that moved price upwards on some increase in volume. Now last week completes a red weekly candlestick that moves price lower on a slight decline in volume. The volume profile short term looks bullish.
New trend lines are drawn across On Balance Volume, but these do not yet have any reasonable technical significance.
RSI is now back down from overbought.
ADX still indicates an upwards trend that is not yet extreme, but it is nearing extreme.
DAILY CHART
Click chart to enlarge. Chart courtesy of StockCharts.com.
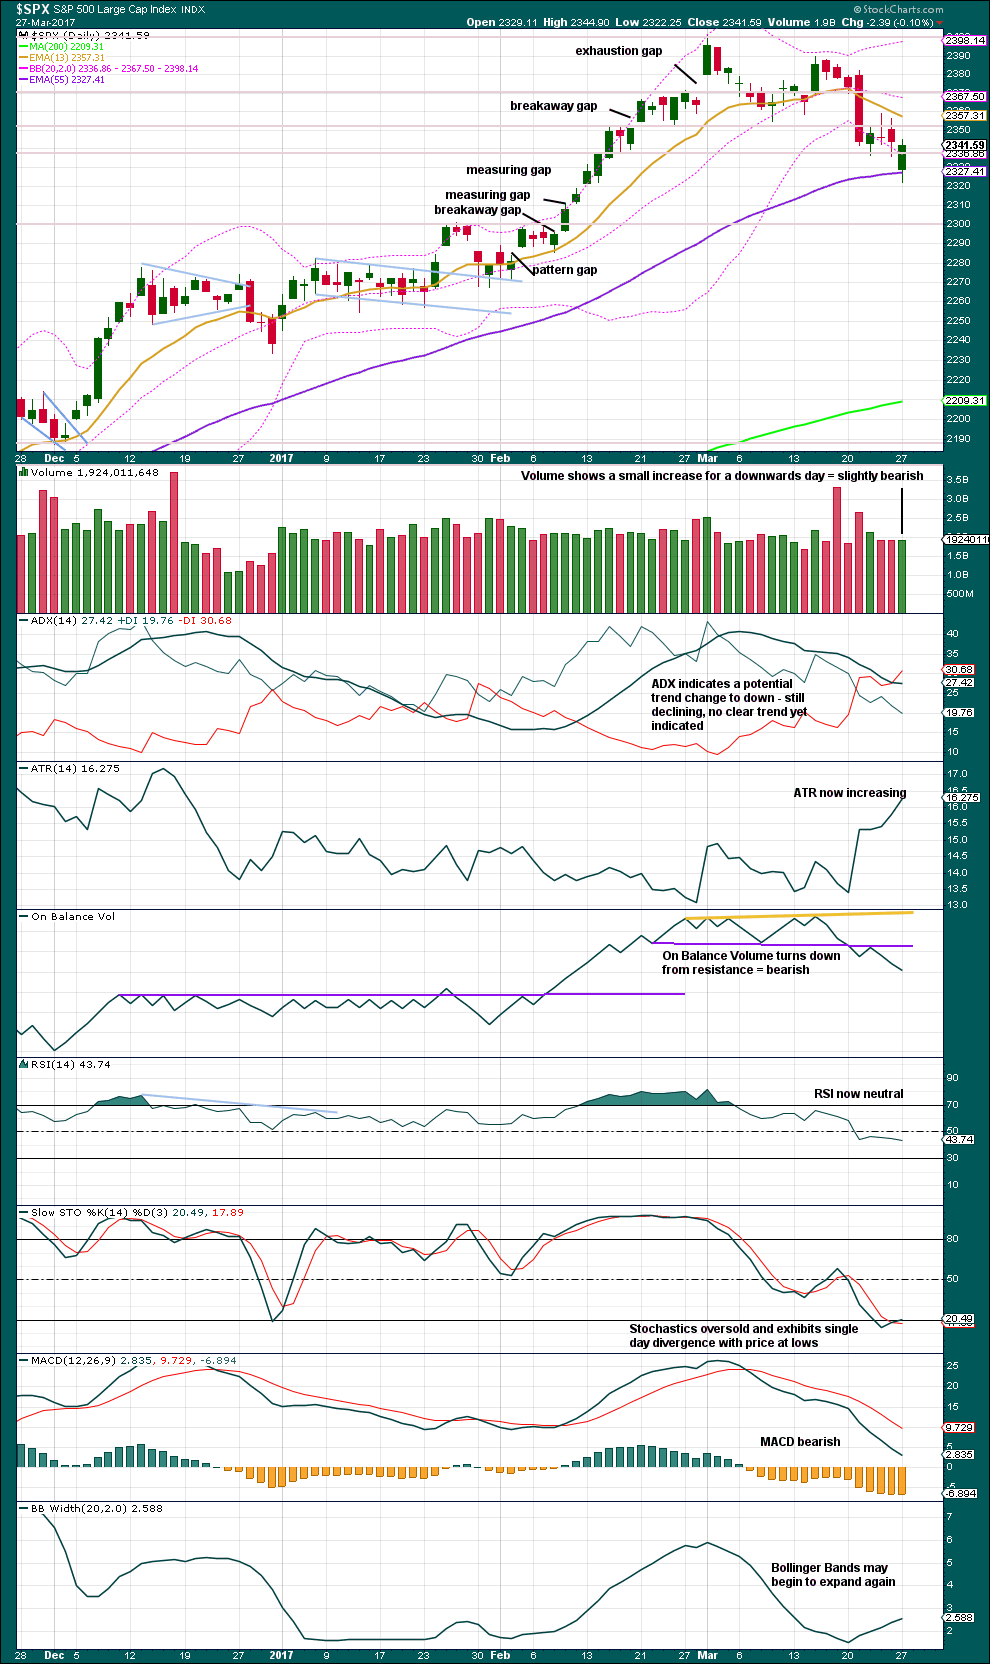
Warnings in last technical analysis section have proven to be timely. This chart is looking more bearish today.
It does now look like the small consolidation of three days last week was a small pause within a downwards trend that is now in place, at least short term.
Today’s session moves price lower, with a lower low and a lower high. The balance of volume during the session was down. Even though the candlestick closed green, this increase in volume supports downwards movement during the session.
ATR indicates a trend; with price moving lower, it would be downwards.
On Balance Volume is bearish, MACD is bearish, and Bollinger Bands are bearish.
The slightly longer lower wick on today’s candlestick is slightly bullish, as is the colour green.
Single divergence with Stochastics and price while Stochastics is oversold is bullish, but this can persist for long periods of time and could develop into multiple divergence before price turns.
VOLATILITY – INVERTED VIX CHART
Click chart to enlarge. Chart courtesy of StockCharts.com.
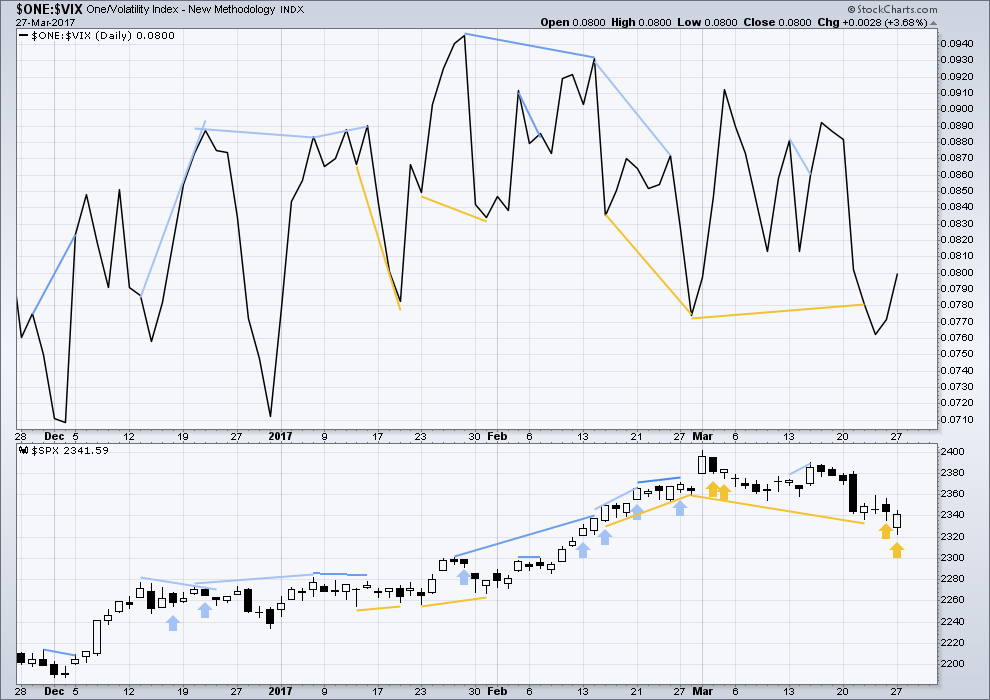
Normally, volatility should decline as price moves higher and increase as price moves lower. This means that normally inverted VIX should move in the same direction as price.
Bearish divergence and bullish divergence spanning a few short days used to be a fairly reliable indicator of the next one or two days direction for price; normally, bearish divergence would be followed by one or two days of downwards movement and vice versa for bullish divergence.
However, what once worked does not necessarily have to continue to work. Markets and market conditions change. We have to be flexible and change with them.
Recent unusual, and sometimes very strong, single day divergence between price and inverted VIX is noted with arrows on the price chart. Members can see that this is not proving useful in predicting the next direction for price.
Divergence will be continued to be noted, particularly when it is strong, but at this time it will be given little weight in this analysis. If it proves to again begin to work fairly consistently, then it will again be given weight.
There is now two days in a row of diverging price and inverted VIX. Price has moved lower for two days in a row, which would normally come with some increase in volatility but has come with a decline in volatility. This is not normal and should be interpreted as bullish. This divergence today is quite strong, but it will be given only a very little weight only because it is so strong and has now persisted for two days.
BREADTH – AD LINE
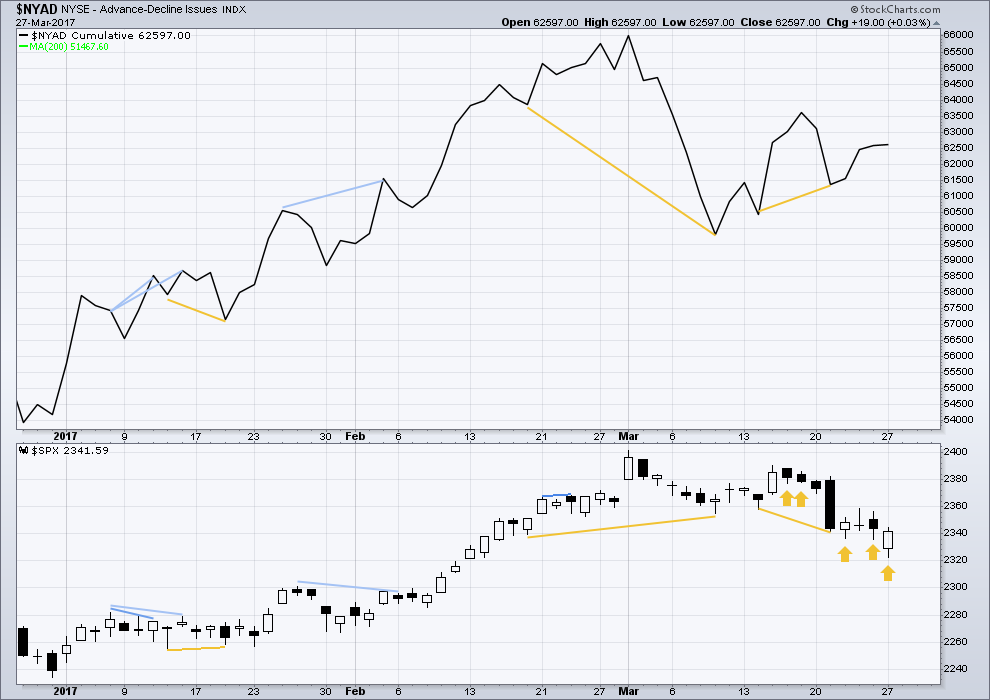
Click chart to enlarge. Chart courtesy of StockCharts.com.
The rise in price has support from a rise in market breadth. Lowry’s OCO AD line also shows new highs along with price. Normally, before the end of a bull market the OCO AD line and the regular AD line should show divergence with price for about 4-6 months. With no divergence, this market has support from breadth.
There is short term bullish divergence between the AD line and price from yesterday’s low to the low of 14th of March (and also back to the 9th of March). Price has not come with a corresponding decline in market breadth while it has made a new low. There is weakness within this downwards movement from price. This supports the main hourly Elliott wave count which sees a low in place.
There are now two days in a row of bullish divergence with price and the AD line. Market breadth has improved while price has moved lower and this indicates weakness in price and must be interpreted as bullish.
DOW THEORY
The DJIA, DJT, S&P500 and Nasdaq continue to make new all time highs. This confirms a bull market continues.
This analysis is published @ 08:05 p.m. EST.
Hourly chart updated:
The alternate hourly chart is invalidated. Only one now.
It is looking very much today like the correction was only minor wave 4 and is over now.
If today has strong volume that would support the idea.
Thanks for the update Lara, and I know you’ve answered me before, but how do you to into account the manipulation that occurred today exactly at 10:16am on all 4 majors indexes right as the market was trying to roll again with 10B worth MOC sell? Between yesterday and today the count of market orders (therefore not mutuals/hedge funds (who execute algos TWAP, VWAP etc when they have size) or Pensions) at least 4 times the size of the market makers/high frequency was the largest I’ve seen since monitoring the banksters. Do you believe they believe they can do this for infinity?
I don’t account for it. Their behaviour is part of wider social mood. I mean, even if I wanted to try and account for it, how exactly could I do that? Not take notice of volume? Or price extremes?
I just don’t think it’s possible to tease that out of the data. I have to take it all together.
No, I don’t think they can do this for infinity. Their day of reckoning will come. And what they’re doing now is going to make that day worse. Oh, so much worse.
And I’m planning on profiting from that. We all should.
Here’s the thing about market manipulation. It’s always been a thing for big players, those with deep pockets. But their decisions and trades are still part of wider social mood.
Understood, and thank you for the succinct response.
VIX getting smashed again today. My! Such bullish fervour! Reminds be of second wave ebullience….
Adding to 130 triple Q puts…
At the moment, I see three waves up off the low price yesterday. I am watching to see if five up develops followed by a three wave correction. Then I will possibly take long positions. Many of the three wave corrections in the last several months have been shallow and short in terms of time. That makes it a bit more difficult to catch the up trend.
I think Lara is right in that we are in a corrective move up. The wave one down low was about 2354.54 so this move cannot be a fourth wave. Boy what a sep-up if it does a better than 50% retrace…!!
We should also now be getting a precious metals move down- a good point for a short (but hopefully brief!) trade…
We are over 2354.5 so according to Lara’s charting we are on the next leg up
2357 is the magic number for moi…. 🙂
Green candle today or not, overnight long the market is RR.
Easy to figure out as these guys have been so much in the news of late… 😀
Good boy! 3/4 full barrel at .40 per contract cost basis…do I hear 0.30?!
Going once…! 🙂
Verne, I am buying May 19 UVXY calls — strike price 16. This way the first and the second phase of the French election vol can be captured.
Started position today and will continue buying some daily if I get better price. This week oil may help markets as it may try to test 50.
Should be an easy double at entry price of around 2.30 per…don’t forget it tends to have that monstrous intra-day run-up at the end, typically 25% or more so if you cannot monitor the trade you may want to enter a GTC sell order….. 🙂
good plan
Please go a little higher so I can steal a few more vol calls…..Puhhleeese!!! 🙂
Adding more 17.50 UVXY calls….1/2 barrel to go…
Buying to open this week’s 17.50 strike UVXY calls for 0.45 per contract….is this legal?! 🙂
Continuing to scalp short term predictable swings in UVXY. Selling 17.00 strike puts for 1.00, bought for 0.50. Open order to re-buy at 0.50 or better. Easy peasy…. 😉
What I am seeing on he charts gives me pause / caution towards any long positions. As I noted yesterday, the SPX weekly MACD is about to make a bearish cross over. On the daily SPX chart, the 13 day ema is about to make a bearish cross over of the 34 day ema. This last happened in September 2016 leading to a 2 month decline.
The trendline forming the top channel line which goes back to April 2016 (touching highs in August & December) has just been penetrated to the downside. See the chart below. (Disregard the Elliott Wave marking as this is my own musings etc.)
All is all, I am waiting for the correction to continue.
Yep. Mr Market still has an awful lot of work to do…too many bullish riders keep BTFD… 😀
I wouldn’t be reading much into signals that haven’t yet happened. There’s still a bit of downside to go before the weekly MACD gives a bearish cross, and those 2 ema’s cross on the daily
The very best short prospect in the market at the moment is technology. What is interesting is that in the past they have led the way down when the market was undergoing a minor correction. On the other hand, at the onset of the last bear market they were the last to throw in the towel. I am looking in utter amazement at that monster bearish engulfing candle printed last Tuesday and the fact that we are barely off the highs. Hope springs eternal it would appear. Northman Trader recently pointed out in a video how many of these companies were trading light years away from their daily 5 day EMA and the deviation was absolutely historic for a number of them. As much as it sometimes seems the old RTM trade is dead, folk loaded to the gills with those stocks are about to find out that may not necessarily be so! Holding QID 19.00 strike calls and Triple Q 130 strike puts.
Agree, but need patience in this trade.
Absolutely. I expect to lower my cost average during what will likely be at least a 0.68 retracement b wave up. A few savvy traders I know have been short ES since mid Feb with a target of 2220 and stop at 2410. 1/4 full load…
hello,,its me
Hi Doc 🙂 And I was just saying to myself, hello, who’s first today?