
A little downwards movement to below 2,340.51 but not below 2,336.45 was expected during Friday’s session.
Price did move lower, but it made a slight new low below 2,336.45, which was not expected.
Summary: Volatility declined and market breadth improved while price moved lower for Friday. Taken together this is reasonably bullish. It does look very likely that Monday should be an upwards day. The confidence point is still at 2,377.18. The target for the next wave up is at 2,455 and the limit is now at 2,486.09.
New updates to this analysis are in bold.
Last monthly and weekly charts are here. Last historic analysis video is here.
MAIN ELLIOTT WAVE COUNT
WEEKLY CHART
Click chart to enlarge.
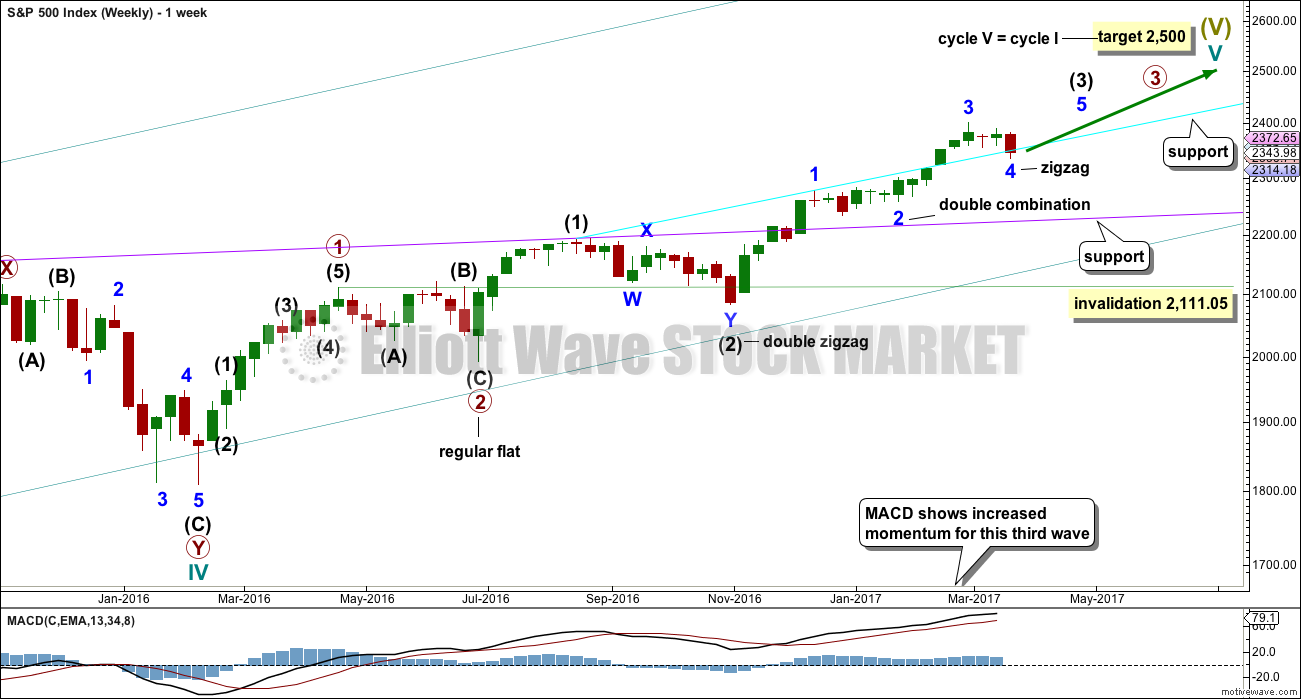
Cycle wave V is an incomplete structure. Within cycle wave V, primary wave 3 may be incomplete or it may be complete (alternate wave count below).
Primary wave 4 may not move into primary wave 1 price territory below 2,111.05.
As price moves lower look for support at each of the longer term trend lines drawn here across previous all time highs. The cyan trend line may provide support. (The trend line has been copied over to hourly charts.) The cyan line is drawn from the prior all time highs of 16th August, 2016, at 2,193.81, to 13th December, 2016, at 2,277.53. Weekly and daily charts are on a semi-log scale.
If price keeps falling here, then look for next support about the lilac line. The lilac line is drawn from the prior all time highs of 20th July, 2015, at 2,132.82, to 15th August, 2016, at 2,193.81.
DAILY CHART
Click chart to enlarge.
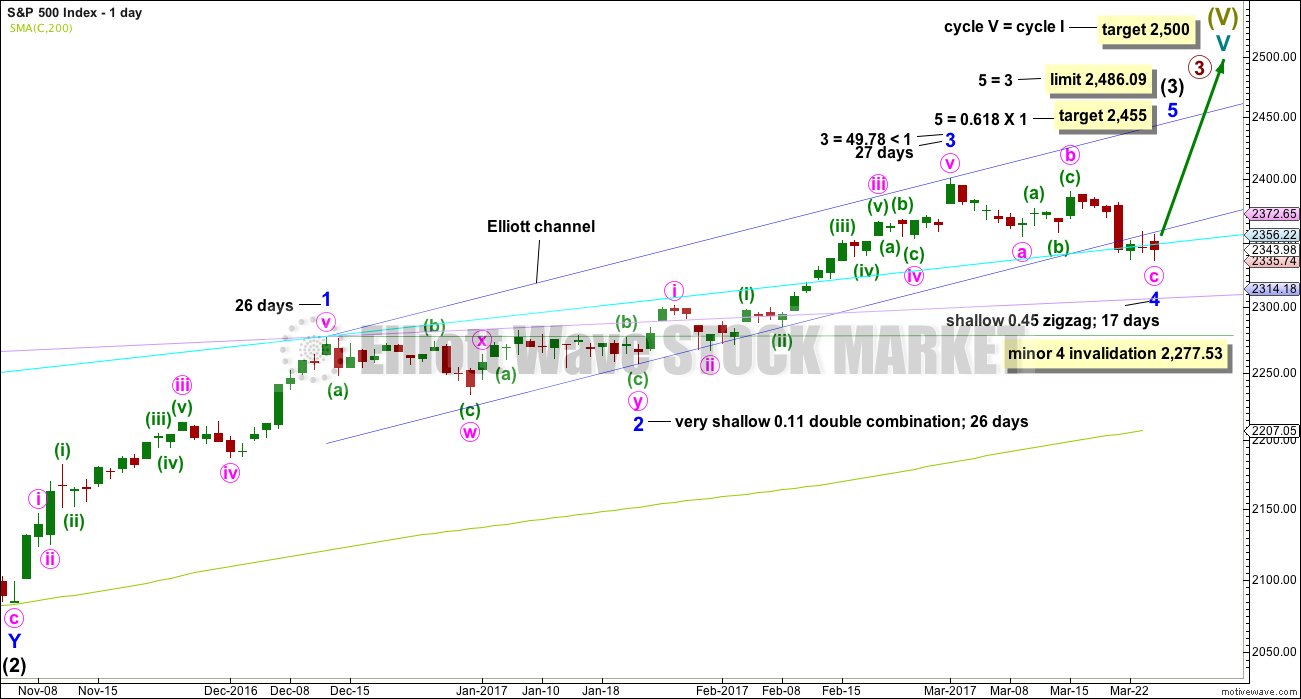
All subdivisions are seen in exactly the same way for both daily wave counts, only here the degree of labelling within intermediate wave (3) is moved down one degree.
This wave count expects the current correction is minor wave 4, which may not move into minor wave 1 price territory below 2,277.53. A new low below this point would confirm the correction could not be minor wave 4 and that would provide confidence it should be primary wave 4.
Minor wave 4 is a little below the fourth wave of one lesser degree and may have ended with a small overshoot of the blue Elliott channel and finding support about the cyan trend line. There is good alternation between the very shallow combination of minor wave 2 and the deeper zigzag of minor wave 4.
If minor wave 4 is over, then a target for minor wave 5 is calculated.
It is concerning at the end of this week that price has breached the lower edge of the Elliott channel and turned up for a test of resistance at the lower edge. This looks like a classic breach and throwback, and it has a bearish look. For this reason members are advised that we do not have confidence yet that minor wave 4 is over, and the alternate wave count may yet turn out to be correct.
Minor wave 3 is shorter than minor wave 1. So that the core Elliott wave rule stating a third wave may not be the shortest is met, minor wave 5 is limited to no longer than equality in length with minor wave 3.
HOURLY CHART
Click chart to enlarge.
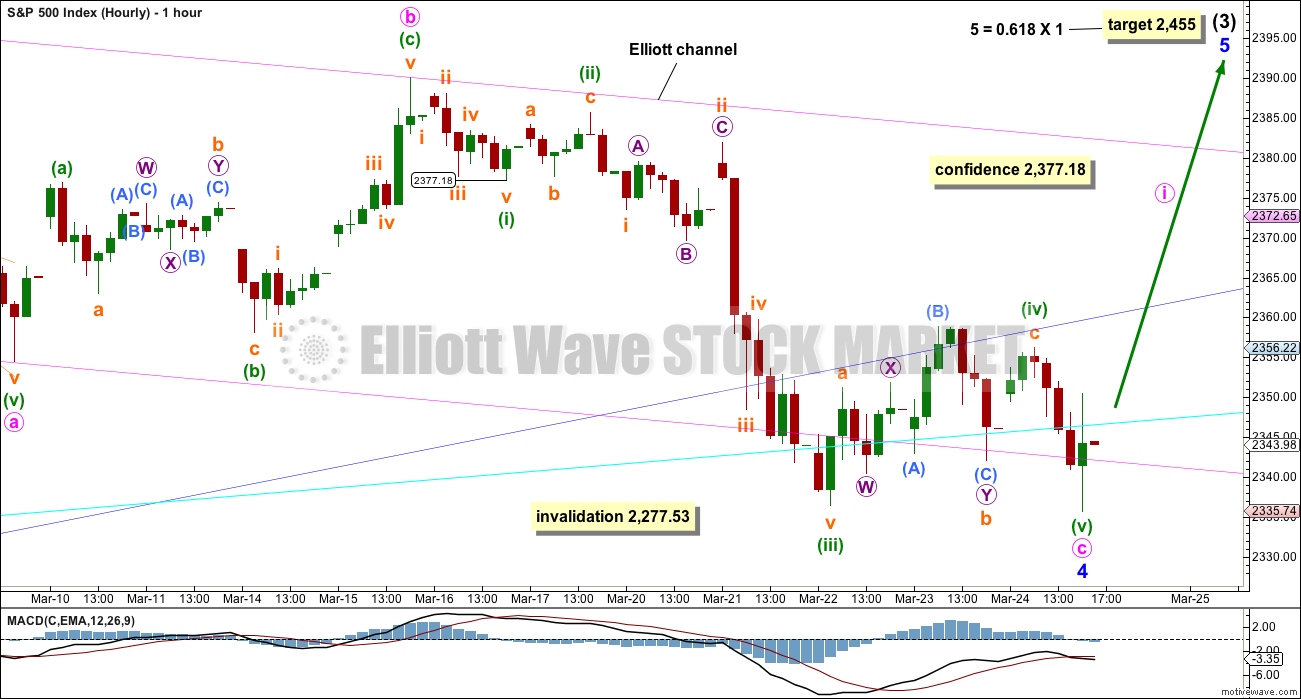
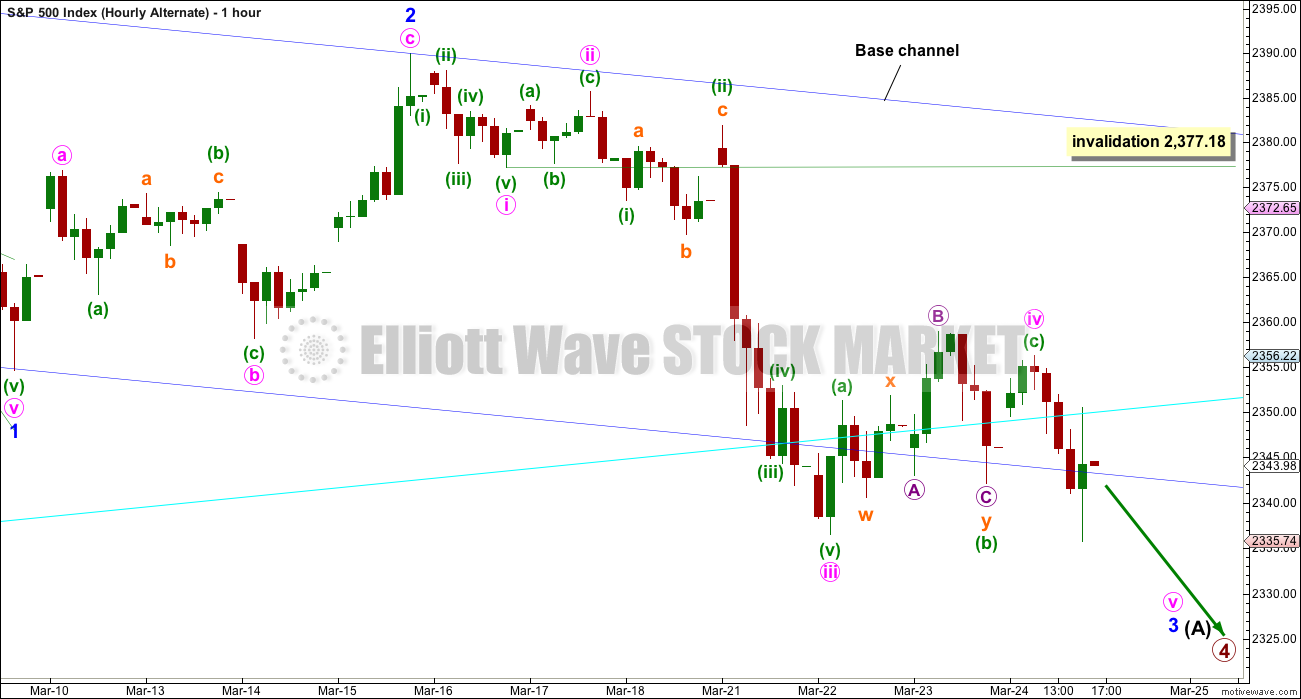
Minor wave 4 may now be seen as a complete structure. The impulse of minute wave c may be complete.
Within minute wave c, if the correction for minuette wave (iv) continues further, then it may not move into minuette wave (i) price territory above 2,377.18. A new high above this point would indicate the structure of minute wave c should be over, and so minor wave 4 in its entirety would be very likely then to be over.
Minor wave 4 may have moved lower during Friday’s session. Minute wave c does now have a better look as a five wave structure. Within minute wave c, the correction of minuette wave (ii) is a flat and minuette wave (iv) is a zigzag. There is still no Fibonacci ratio between minute waves a and c.
Minor wave 4 has breached the blue Elliott channel copied over from the daily chart. Sometimes fourth waves are not contained neatly within these channels, which is why Elliott developed a second technique to redraw the channel when the fourth wave breaches it. If price begins to move up strongly next week, and moves above the confidence point, then the channel shall be redrawn.
While price has not moved above 2,377.18, we may not have any confidence that minor wave 4 is over. The invalidation point must remain at 2,277.53.
ALTERNATE DAILY CHART
Click chart to enlarge.
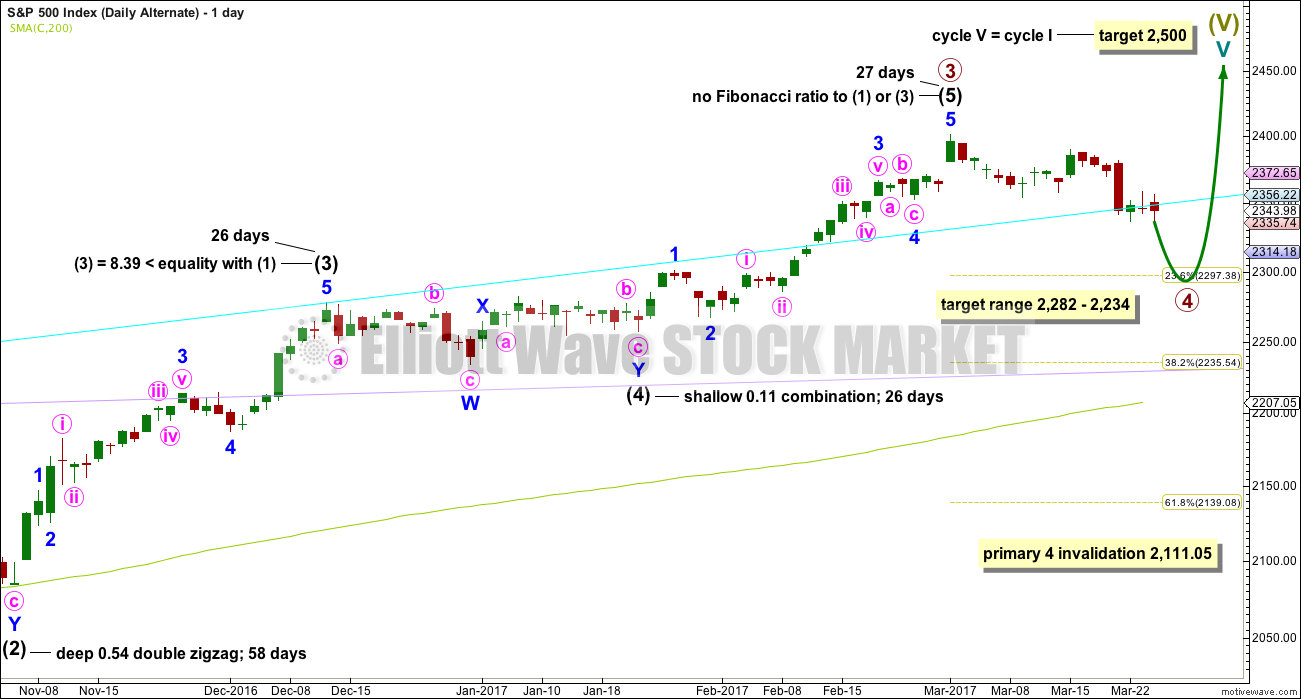
The subdivisions of upwards movement from the end of intermediate wave (2) are seen in the same way for both wave counts. The degree of labelling here is moved up one degree, so it is possible that primary wave 3 could be over.
Primary wave 2 was a flat correction lasting 47 days (not a Fibonacci number). Primary wave 4 may be expected to most likely be a zigzag, but it may also be a triangle if its structure exhibits alternation. If it is a zigzag, it may be more brief than primary wave 2, so a Fibonacci 21 sessions may be the initial expectation. If it is a triangle, then it may be a Fibonacci 34 or 55 sessions.
Intermediate wave (3) is shorter than intermediate wave (1). One of the core Elliott wave rules states a third wave may never be the shortest wave, so this limits intermediate wave (5) to no longer than equality in length with intermediate wave (3). If intermediate wave (5) is now over, then this rule is met.
Minor wave 3 has no Fibonacci ratio to minor wave 1. If minor wave 5 is now over, then it is 4.14 points longer than equality in length with minor wave 3.
Intermediate wave (5) may have ended in 27 days, just one longer than intermediate waves (3) and (4). This gives the wave count good proportions.
The proportion here between intermediate waves (2) and (4) is acceptable. There is alternation. Both are labelled W-X-Y, but double zigzags are quite different structures to double combinations.
The following correction for primary wave 4 should be a multi week pullback, and it may not move into primary wave 1 price territory below 2,111.05.
ALTERNATE HOURLY CHART
Click chart to enlarge.
In the short to mid term, the wave counts now diverge, so it is time to publish an hourly chart for this alternate.
Primary wave 2 was a flat correction, so it is most likely that primary wave 4 would unfold as a zigzag. So far, within the zigzag, intermediate wave (A) may be an incomplete impulse.
So far minor waves 1 and 2 may be complete within intermediate wave (A). Minor wave 3 must be incomplete. When it is complete, then the invalidation point for this alternate will move down to the end of minor wave 1 at 2,354.54.
Within minor wave 3, the correction for minute wave iv may not move into minute wave i price territory above 2,377.18.
The blue base channel on this alternate is the same as the pink Elliott channel on the main hourly chart. For this alternate, minor wave 3 should have the power to break below the lower edge of the base channel, but it has not done that and seems to be finding strong support about this area. This reduces the probability of this wave count.
TECHNICAL ANALYSIS
WEEKLY CHART
Click chart to enlarge. Chart courtesy of StockCharts.com.
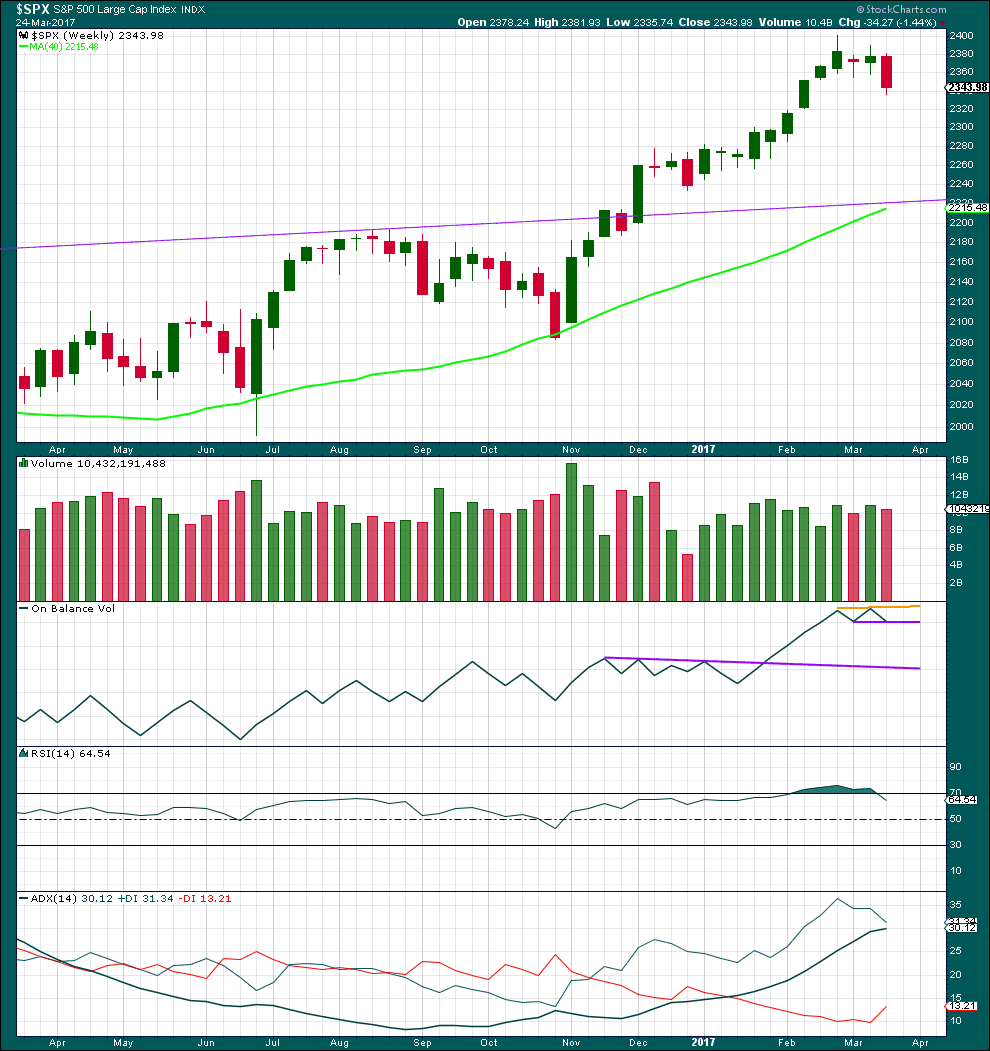
Last week completed a green weekly candlestick that moved price upwards on some increase in volume. Now this week completes a red weekly candlestick that moves price lower on a slight decline in volume. The volume profile short term looks bullish.
New trend lines are drawn across On Balance Volume, but these do not yet have any reasonable technical significance.
RSI is now back down from overbought.
ADX still indicates an upwards trend that is not yet extreme, but it is nearing extreme.
DAILY CHART
Click chart to enlarge. Chart courtesy of StockCharts.com.
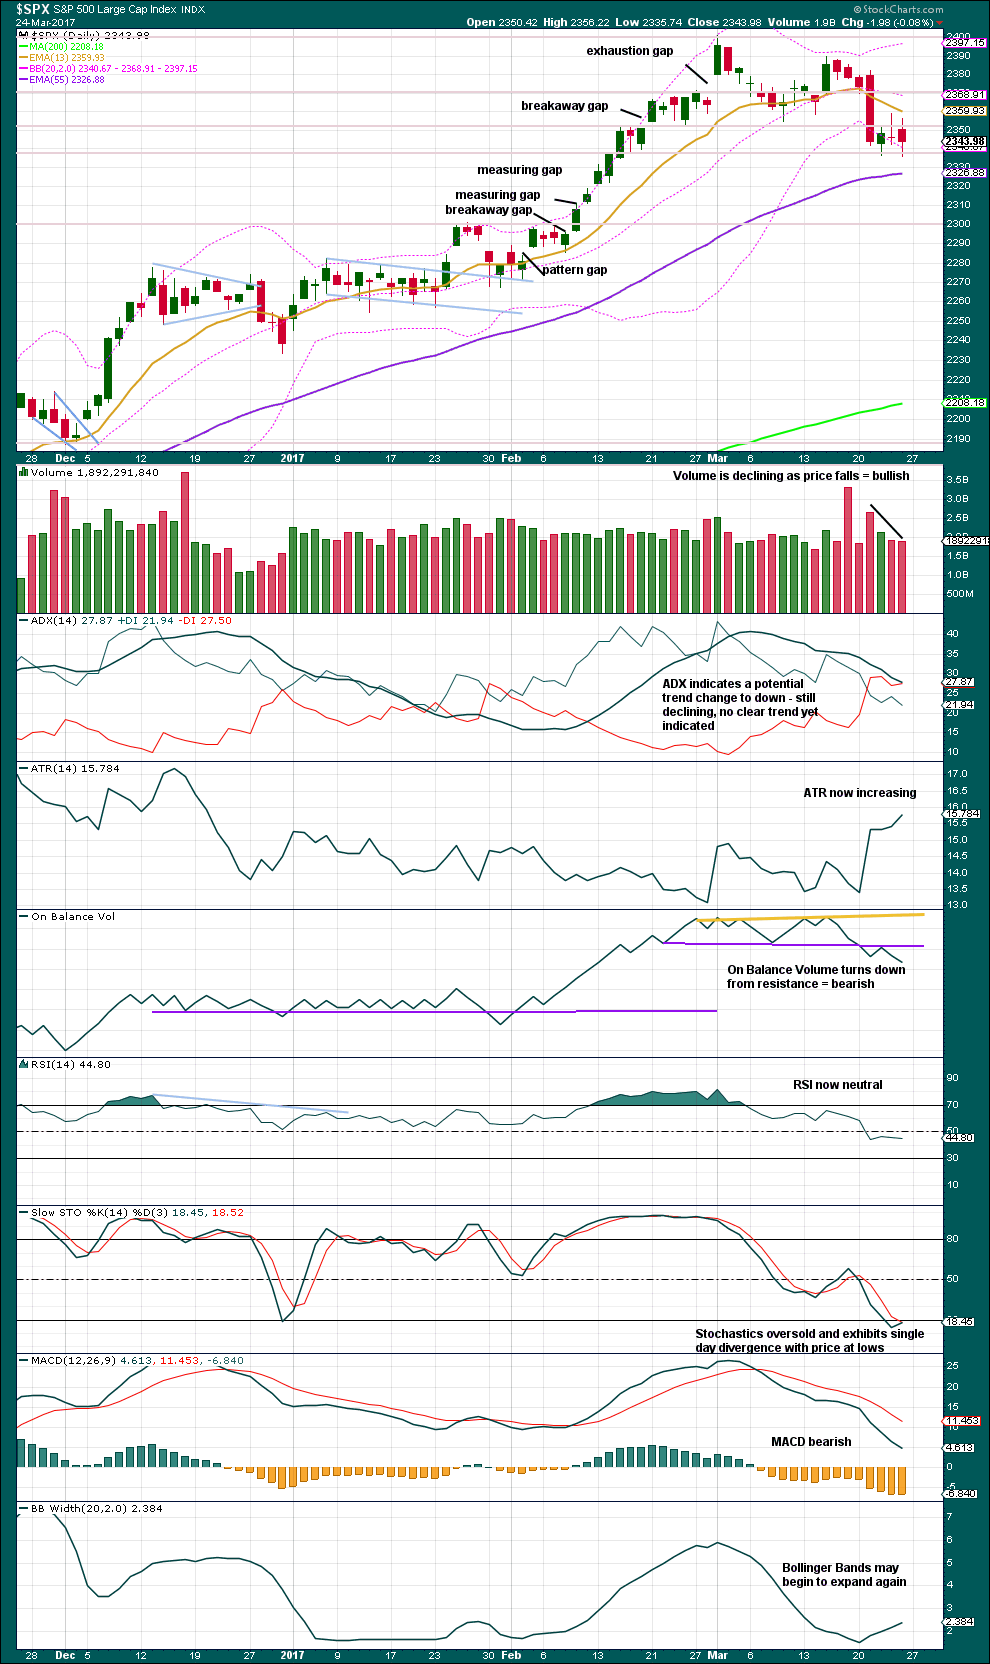
The last three days of sideways movement look corrective, so this may be a small consolidation within a short term downwards trend. There is reasonable risk at this stage to any long positions here.
Volume has fallen for Friday’s downwards day, but this does still support the main Elliott wave count over the alternate.
On Balance Volume is still bearish. This is concerning for the main Elliott wave count.
Overall, the larger trend remains up. Corrections should still be used as an opportunity to join the trend. However, the risk is entering a correction too soon before it is over. Either exert a strong degree of patience and wait for confidence points to be passed, or accept the risk of an underwater position for a few days if entering long here.
VOLATILITY – INVERTED VIX CHART
Click chart to enlarge. Chart courtesy of StockCharts.com.
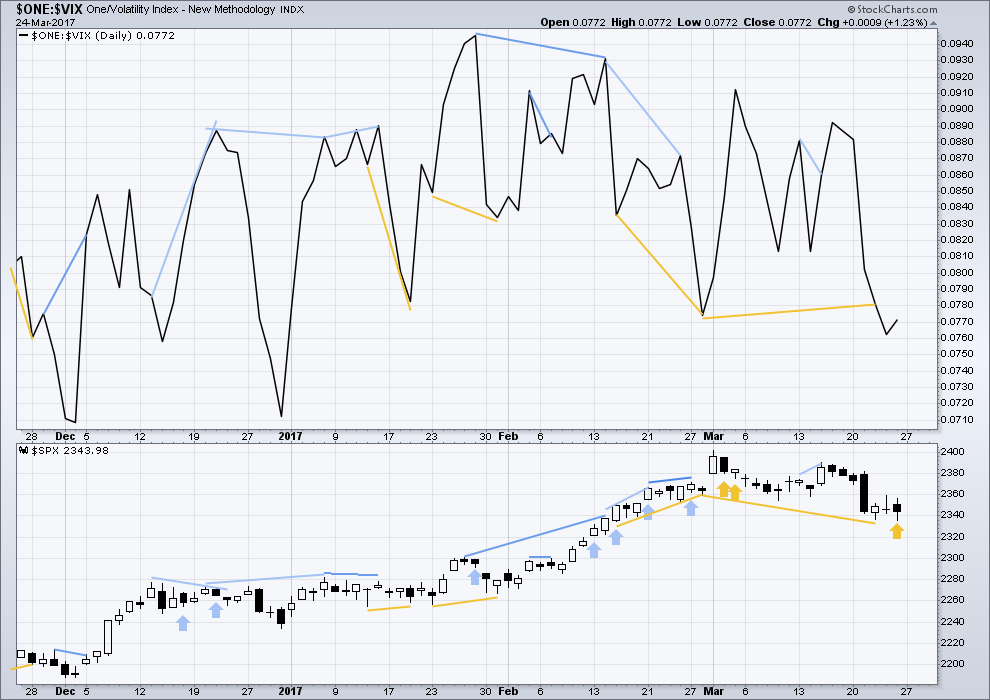
Normally, volatility should decline as price moves higher and increase as price moves lower. This means that normally inverted VIX should move in the same direction as price.
Bearish divergence and bullish divergence spanning a few short days used to be a fairly reliable indicator of the next one or two days direction for price; normally, bearish divergence would be followed by one or two days of downwards movement and vice versa for bullish divergence.
However, what once worked does not necessarily have to continue to work. Markets and market conditions change. We have to be flexible and change with them.
Recent unusual, and sometimes very strong, single day divergence between price and inverted VIX is noted with arrows on the price chart. Members can see that this is not proving useful in predicting the next direction for price.
Divergence will be continued to be noted, particularly when it is strong, but at this time it will be given little weight in this analysis. If it proves to again begin to work fairly consistently, then it will again be given weight.
Inverted VIX diverges with price for Friday’s session. Price moved lower to a new low and normally this should come with an increase in volatility. However, volatility declined as inverted VIX moved higher. This divergence is bullish, but it will be given very little weight in this analysis today.
BREADTH – AD LINE
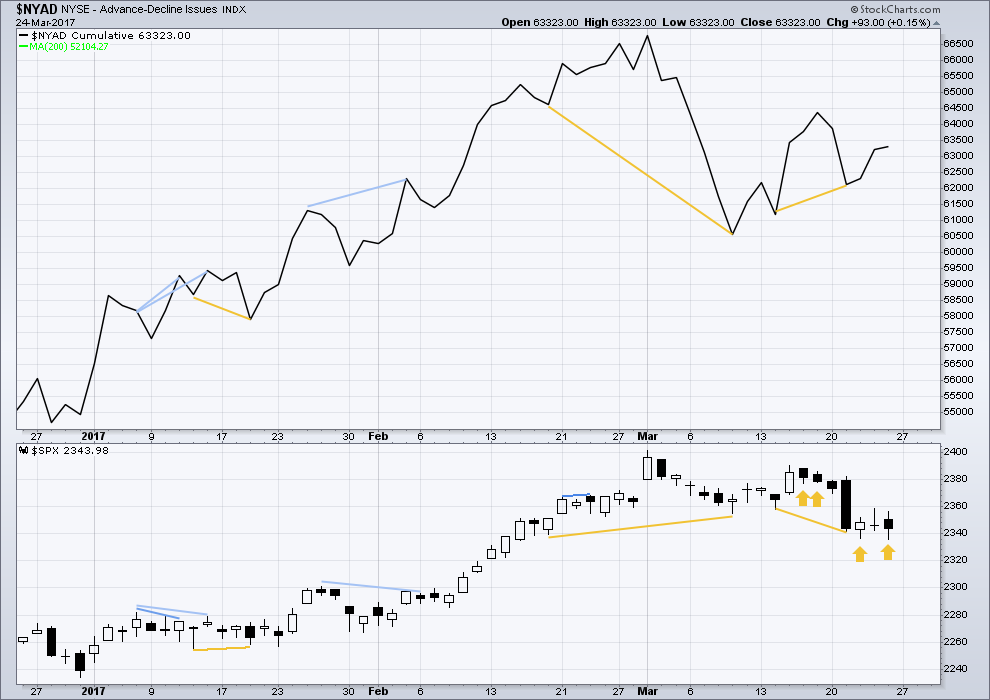
Click chart to enlarge. Chart courtesy of StockCharts.com.
The rise in price has support from a rise in market breadth. Lowry’s OCO AD line also shows new highs along with price. Normally, before the end of a bull market the OCO AD line and the regular AD line should show divergence with price for about 4-6 months. With no divergence, this market has support from breadth.
There is short term bullish divergence between the AD line and price from yesterday’s low to the low of 14th of March (and also back to the 9th of March). Price has not come with a corresponding decline in market breadth while it has made a new low. There is weakness within this downwards movement from price. This supports the main hourly Elliott wave count which sees a low in place.
There is again single day bullish divergence between price and the AD line for Friday’s session: the AD line moved higher while price moved lower to make a new low. There was weakness during the session within price and market breadth improved even as price moved lower. This divergence is bullish and supports the main Elliott wave count.
DOW THEORY
The DJIA, DJT, S&P500 and Nasdaq continue to make new all time highs. This confirms a bull market continues.
This analysis is published @ 09:09 p.m. EST.
Scalped a few of the UVXY moves down for a couple quick 50% on 18 strike puts that moved between 1.00 and 1.50 a few times today. Still holding market straddle until situation clarifies.
Volatility seems to be putting up quite the fight! 🙂
Nice Verne, despite my better judgement I re-entered SQQQ a hair above the lows, as well as UVXY after taking gains at open. Methinks, smallish 4th wave nearly complete with 5 down to 2280 gap towards the end of the week. After that, who knows, but the bankster intervention is really spooking many friends on the street, and across the pond. Finally, I believe their power is waning.
If you are not holding options expiring this week on that SQQQ trade, I think you’ll be fine! I am thinking this is probably just the A leg of an abc underway and I expect UVXY to trade between 25 and 30 before we are done. The banksters are going all out no doubt and it’s hilarious to see the impulsive drops down in the absence of any real selling and the slow torturous rising wedges as they burn unbelievable amounts of cash. I think after the upcoming B bounce we are going to get a sweet C wave down – probably a thousand points in DJI and a hundred in SPX so I will be looking for that set-up. It will be interesting to see how high the B bounce goes. Probably one more move down tomorow before b gets going to keep the crowd befuddled…lol!
Holding both outright. I tend to stay away from options on the “trading vehicles”, unless a married put or covered call. Also, I set my profit objectives and stops right after entering so I don’t have to stare it all day.
VIX continues to act strangely. The BBs should be exploding and they are not. Somebody, as we say in the islands, is trying to give us a 6 for a 9…! 😀
I am looking at that monster bearish engulfing candle the triple Qs posted on March 21 and thinking this move up today is total BS. Buying to open 131 puts expiring this week for 0.79. Stop at top of bearish candle at 132.43….
I think some massive malfeasance and market manipulation may be about to come home to roost. They are loosing it and are probably going to get hammered….imho 🙂
If VIX prints a green candle after all that cash they burned this morning, batten down the hatches…..
Candle at 2:57pm was more cash then they used in the first hour.
The banksters desperately trying to short volatility.
Market a really dangerous place right now…mostly on the sidelines for short term trades with exception of a light straddle…..
What should be happening is the massive short volatility position should be unwinding and VIX should move much higher in a capitulation spike but so far this is just is not happening as the short positions are hoping to continue to pile on. This ought to be most interesting…. a close of UVXY above 20.00 means they have lost the skirmish….even one penny above 19.90
should have them running for cover. I have a monster buy stop at 19.91….
I am thinking this correction is not a simple zig-zag. It looks to be a combination of some sort that may complete this week.
Otherwise, the Alternate counts are correct and we are in a Primary degree correction that will take many weeks to complete.
I recently came across an analyst (Bob Kudla of Trade Genius) that had some great insights about how volatility suppression is used to mask risk and permit traders to make riskier, more leveraged trades in the market. I found it interesting that he used the exact same term I sometimes use to describe market declines -“managed”. It continues to appear to me that they are keeping just enough of a bid under the market to preserve even if only a glimmer of near-term bullish hope in those long the market. They are doing a great job so far for nobody’s selling…yet we drift lower…
The market is tanking but nobody is selling…
How long will it take for all the retail buyers who jumped on the “Trump Rally” to decide that maybe they made a big mistake?
Exited my long SPY calls and UVXY puts at the open. Still long volatility in my long term account. Ordinarily this VIX jump above the BBs would herald an imminent reversal but today I am quite skeptical. We have been at extreme levels of VIX compression for longer than ever seen in market history. There is no way this move signals the massive shorting of volatility has in any way even begun to be unwound – I just don’t buy it… not even close! I am content to wait and see how long the compression continues until we get a real capitulation. It may well take another 1000 DOW points so it will be interesting to see the pain thresh-hold of the brave souls massively on the short side of volatility.
The banksters can impress us by filling this morning’s gap down for starters…if they can….!
I have been noting a move to close the gap at 2320 was a good target. Now it looks like a test of 2300 is in the making.
The SPX weekly MACD is pointing down and about to show a bearish cross.
Quite a few gaps opened on this runaway move up. If Gann is right about how this kind of price action resolves, we are going to fill ’em all before we’re done…
Here is the SPX chart showing significant lower BB penetrations the last year or so. So far as I indicated, the reaction of VIX to the penetration has been muted when compared to other such events. This is strange considering we are now in the fourth week of this correction. The anomaly is complicated by the fact that we are seeing a decline off a run-away parabolic rise to the upside and generally broken parabolas return to their origin. Gann also suggested the first larger than the average minimal decline in a run-away leg higher is a sell-signal and one should look for a typical correction of 10 % for an ongoing bull market, and 20% for the first leg down in a new bear market if a top is in. The current correction is becoming very dicey because it now starting to exceed the typical minor correction of a bull run in duration, but nowhere near what one would expect in depth. This strange fact is certainly confirmed by the muted state of price action in VIX. I personally have never seen (as I keep saying) anything quite like this and am not at all sure what to make of it. Could it be the result of relentless central bank intervention to resist a market decline distorting duration and depth relationships between developing waves? I got the impression they were “all in” and expressed the opinion that the market had started to fall in spite of them. There has very obviously been very little selling pressure. I went long on Friday even though we really did not get a reversal signal from VIX and futures are now suggesting we have more downside. How much more? We should get a good idea by Monday’s close. Without a clear VIX reversal signal we could be just completing the A wave of a larger ABC.
Futures down decent amount
Very interesting. Quite a bit of buying power expended in the move off Friday’s lows. If we don’t see a reversal Monday….!
VIX with dates. Earlier post awaiting moderation I think…Here is what I said so forgive the duplication when that earlier one goes up. It also has the SPX chart:
“I took a quick look at volatility as expressed by VIX price action the last year and we are seeing something quite remarkable, and that is how successfully it has been suppressed. I examined the last four times we had substantial lower BB penetration by SPX and compared how VIX traded when that happened. It would appear that we are at these price levels witnessing a completely new paradigm so far as price/volatility correlation is concerned. Either we have the most spectacular phase of the blow-off top yet ahead, or the suppression in volatility has now become so extreme that it no longer tells us anything about the true level of risk in the market. I am not saying it is not telling us anything about the level of perceived risk, for the relative price action in VIX makes that quite clear, what I am saying is that it is entirely possible that price/risk discovery by looking at VIX is no longer possible. There is another explanation that is so incredibly outlandish as to be almost unthinkable – I will leave that to the reader’s imagination.
I will post corresponding VIX chart with dates of lower BB penetration noted.”
Verne, you know the answers to your questions :). No risk here, move along….
These are not the droids you are looking for…! 😀 😀 😀
My data feed showed a higher high and higher low for VIX, even though it had a red close. The short VIX ETF SVXY also showed a lower high and lower low even though it closed green. This can sometimes be an indication that volatility is simply pausing on an upward march so it might be a cautionary note. VIX does tend to print nice full, fat candles or sport a long upper wick at genuine reversals. Perhaps at minor degree we did not see the typical reversal signs. I am still not sure why your feed showed lower highs and lower lower lows.
That’s really strange Verne. StockCharts data for VIX shows exactly what you state; a higher high and a higher low, which means their inverted VIX should have moved down.
But they have it up.
Crikey. How on earth to read that? My conclusion: give it zero weight.
That does still leave the AD line divergence though.
It is strange indeed. For some time now I have been entertaining some nagging doubts (which I have understandably kept to myself! 😉 ) about some of the data we have been seeing. I really am loathe to start thinking the unthinkable and rather am trying to find a rational explanation for why we would see something like this….I wonder if others have noticed….we also just had VIX trading the last two months at it lowest average value for the longest time ever!!!!