
Thursday’s session was expected as very likely to see price move lower due to strong and unusual divergence between price and VIX for Wednesday’s session, which was interpreted as bearish.
Thursday made a slightly higher high and a higher low, the definition of upwards movement, but the candlestick closed red and the balance of volume for the session was downwards.
Summary: Minor wave 4 may continue. Price may consolidate here for another four days.
A new low below 2,322.17 now would confirm minor wave 4 has arrived. At its end, minor wave 4 should offer an opportunity to join the upwards trend.
New updates to this analysis are in bold.
Last monthly and weekly charts are here. Last historic analysis video is here.
MAIN ELLIOTT WAVE COUNT
WEEKLY CHART
Click chart to enlarge.
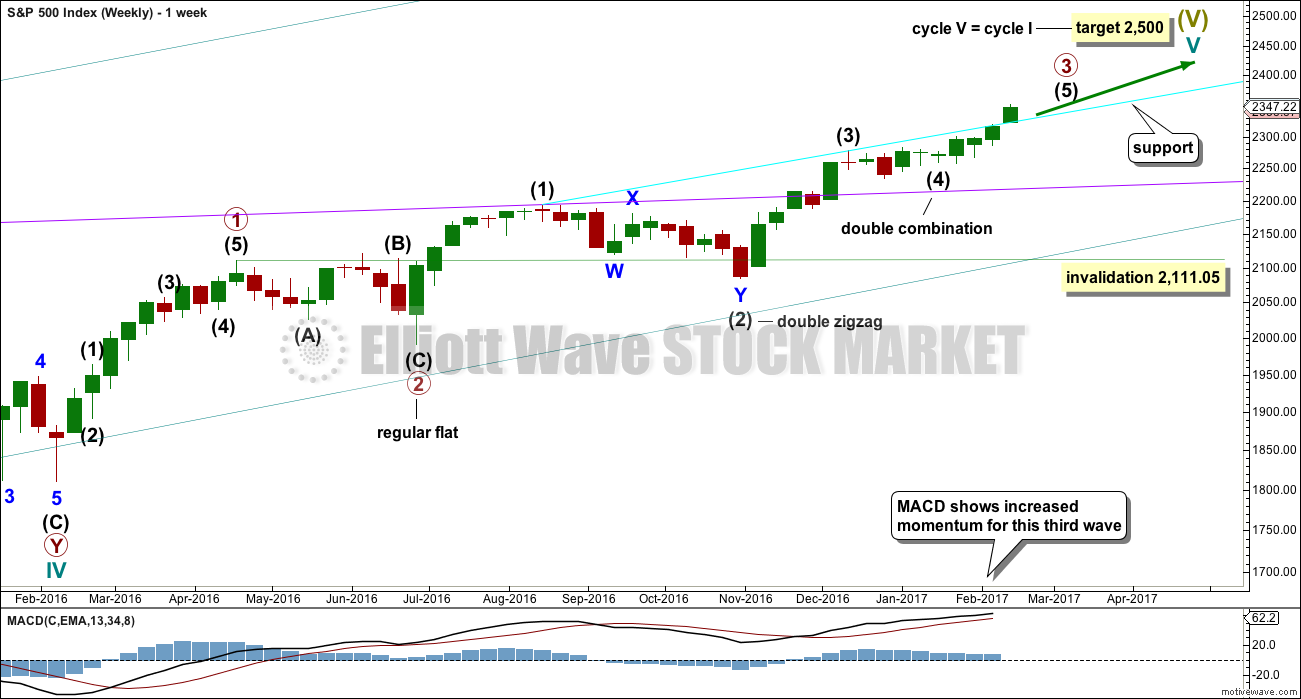
Cycle wave V is an incomplete structure. Within cycle wave V, primary wave 3 may be relatively close to completion.
When primary wave 3 is complete, then the following correction for primary wave 4 may not move into primary wave 1 price territory below 2,111.05.
Primary wave 2 was a flat correction lasting 47 days (not a Fibonacci number). Primary wave 4 may be expected to most likely be a zigzag, but it may also be a triangle if its structure exhibits alternation. If it is a zigzag, it may be more brief than primary wave 2, so a Fibonacci 21 sessions may be the initial expectation. If it is a triangle, then it may be a Fibonacci 34 or 55 sessions.
Primary wave 3 at this stage though is incomplete and should continue to move price higher if this wave count is correct.
DAILY CHART
Click chart to enlarge.
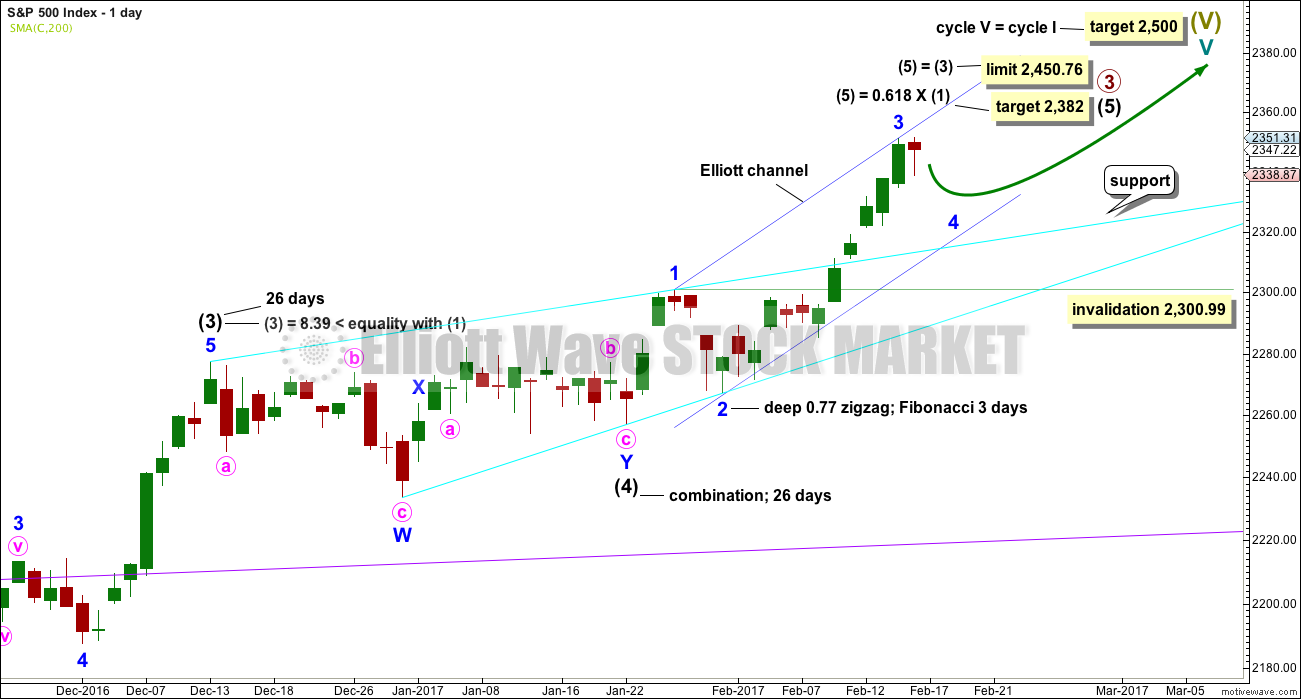
Intermediate wave (4) is a complete combination: zigzag – X – flat. It would have been even in duration with intermediate wave (3), both lasting 26 days.
Intermediate wave (3) is shorter than intermediate wave (1). One of the core Elliott wave rules states a third wave may never be the shortest wave, so this limits intermediate wave (5) to no longer than equality in length with intermediate wave (3) at 2,450.76.
Minor wave 3 has moved beyond the end of minor wave 1, meeting the rule.
Minor wave 2 was a deep 0.77 zigzag lasting three days. Minor wave 4 may exhibit alternation as a flat, triangle or combination and may last about a Fibonacci three or five days. It may not move into minor wave 1 price territory below 2,300.99.
Minor wave 4 may find support now at the upper cyan trend line. This may assist to force it to be very shallow. Minor wave 4 may not move into minor wave 1 price territory below 2,300.99.
Intermediate wave (5) has so far lasted 18 days. It may be expected to be shorter both in length and duration compared to intermediate wave (3). At this stage, an expectation of a Fibonacci 34 days total for intermediate wave (5) looks reasonable, so it may now continue for another 16 days or sessions.
The proportion here between intermediate waves (2) and (4) is acceptable. There is alternation. Both are labelled W-X-Y, but double zigzags are quite different structures to double combinations.
HOURLY CHART
Click chart to enlarge.
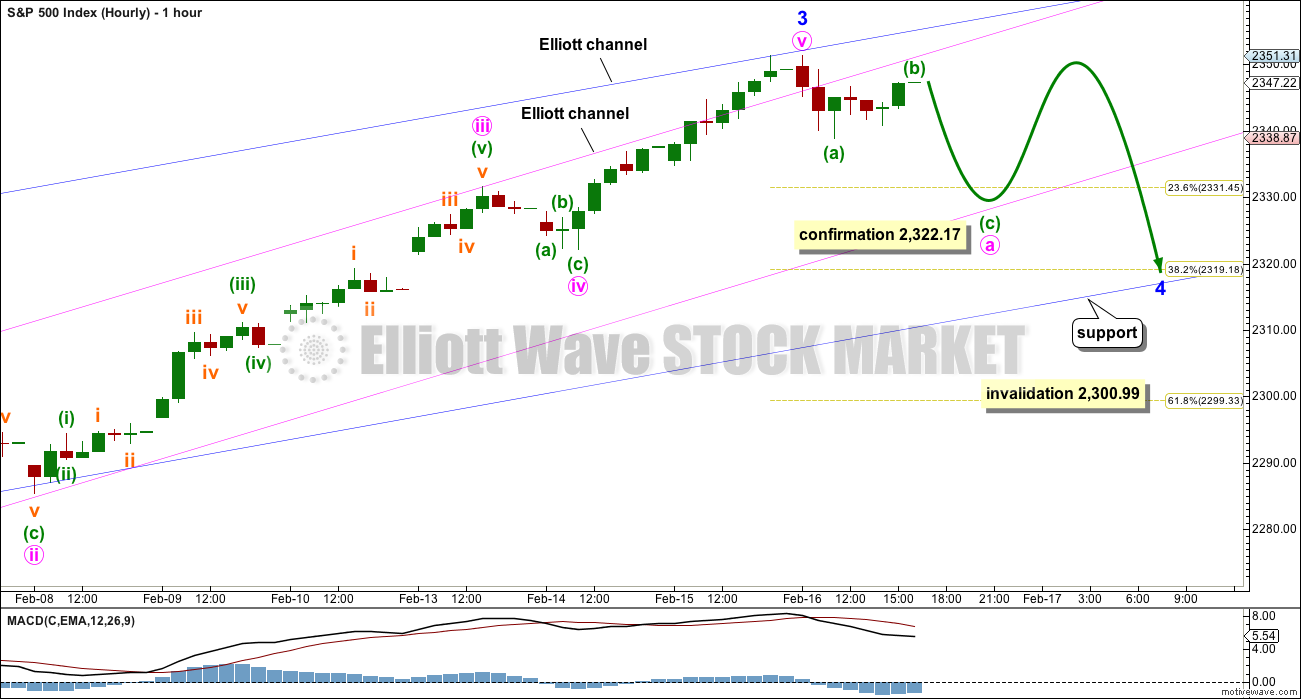
A new low below the start of minute wave v at 2,322.17 could not be a second wave correction within minute wave v, so at that stage confidence may be had that minor wave 3 is over.
Minor wave 4 may be a choppy, overlapping time consuming correction. It is most likely to be a flat, triangle or combination. Expanded flats are very common structures and they include B waves that move beyond the start of their A waves. A new high within minor wave 4 is entirely possible.
Flats, combinations and triangles are all more time consuming structures than zigzags. Minor wave 2 lasted a Fibonacci three days, so minor wave 4 at this stage may be reasonably expected to be longer in duration. A Fibonacci five days will be the expectation at this stage.
Minor wave 4 would most likely end about either the 0.236 or 0.382 Fibonacci ratios.
Minor wave 4 may end within the price territory of the fourth wave of one lesser degree; minute wave iv has its territory from 2,331.58 to 2,322.17.
If it gets down that low, or takes long enough, minor wave 4 may find support at the lower edge of the wider blue Elliott channel that is copied over from the daily chart.
On the five and one minute chart, minuette wave (a) looks like a five wave structure. Minuette wave (b) so far looks like a counter trend movement. A zigzag downwards may be unfolding for minute wave a.
There are multiple structural options open for minor wave 4 at this very early stage. The labelling within it will change as it unfolds, as the structure becomes clearer. My focus over the next few days will be to identify when minor wave 4 may be considered complete in order to find an entry to join the upwards trend.
At this stage, I cannot see it as complete if the wave down labelled minuette wave (a) is indeed a five. It would also be too brief and shallow for a minor degree correction. Expect it to continue.
TECHNICAL ANALYSIS
WEEKLY CHART
Click chart to enlarge. Chart courtesy of StockCharts.com.
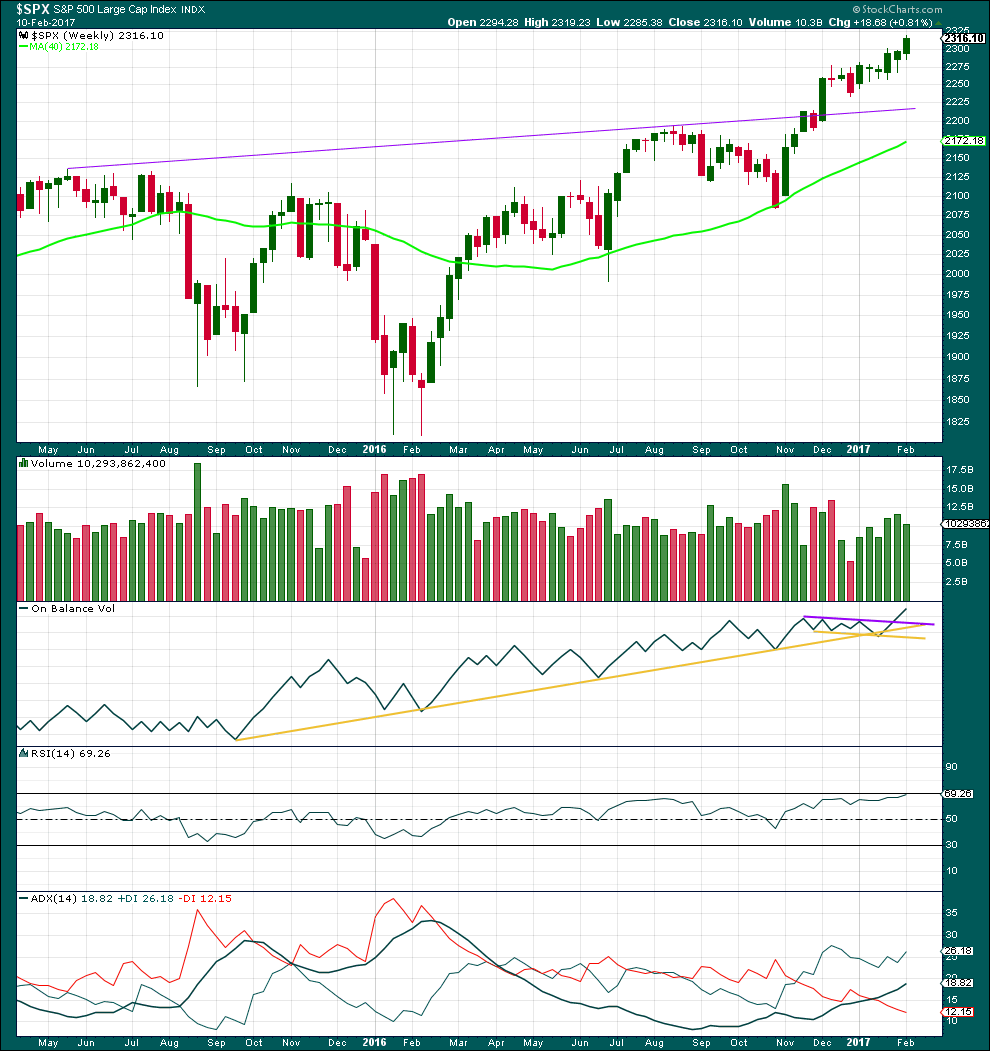
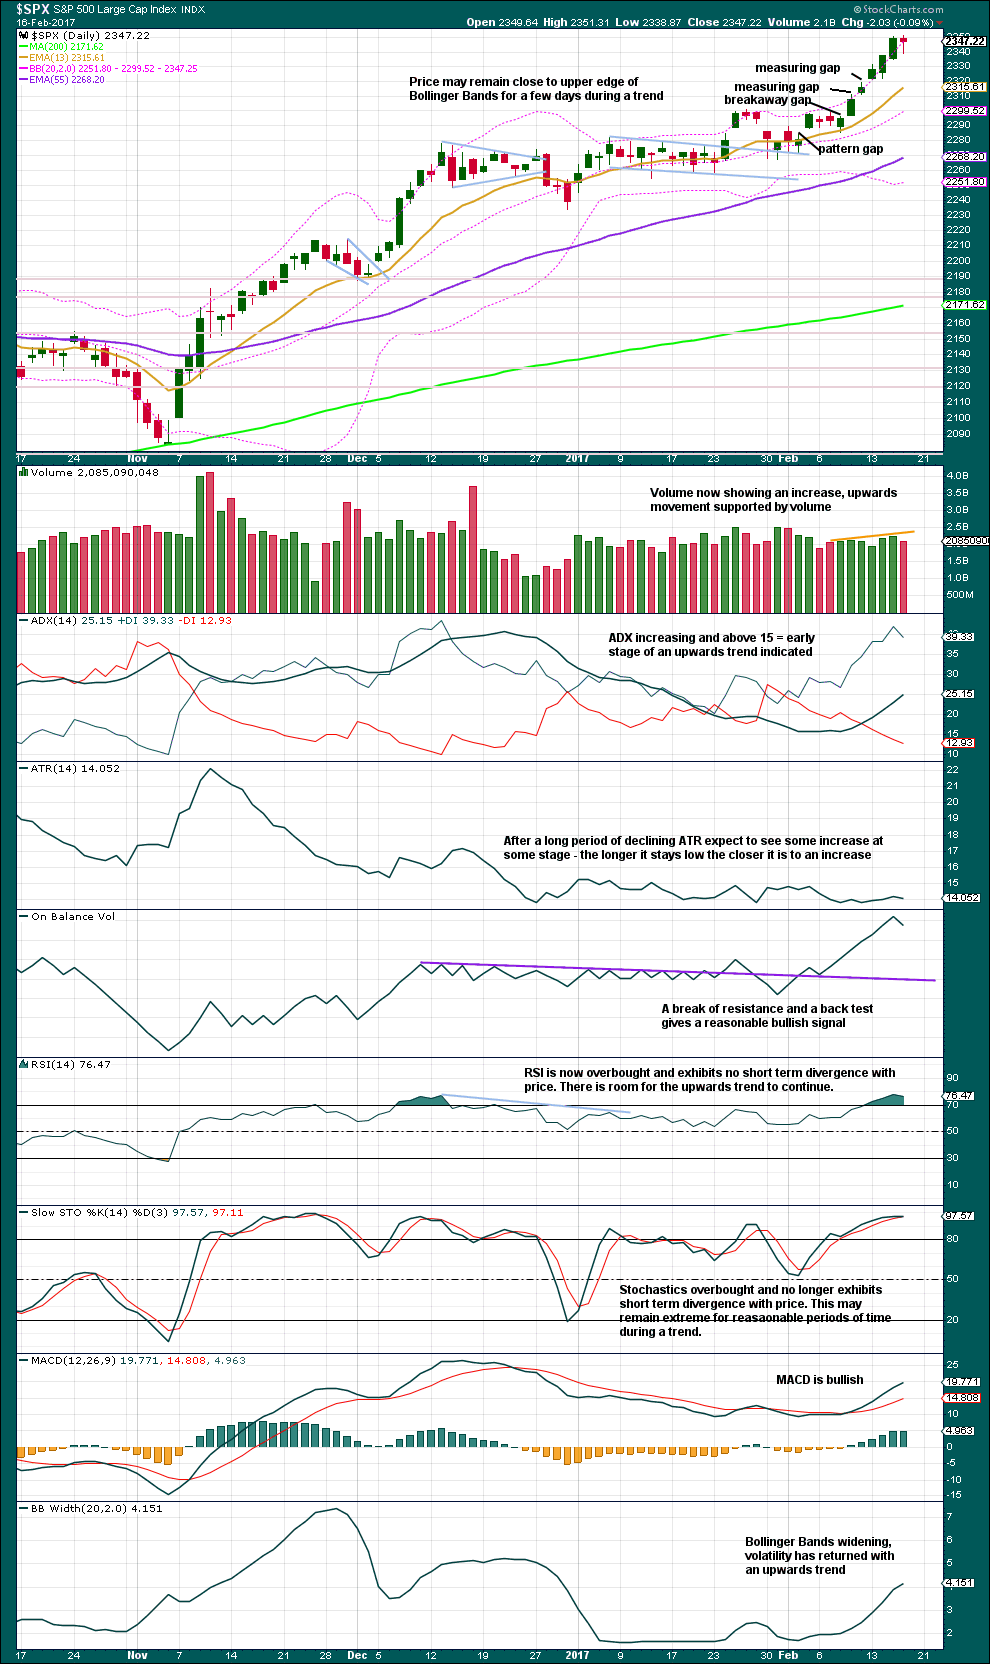
Overall, price is moving higher on increasing volume. Last week sees a decline in volume from prior week, but volume is still stronger than the first three weeks of upwards movement.
On Balance Volume gave a bullish signal with a break above the purple resistance line. This line may now offer support and assist to halt any fall in price from being too deep.
RSI is not yet overbought at the weekly chart level. There is room for price to rise further.
ADX indicates an upwards trend, and ADX has a long way to go before it becomes extreme.
DAILY CHART
Click chart to enlarge. Chart courtesy of StockCharts.com.
Technically, today constitutes an upwards day: a higher high by by 0.01 points and a higher low. However, the balance of volume was down and the candlestick closed red. This looks typical of recent behaviour during a consolidation.
During the session, the balance of volume was down and it shows a decline. The fall in price was not supported by volume. Consolidating markets typically have lighter volume than the prior trend, so this offers some support for the Elliott wave count which sees price now entering a small consolidation.
Overall, this chart looks very bullish as does the weekly chart. There is an upwards trend in place and it is not extreme yet. Use corrections as an opportunity to join the trend. Do not trade against the trend.
VOLATILITY – INVERTED VIX CHART
Click chart to enlarge. Chart courtesy of StockCharts.com.
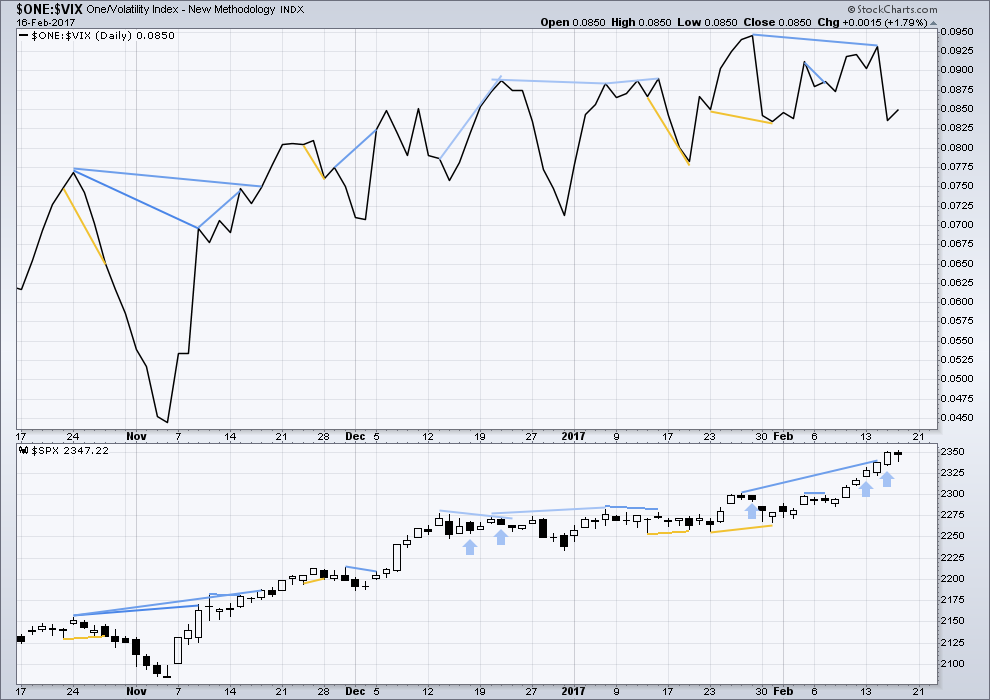
There are a few instances of multi day divergence between price and inverted VIX noted here. Bearish divergence is blue. Bullish divergence is yellow. It appears so far that divergence between inverted VIX and price is mostly working to indicate short term movements spanning one or two days. While this seems to be working more often than not, it is not always working. As with everything in technical analysis, there is nothing that is certain. This is an exercise in probability.
Yesterday saw the strongest divergence yet between price and VIX. Price moved strongly higher with support from volume. Normally, volatility should decline on rising price as it almost always does. However, inverted VIX moved strongly lower. Volatility sharply increased as price moved higher. The increase in volatility is quite reasonable, so this is not a small divergence.
This divergence indicates something wrong yesterday with the upwards movement from price, and it is interpreted as very bearish. It has been followed by an upwards day (just, technically) with a balance of volume downwards. This strong divergence may yet be followed by more downwards movement before it may be considered resolved.
Bearish mid term divergence is still in place.
Price moved slightly higher today and inverted VIX agrees. There is no new divergence.
BREADTH – AD LINE
Click chart to enlarge. Chart courtesy of StockCharts.com.
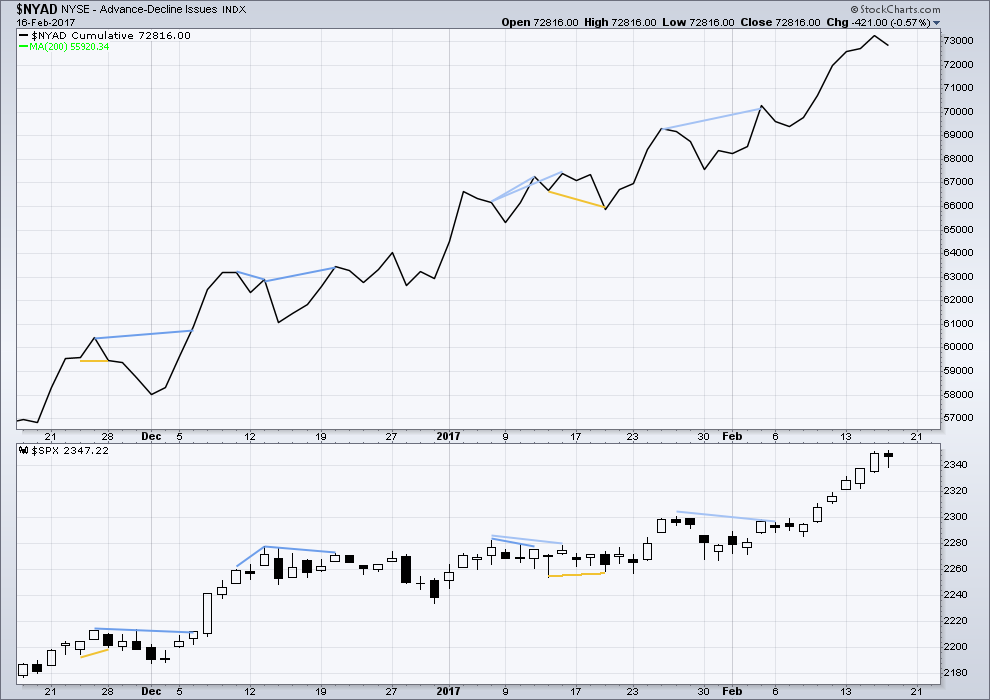
There is no short nor mid term divergence today between price and the AD line. The rise in price to a new high today was accompanied by a corresponding new high in the AD line. The rise in price has support from a rise in market breadth. Lowry’s OCO AD line also shows new highs along with price. Normally, before the end of a bull market the OCO AD line and the regular AD line should show divergence with price for about 4-6 months. With no divergence, this market has support from breadth.
Price moved technically higher today (albeit by only 0.01 points) yet the AD line declined. Market breadth declined as price moved slightly higher overall for the session. This is interpreted as bearish.
DOW THEORY
The DJIA, DJT, S&P500 and Nasdaq have made new all time highs in December of 2016. This confirms a bull market continues.
This analysis is published @ 8:50 p.m. EST.
Unceremoniously stopped out at 0.25 for a loss on small speculative position. 🙂
Will reload next week’s expiration 125.00 strike puts for 2 bucks apiece….the algos are sure busy!!
Hourly chart updated:
And price has done almost nothing. Good on you Verne for finding a vehicle to make money today! Because S&P sure isn’t doing much for anyone.
Looks like you expect a Zig Zag for minor four?
That would be a beeooutiful thing I tell ya…!
It should give a nice vol spike if it unfolds as a ZZ
No, just a zigzag for minute a within minor 4.
That means minor 4 could be a flat, triangle or combination. All sideways types of corrections.
Wouldn’t it be nice if minor 4 as a neat little triangle? Then it would be relatively easy (huh! as if anything here is easy!) to see it’s end and we’d have a golden entry point handed to us on a platter.
Daydreaming here….
I think your advice for most folk to sit out the correction is very wise. These periods of watching the paint dry don’t offer up too many trading opportunities, and even then, you have to be lightning quick to make it worth the effort.
Thank you Verne.
Yeah, it’s the hardest thing to do isn’t it. Wait patiently for a trade set up.
But it’s the trades we don’t take which can make a difference between profit and loss.
I will be going out today to do my volunteer work with Marunui Conservation, resetting trap lines in a Kiwi zone to protect Kiwi 😉 Awesome, bush crashing for about 5 hours…
Analysis for end of week will be done either this evening my time or tomorrow morning. Published by late Saturday evening EST.
That sounds like fun and work at the same time, Lara. Have a great time. What kind of animals do you trap and how do you dispatch of them?
It was most awesome fun, seriously hard work, climbed a darn mountain. Into the clouds.
The traps kill the animal immediately (almost always). We’re removing any dead animals and putting fresh bait in, and checking the trap works if nothing is caught.
Today on my trap line we found one dead cat and one dead rat. Thats two less predators to kill Kiwi 🙂
Opening STC order on 126 puts at a limit of 1.10
Moves down will probably continue to be bought until it decisively breaks 120.00
Reloading SVXY 126 puts expiring tomorrow @ 0.41 per contract- a speculative trade to be closed later today…
SVXY looks like it is setting up to decline in five waves from this week’s high. In that case it should take out its wednesday low….
The new banner pic is taken from Langs Beach in the aftermath of Cyclone Pam. The waves were huge. Far too big for me to go out, but most awesome to watch 🙂
Epic pic, nice offshores too!
I was going to mention what a nice banner you put up. Is the surfer anyone I know? I spent a week on the north shore of Oahu, Hawaii, one time on a much longer Hawaiian vacation. I went to the beach were they call the waves the “Pipe Line”. The waves were about 30 feet tall. Silly me, I thought, “I am going to go body surfing.” Wow. It was great fun until one wave caught me and slammed me to the sandy bottom mixed with coral. I did not get hurt, thankfully. But I knew I was in over my head so to speak. I went to the beach and watched the waves to my heart’s content.
You can see I’ve been a risk taker all my life. Most times it ends up good. But when it ends badly, it is really bad.
Have a great day and thanks for the wonderful analysis and clear commentary.
Speaking of risk, traders continue to short volatlity with great confidence. I am curious to see if we get any kind of capitulation after the historic market complacency of recent sessions. We did not get one for minor two….
Wow, that’s awesome Rodney! I’ll go to Pipe Line one day, but if it’s not too big for me then it’ll probably be so crowded I’ll just watch.
No, the surfer is just some random dude who was out that day. Some of the locals I know were out. That day was even too big for Cesar, but I have some really crazy friends that did surf it 😉
One interesting thing about my visit to the Pipe Line beach is that my family and I were the only ones there. It was 27 years ago this past month of January.
Nice!! I can almost hear the waves….
Sweet pic, Lara! I noticed it right away. Is this another of Cesar’s works?
Yep. Both the new banner pics are Cesar’s. He’s great. Our home is filled with his awesome art, and he keeps changing it for new stuff so it never gets boring.