
A new all time high confirms the main Elliott wave count and invalidates one alternate. Some more confidence may now be had in the targets.
Summary: The target is 2,338 for the short term and 2,382 for a longer term trade. The invalidation point is moved up today to 2,267.21. A new high above 2,334.58 would eliminate a very bearish alternate and provide confidence in this upwards trend. The trend has support from breadth, but not good support so far from volume.
New updates to this analysis are in bold.
Last monthly and weekly charts are here. Last historic analysis video is here.
MAIN ELLIOTT WAVE COUNT
WEEKLY CHART
Click chart to enlarge.
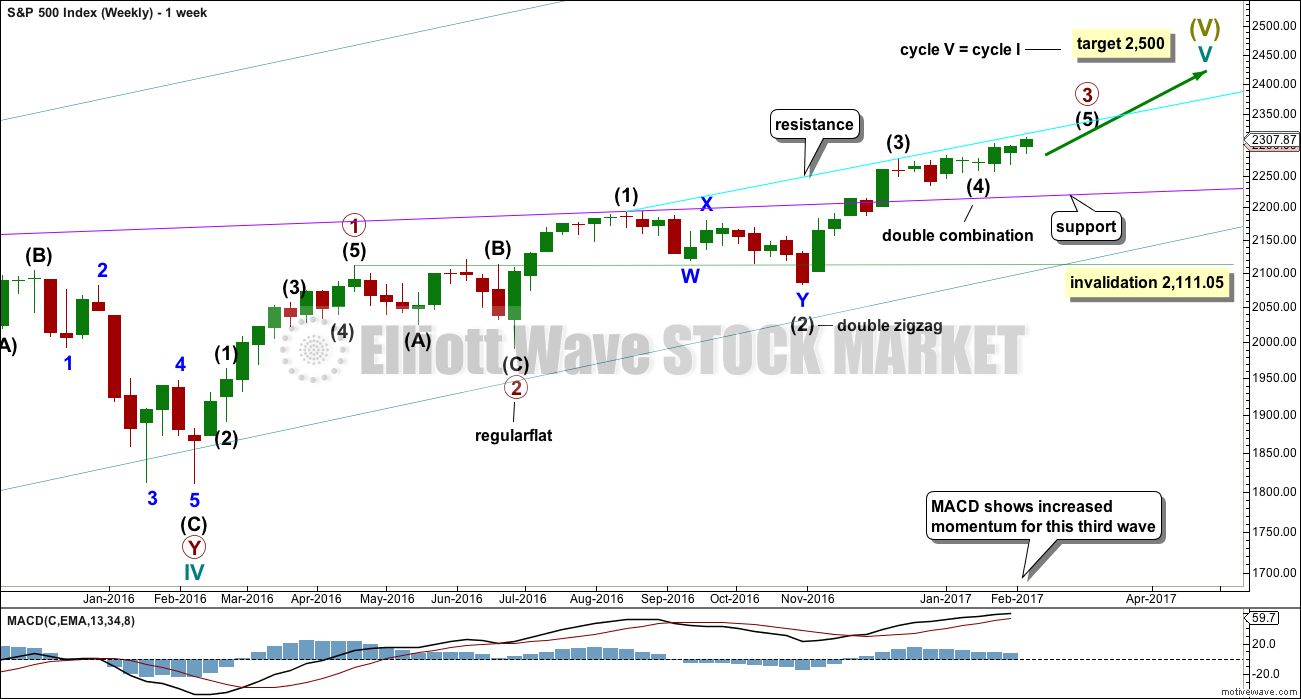
Cycle wave V is an incomplete structure. Within cycle wave V, primary wave 3 may be relatively close to completion.
When primary wave 3 is complete, then the following correction for primary wave 4 may not move into primary wave 1 price territory below 2,111.05.
Primary wave 2 was a flat correction lasting 47 days (not a Fibonacci number). Primary wave 4 may be expected to most likely be a zigzag, but it may also be a triangle if its structure exhibits alternation. If it is a zigzag, it may be more brief than primary wave 2, so a Fibonacci 21 sessions may be the initial expectation. If it is a triangle, then it may be a Fibonacci 34 or 55 sessions.
Primary wave 3 at this stage though is incomplete and may continue to move price higher.
DAILY CHART
Click chart to enlarge.
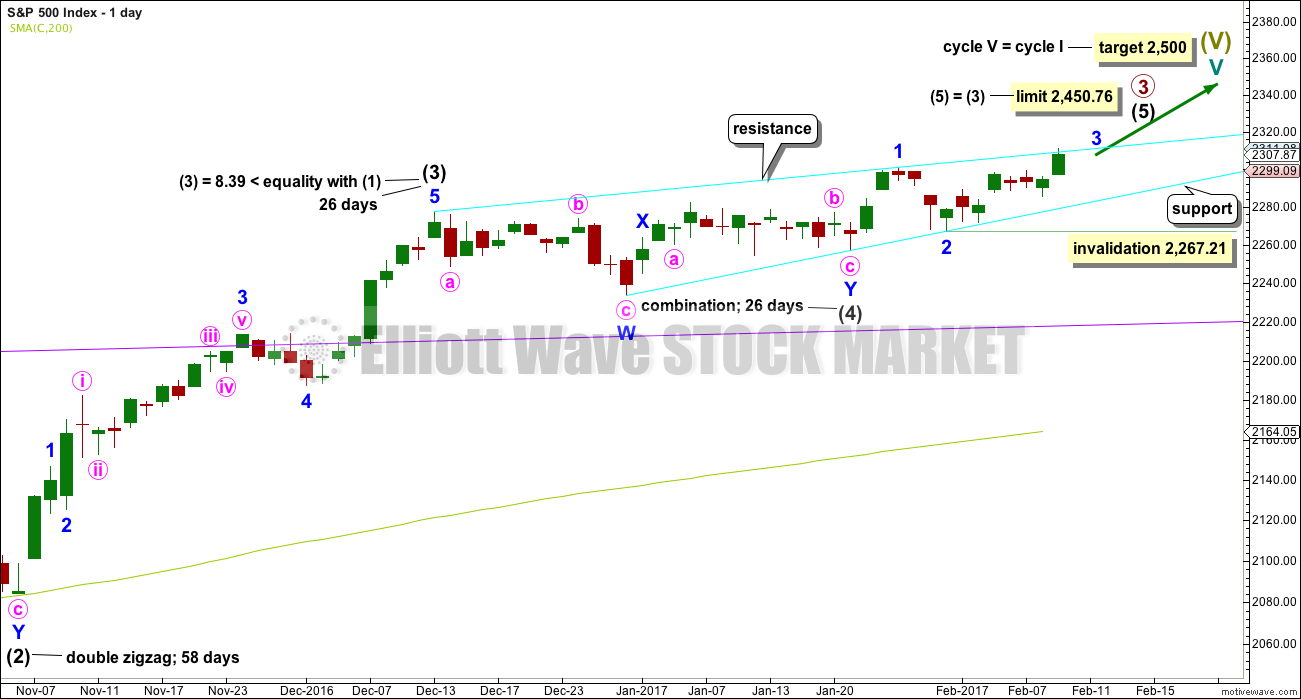
It is possible that intermediate wave (4) is a complete combination: zigzag – X – flat. It would have been even in duration with intermediate wave (3), both lasting 26 days.
Intermediate wave (3) is shorter than intermediate wave (1). One of the core Elliott wave rules states a third wave may never be the shortest wave, so this limits intermediate wave (5) to no longer than equality in length with intermediate wave (3) at 2,450.76.
Minor wave 3 has not moved beyond the end of minor wave 1, meeting the rule. Within minor wave 3, no second wave correction may move beyond the start of its first wave below 2,267.21.
Intermediate wave (5) has so far lasted just thirteen days. It may be expected to be shorter both in length and duration compared to intermediate wave (3). At this stage, an expectation of a Fibonacci 21 days total for intermediate wave (5) looks reasonable, so it may now continue for another eight days or sessions. This is starting to look a bit too brief now though. It may continue to total a Fibonacci 34 sessions.
The proportion here between intermediate waves (2) and (4) is acceptable. There is alternation. Both are labelled W-X-Y, but double zigzags are quite different structures to double combinations.
HOURLY CHART
Click chart to enlarge.
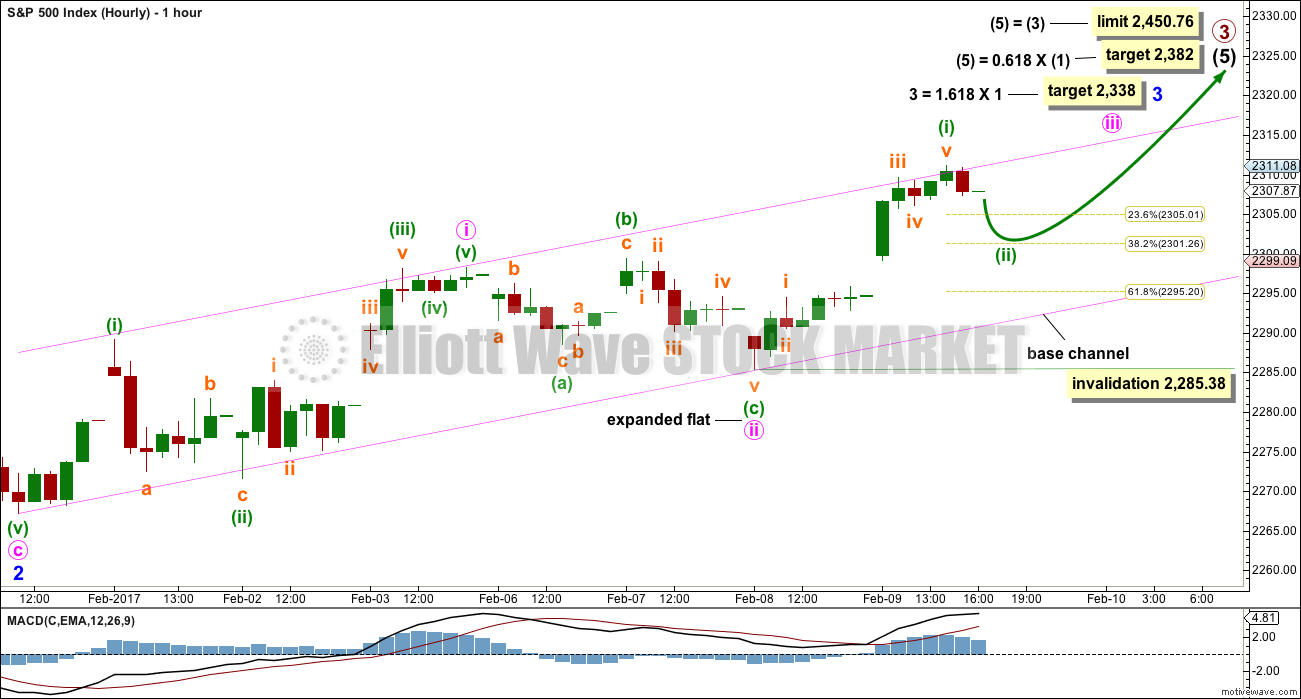
Intermediate wave (5) must subdivide as a five wave structure, either an impulse or an ending diagonal. At this stage, it is not possible to eliminate either option.
Within intermediate wave (5), minor waves 1 and 2 may be complete.
Minor wave 3 may only subdivide as an impulse. Within minor wave 3, minute waves i and ii may be complete. Minute wave iii may have begun and has probably not yet passed the middle strongest portion. Upwards momentum should show some increase for this wave count.
Minuette wave (ii) may be relatively brief and shallow; the 0.382 Fibonacci ratio is most appropriate, but it may be more shallow than that.
Minute wave iii should have the power to break above the upper edge of the pink base channel drawn about minute waves i and ii. Along the way up, lower degree corrections should find support at the lower edge of the base channel.
Minuette wave (ii) may not move beyond the start of minuette wave (i) below 2,285.38.
The target for minor wave 3 assumes the most likely Fibonacci ratio for it to minor wave 1.
ALTERNATE ELLIOTT WAVE COUNT
DAILY CHART – DETAIL
Click chart to enlarge.
I will publish alternate ideas from time to time in response to members queries or concerns.
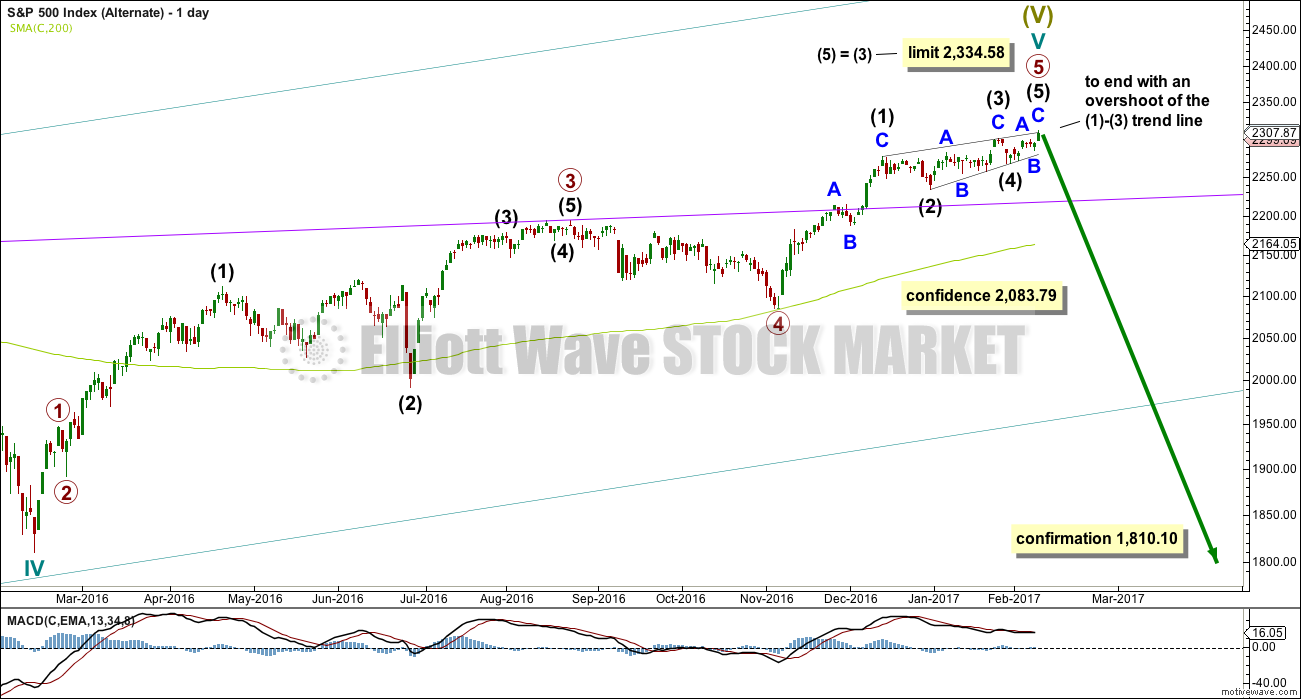
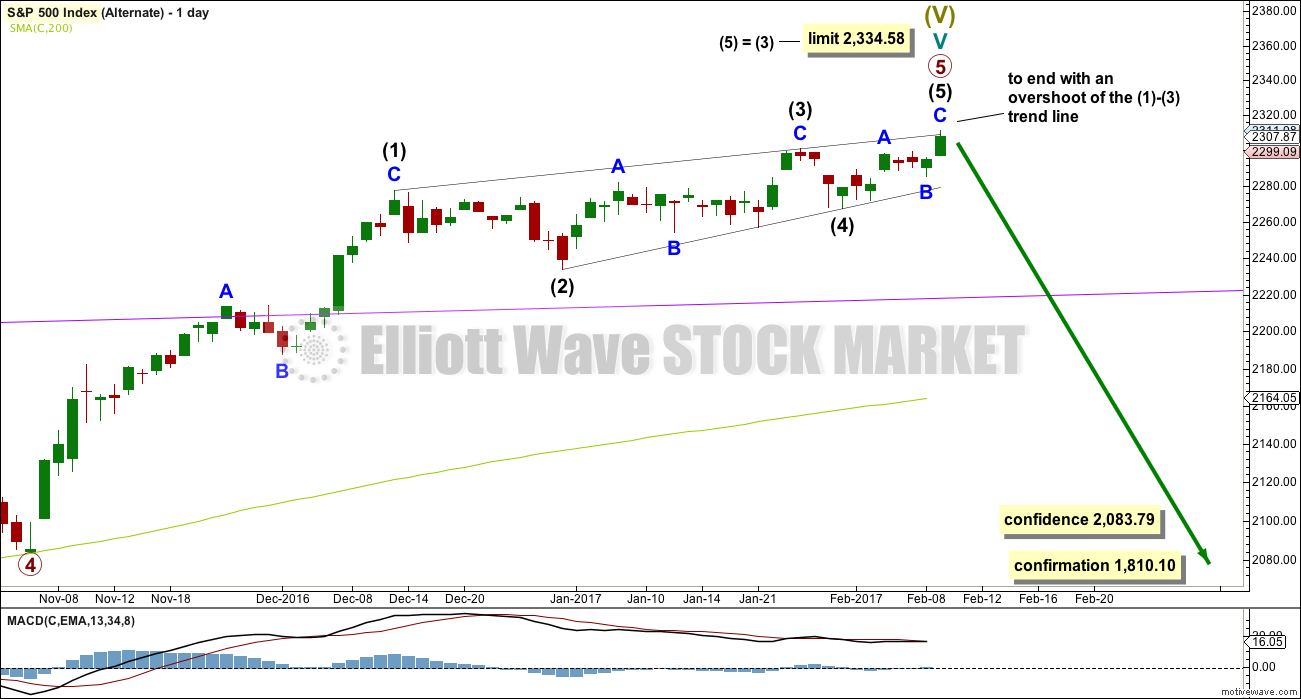
It does look suspiciously like an ending contracting diagonal may be underway and very close to completion.
Current upwards movement (which began on the 4th of November, 2016) must be a fifth wave for it to be an ending diagonal. That means that primary waves 1 through to 4 may be complete.
The only way for this to work and meet all Elliott wave rules is to see primary waves 1 and 2 over very quickly. This makes primary wave 3 longer than primary wave 1, so that the core rule stating a third wave may not be the shortest is met.
The ending diagonal is seen up close below.
DAILY CHART
Click chart to enlarge.
Ending contracting diagonals must have subwaves that all subdivide as zigzags. They normally end with a small overshoot of the 1-3 trend line.
If price makes a new all time high and slightly overshoots this line and then quickly reverses, then this wave count would be possible.
This wave count has some support from long term classic analysis at the monthly chart level, but it is not supported by Lowry’s analysis. At this time, Lowry’s do not see normal conditions for a major market top in place.
This wave count has a very low probability. It requires confidence below 2,083.79 now.
TECHNICAL ANALYSIS
WEEKLY CHART
Click chart to enlarge. Chart courtesy of StockCharts.com.
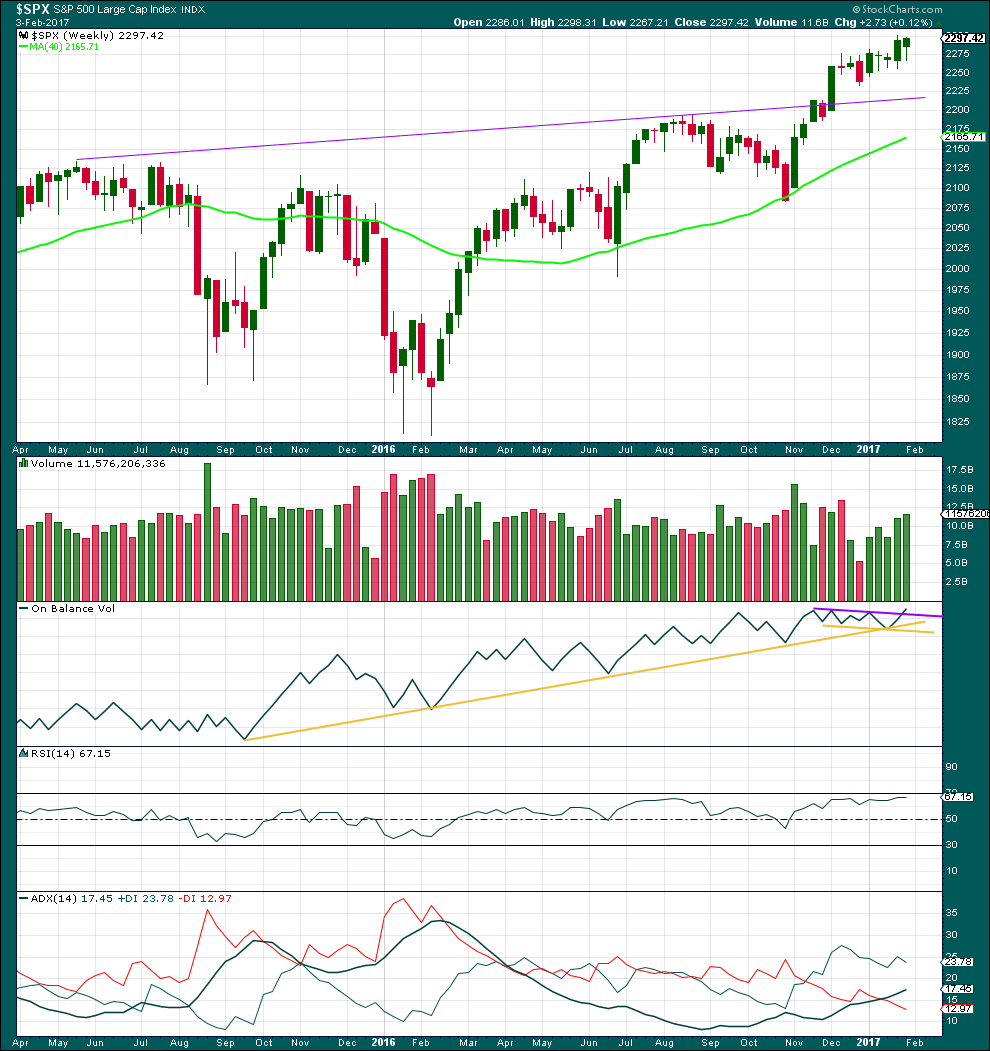
Overall, for five weeks in a row now, price has moved overall higher and volume is still increasing. The longer term picture at this weekly chart level looks like this market is in a reasonably healthy bull trend.
The long lower wick on this weekly candlestick is bullish. This week saw a further increase in volume, also bullish.
On Balance Volume has given an important bullish signal here with a break above the purple line. This line has a shallow slope and has been tested three times prior. This is a reasonable bullish signal.
RSI is not overbought. There is room for price to rise. There is no short or mid term divergence with price and RSI to indicate weakness.
ADX is above 15 and rising indicating a trend. The +DX line is above the -DX line; the trend is up. It is not yet anywhere near extreme. There is plenty of room for this trend to continue.
Overall, the picture on this weekly chart is very bullish. That does not mean the alternate Elliott wave count cannot be correct; it only means the probability of the alternate is lower than the main wave count.
DAILY CHART
Click chart to enlarge. Chart courtesy of StockCharts.com.
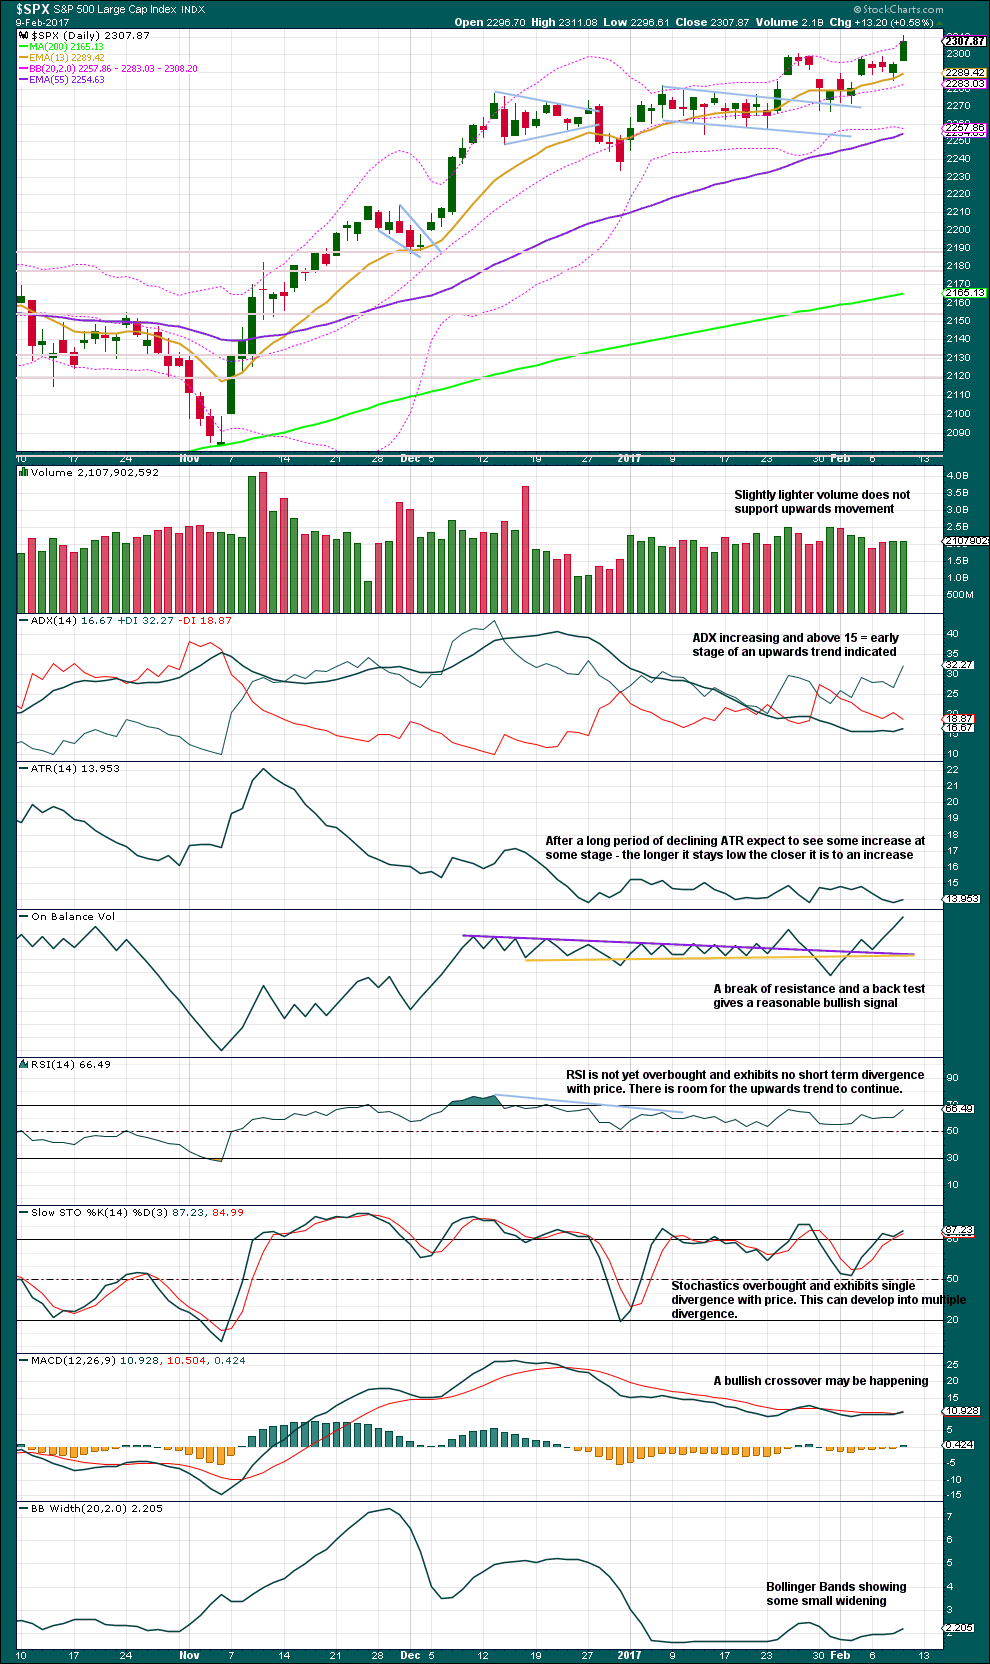
Most commentary is now on the chart.
Volume today is lighter than yesterday. The upwards breakout does not have good support from volume. Volume for the last two upwards days is however stronger than the two prior downwards days. There is some support for upwards movement.
Price may close above the upper edge of Bollinger Bands for several days in a row when this market is trending. The close today at the upper edge does not mean a pullback must begin here.
The trend is up. All three moving averages have a positive slope and price is above all three. Look for price to find support about the 13 day moving average.
The very bullish look now of On Balance Volume supports the wave count.
VOLATILITY – INVERTED VIX CHART
Click chart to enlarge. Chart courtesy of StockCharts.com.
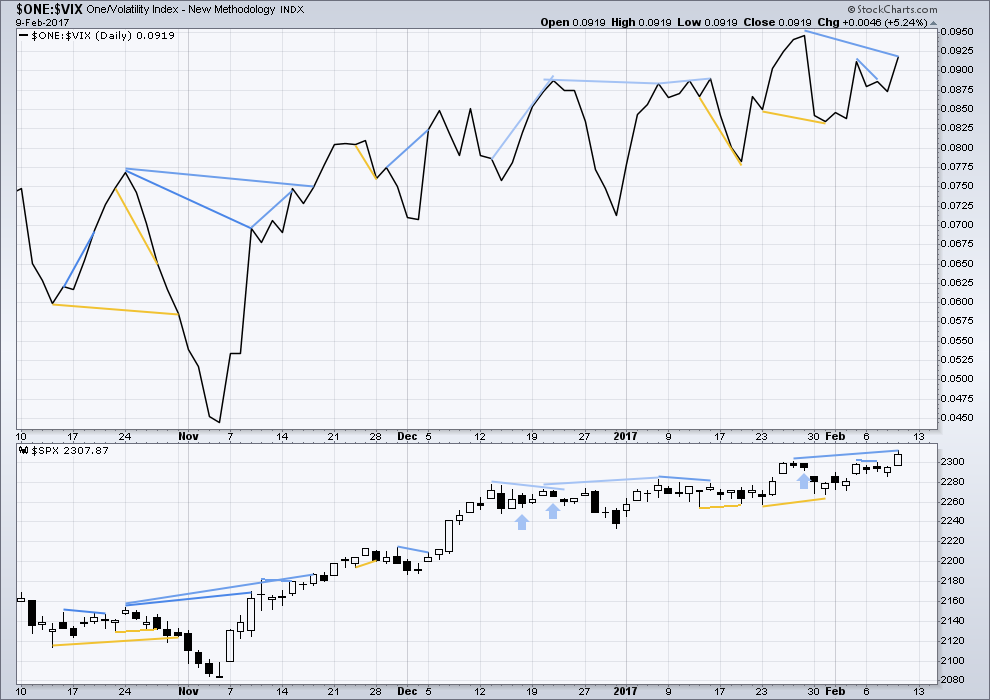
There are a few instances of multi day divergence between price and inverted VIX noted here. Bearish divergence is blue. Bullish divergence is yellow. It appears so far that divergence between inverted VIX and price is mostly working to indicate short term movements spanning one or two days. While this seems to be working more often than not, it is not always working. As with everything in technical analysis, there is nothing that is certain. This is an exercise in probability.
There is short / mid term hidden bearish divergence today between the new high from price and a lower high from inverted VIX. This indicates underlying weakness in price. This divergence may be followed by one or two days of downwards movement, or it may just disappear.
BREADTH – AD LINE
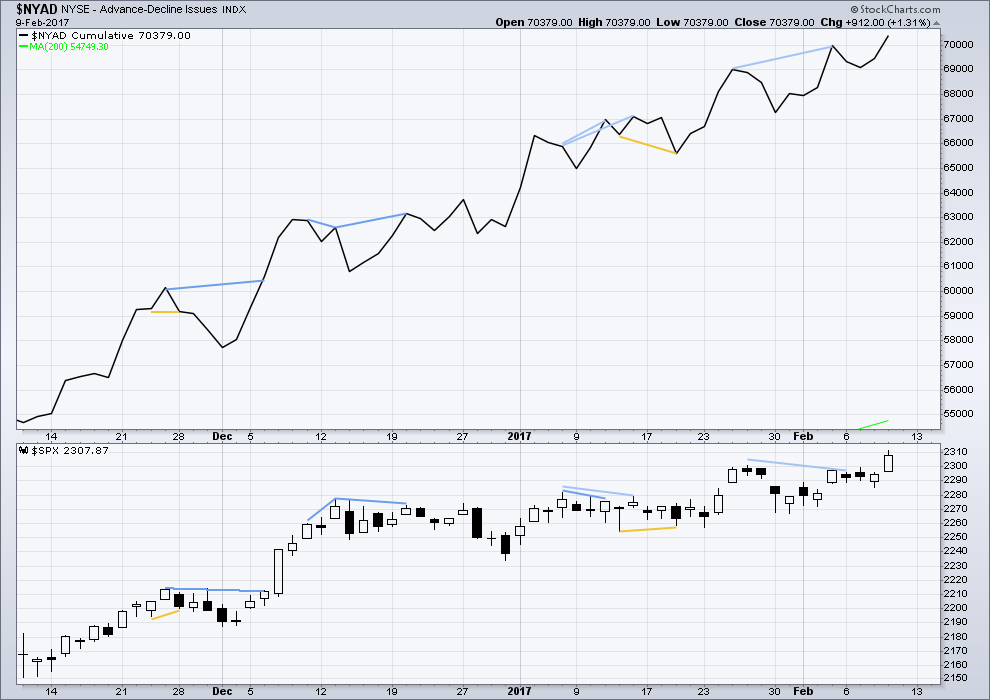
Click chart to enlarge. Chart courtesy of StockCharts.com.
There is no short nor mid term divergence today between price and the AD line. The rise in price to a new high today was accompanied by a corresponding new high in the AD line. The rise in price has support from a rise in market breadth.
DOW THEORY
The DJIA, DJT, S&P500 and Nasdaq have made new all time highs in December of 2016. This confirms a bull market continues.
This analysis is published @ 7:27 p.m. EST.
the Nasdaq is at its most extreme point when you look at the difference in the 200 day moving average. This has often been a warning and taken with the rsi being way overbought often predicts at least a correction in the area of 3 to 15 percent. I’m guessing 6 to 8 percent on average. This does not happen immediately when this occurs but usually within a month or so. See the chart for the last 10 times rsi has been this overbought. Again we could keep moving higher but the odds favor a correction soon. Let the buyer beware.
Volatility is also at aa five year low.
The current extremes in this market unlike any I ever saw, yet they persist!
On 02/09/2012, QQQ’s RSI(14) is 82.06, bigger than its today’s value 80.51. But, from that day, QQQ kept going up additional ~9% without real pullback in next 1+ month. So, that indicator cannot give us market timing.
The many small subdivisions within the S&P’s waves at the hourly chart level are often tricky to get right. It’s usually only when we’re sure the wave is done because price reverses that all the little subdivisions can be accurately labelled.
So this labelling will probably change as this unfolds.
Price has now broken above the upper edge of the base channel. It may now find support at the upper trend line. Today’s upwards gap may be a breakaway gap, if that is the case it should offer support.
Notice my hedging language here though folks. This particular market just doesn’t always play nice with it’s trend channels. Price certainly could go down back into the channel before the third wave really pulls up and away.
No change to targets, holding steady with this wave count for now.
Lara, I think you zagged when you should have zagged, this is the gold analysis, thanks. I’ll look over at the gold analysis to see the s&p ew. 😉
Lara, you may have posted the wrong chart: XAUUSD. But it is interesting. Maybe I should expand my trading vehicles.
I’m so sorry guys! That was done really early my morning…
Here’s the right chart 🙂
Thanks Lara. First thing this morning, IWM has broken out of the trading range to the upside. If it is a bull flag pattern, we have a long way to go to the upside.
Just to keep the record straight, I have taken long positions in IWM / URTY.
Nice Rodney. I’m still holding onto my long position, letting the profit run.
Not to rain on the parade, but I have the market completing some degree of 5th wave; hitting resistance on both Fibonacci and Fan levels, accompanied by all the negative divergences one could imagine. Further, at least in the SPX, waves appear to best be counted as three’s since the FEB low IMHO, which fits the ending diagonal requirement. Verne you’ll like this, I sold all longs in my IRA and bought a 4% UVXY long despite my better judgement.
Yes Chris. Optimism at three decade highs. Volatility at multi year lows…I must confess that makes me a nervous nelly…! Still eyeing that ED and what would now qualify as a 1-3 throw-over. I do so admire Lara’s tenacity… 🙂
Thanks Chris. I appreciate the comments and thoughts. According to Lara’s Alternate count, the ending diagonal is invalidated at 2334 or 18 SPX points above yesterday’s close. I think we will see that next week. I never posted a chart, but I have the ending diagonal as invalidated already.
I have a target for URTY (3X leveraged IWM) between 148 and 178. Currently at 125.48. I got in at 124.
Right on Rodney, and as we seen for many years now, counts both bullish and bearish have been invalidated all over the place, therefore I would not expect the end of this bull market to conform to anyone’s count, formation, resistance/support level, pattern etc. further, breadth stats won’t provide a warning here as etfs have grossly manipulated that data series. It will end when the central banks try to exit stage right….
I think the Russell is more promising than the other markets but I’m also concerned that we have rsi way overbought on the qqq’s. When that corrects all will more than likely follow. Bewwy intewesting . I would not be surprised to see we are in a blowoff top.
The pole on the IWM flag is quite long so if It is indeed a bull flag you are right.
Bullish signals everwhere-just like the bearish ones that we watched for so many months…