
Although today’s daily candlestick closed green, it made a lower high and a lower low (which is the definition of downwards movement). This was expected for the Elliott wave count.
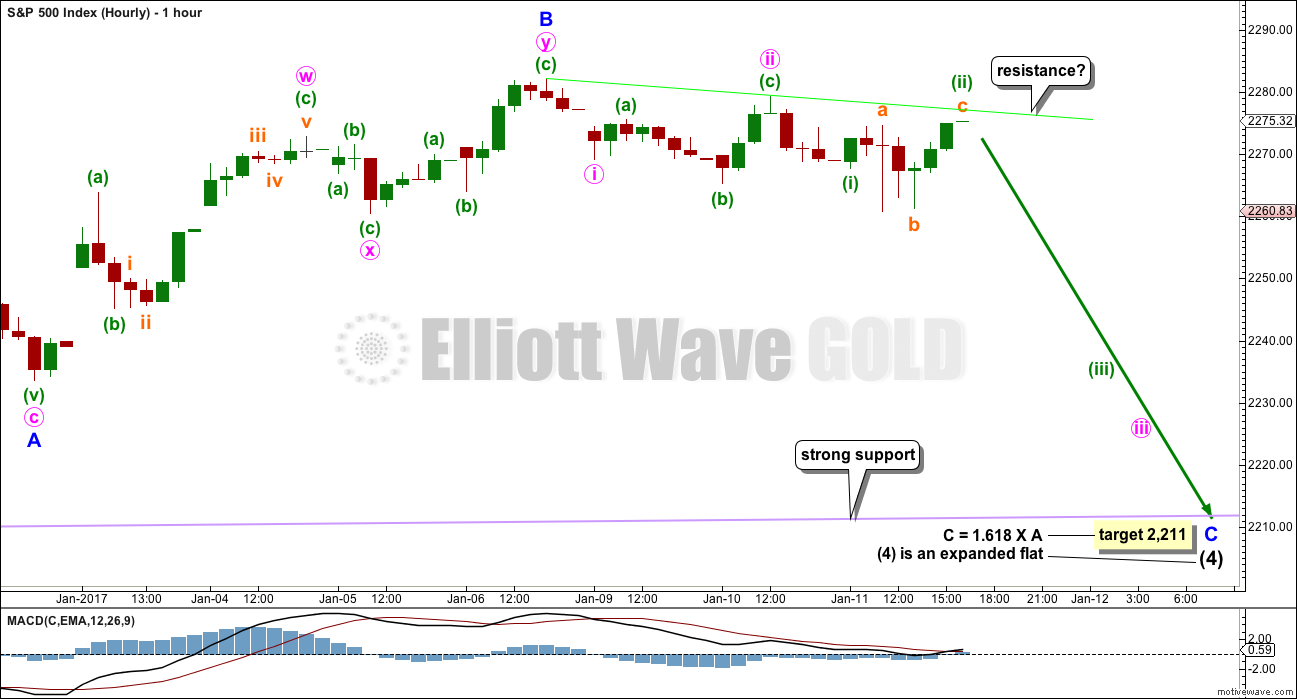
The short term resistance line on the hourly chart neatly showed where upwards movement for the session ended.
Summary: Some downwards movement to find support at the lilac / purple trend line is expected, about 2,211. If this target is wrong, it may be a little too low. Use the trend line as a preference. Thereafter, the bull market should resume.
This bull market is strong and healthy. Use this correction as another opportunity to join the trend.
New updates to this analysis are in bold.
Last monthly and weekly charts are here. Last historic analysis video is here.
DAILY CHART
Click chart to enlarge.
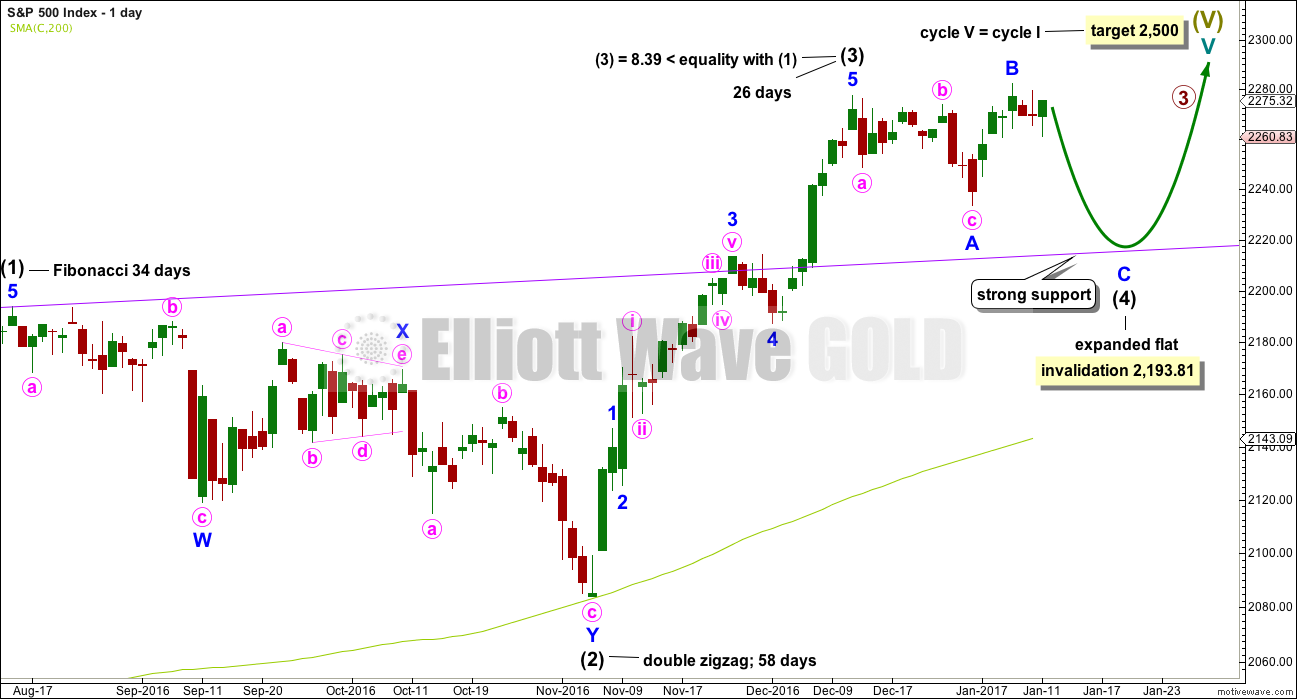
Intermediate wave (4) is exhibiting alternation with intermediate wave (2). Intermediate wave (2) is a double zigzag and intermediate wave (4) is an incomplete expanded flat.
Along the way up to the final target at 2,500 a more time consuming fourth wave correction for primary wave 4 would be expected for this wave count.
The purple trend line is the most important piece of technical analysis on all charts. Draw it carefully from prior all time highs of 2,134.28 on the 21st of May, 2015, to 2,193.81 on the 15th of August, 2016. Extend it out. Daily charts are on a semi log scale.
The correction for intermediate wave (4) should end if price comes down to touch the purple trend line.
Intermediate wave (4) may not move into intermediate wave (1) price territory below 2,193.81.
At this stage, intermediate wave (4) has lasted 19 sessions. It does not look like it can complete in just another two sessions to total a Fibonacci 21. The next Fibonacci number in the sequence is 34, which would now see intermediate wave (4) continue for 15 sessions, but this looks to be too long. Intermediate wave (4) may not exhibit a Fibonacci duration and may end now in about another five or so sessions.
HOURLY CHART
Click chart to enlarge.
If the target calculated is wrong, it may be too low. Price may find strong support just above the target at the purple trend line. This line is copied over carefully from daily and weekly charts, which are both on semi log scales. This hourly chart is on an arithmetic scale, meaning the line will sit slightly differently. Both should be watched carefully.
Minor wave C must complete as a five wave structure. It is extremely likely to make at least a slight new low below the end of minor wave A at 2,233.62 to avoid a truncation and a very rare running flat.
The tentative green resistance line has been tested now three times, so it has slightly better technical significance today. If price moves down at the start of tomorrow’s session, then some confidence may be had in this line.
This wave count now expects to see an increase in downwards momentum and an increase in volatility as a small third wave down unfolds over the next few days.
TECHNICAL ANALYSIS
WEEKLY CHART
Click chart to enlarge. Chart courtesy of StockCharts.com.
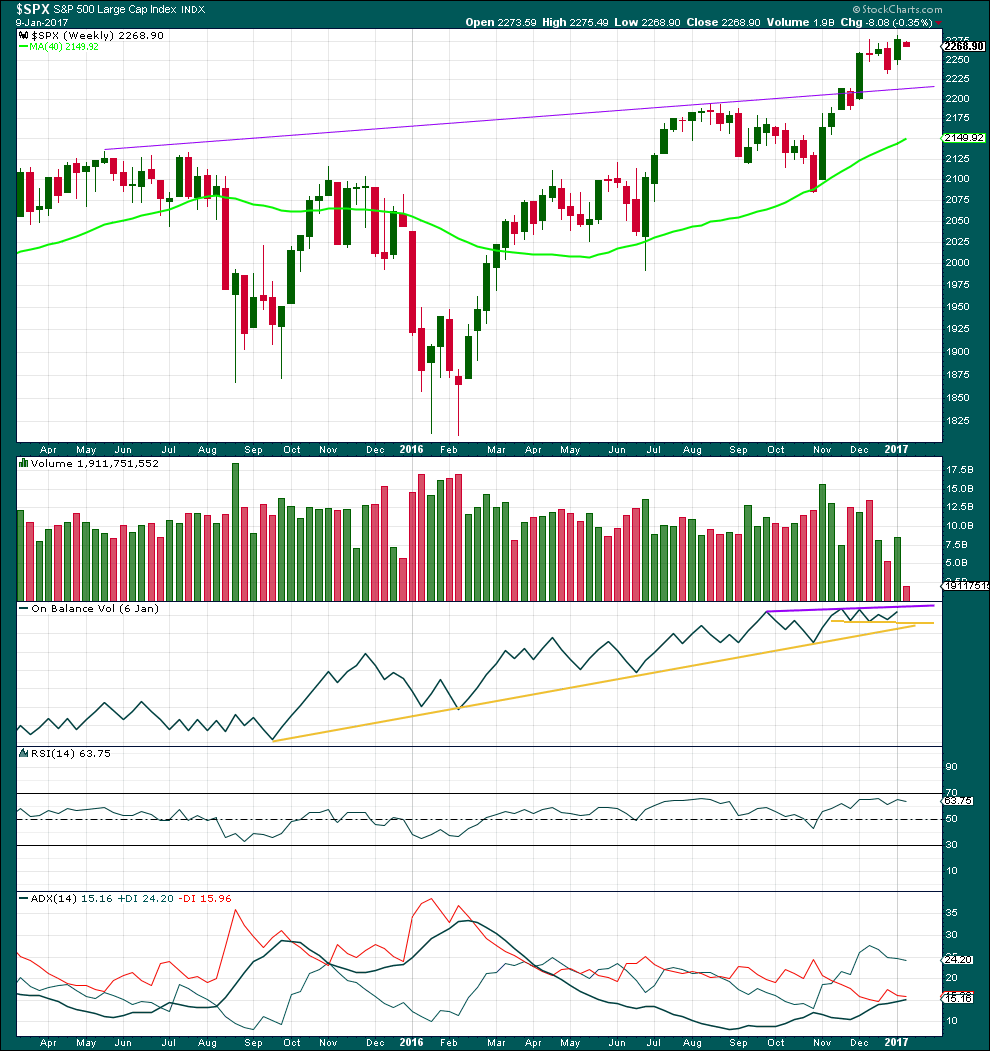
The last three complete weeks show lighter volume than the three weeks prior. This makes sense as a consolidation. Volume has an upwards bias and makes sense if the larger trend is still up.
On Balance Volume is still constrained below resistance and above support.
RSI is not extreme and still in bullish territory.
ADX indicates a new trend; it is above 15 and rising. The trend is up.
DAILY CHART
Click chart to enlarge. Chart courtesy of StockCharts.com.
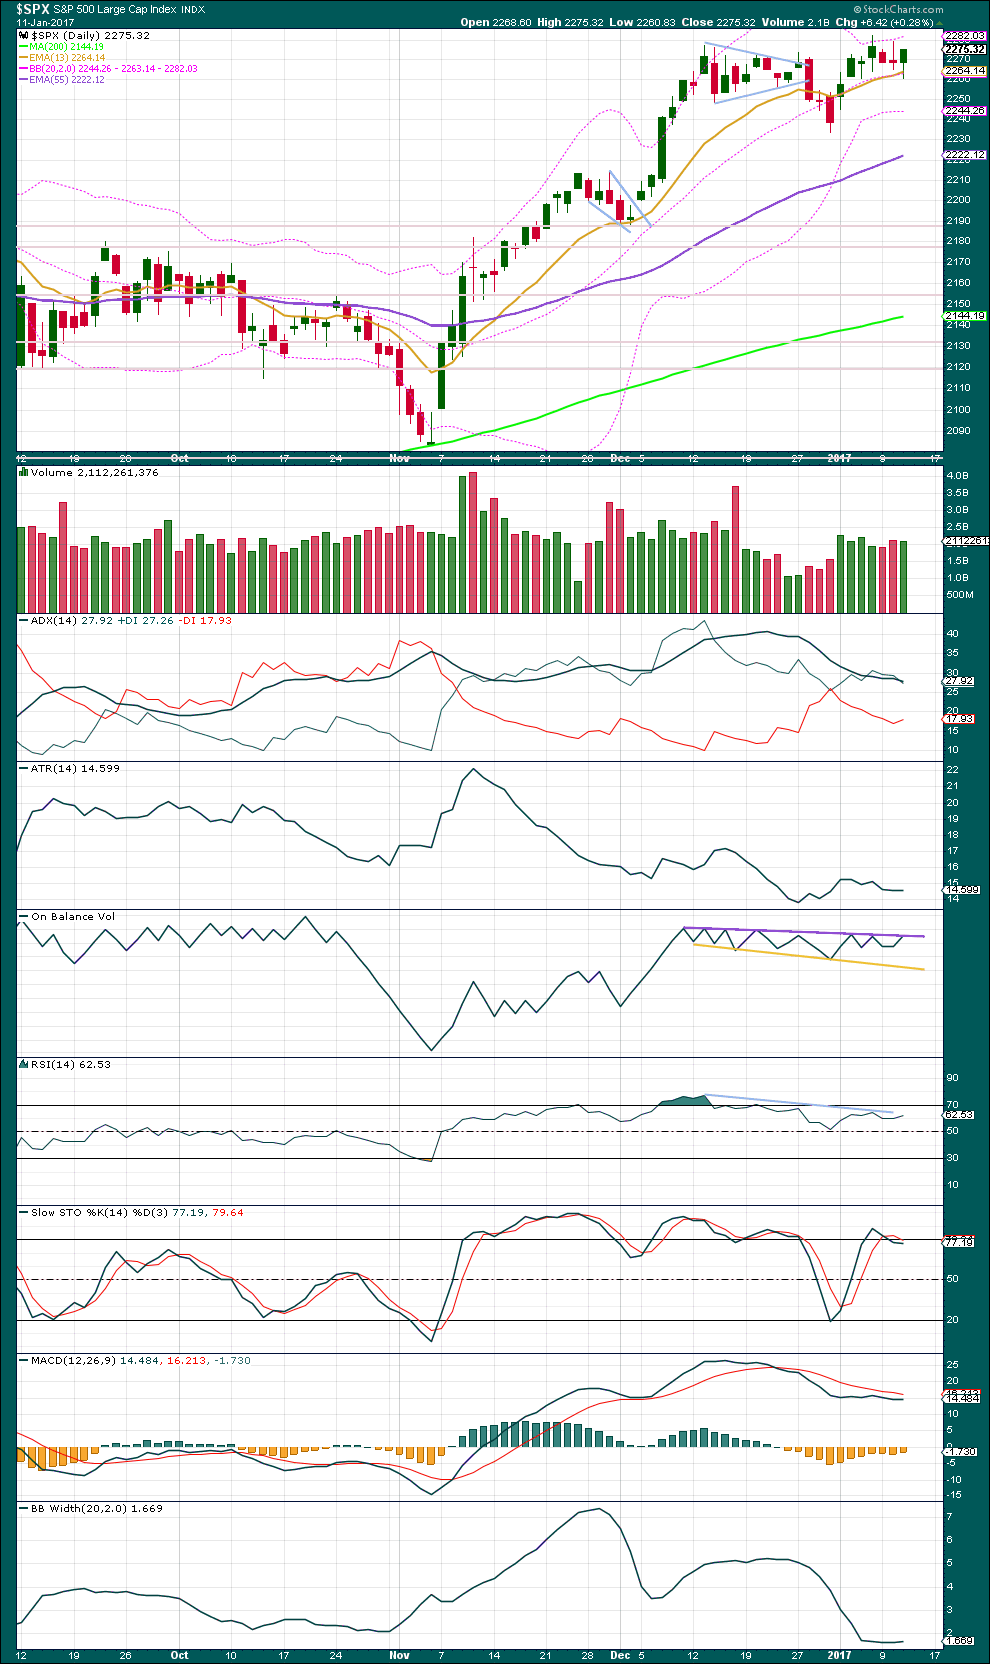
Price came with declining volume as it rose to the last high. This last rise in price from 30th of December to the 6th of January was not supported by volume, so it is suspicious. This supports the Elliott wave count, which sees this last high as the end of a B wave. B waves should have internal weakness; they should look “wrong”.
At this stage, price is finding support about the short term Fibonacci 13 day moving average and the mid line of Bollinger Bands.
Today’s session completed a green daily candlestick with a long lower wick; this is slightly bullish. However, it made a lower low and a lower high, the definition of downwards movement, yet the balance of volume for the session was upwards.
A slight decline in volume for the day where the balance was upwards indicates a lack of support for the rise in price during the session. This may be read as slightly bearish.
Sideways movement has brought ADX down from extreme. ADX is declining, indicating a consolidation is unfolding.
ATR is overall flat, also indicating a consolidation is unfolding.
On Balance Volume has reached resistance today. This purple trend line has strong technical significance and may assist to halt any further rise in price here. A breach above this line would be a strong bullish signal tomorrow, which would put the Elliott wave count in doubt for the short term.
There is strong divergence at the last high between price and RSI, MACD and Stochastics. This supports the Elliott wave count, which sees the last high as the end of a B wave.
Bollinger Bands are very tightly contracted. Look out for an imminent return to volatility for this market. The Elliott wave count expects a small third wave down and it may move quickly.
VOLATILITY – INVERTED VIX CHART
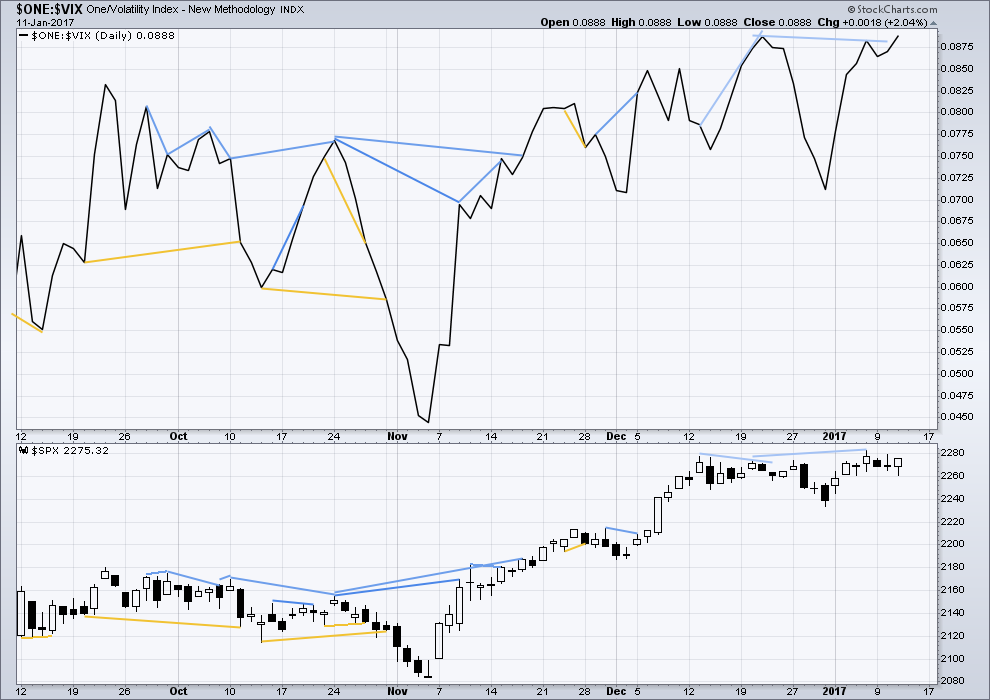
Click chart to enlarge. Chart courtesy of StockCharts.com.
There are a few instances of multi day divergence between price and inverted VIX noted here. Bearish divergence is blue. Bullish divergence is yellow. It appears so far that divergence between inverted VIX and price is mostly working to indicate short term movements spanning one or two days. While this seems to be working more often than not, it is not always working. As with everything in technical analysis, there is nothing that is certain. This is an exercise in probability.
VIX exhibits single day divergence with price today: inverted VIX moved higher while price made a lower low and lower high (the definition of downwards movement). So volatility declined as price moved lower, but this is opposite to the normal situation. However, not too much will be read into it as overall the balance of volume today was upwards and price moved mostly sideways. This divergence may be interpreted as bearish, but it will not be given much weight in this analysis.
BREADTH – AD LINE
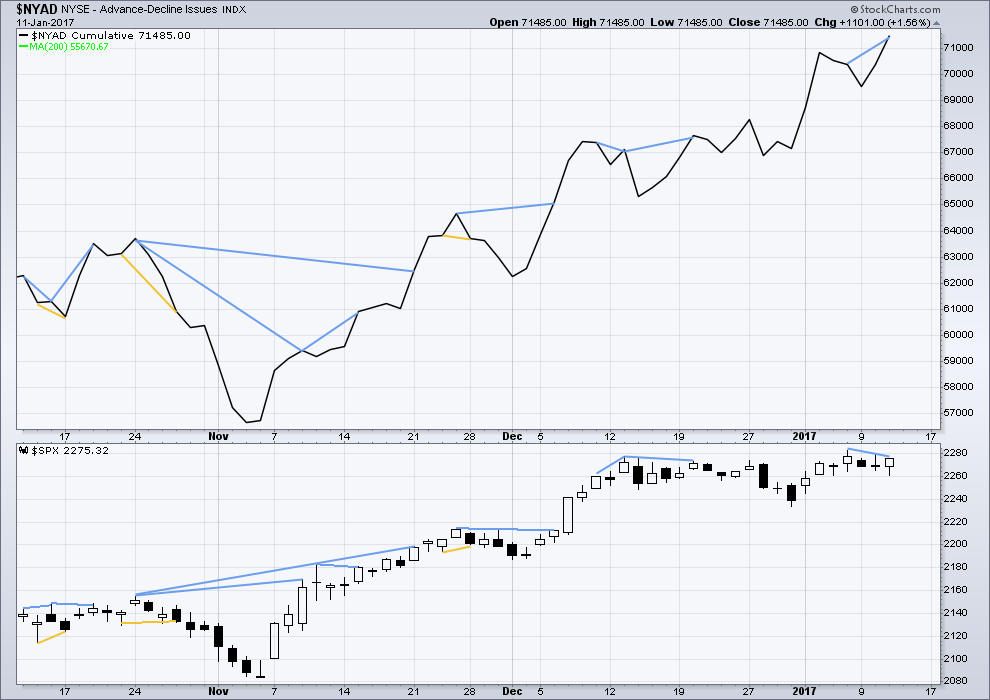
Click chart to enlarge. Chart courtesy of StockCharts.com.
Short term bullish and bearish divergence is again working between price and the AD line to show the direction for the following one or two days.
There is another instance of short term divergence today between price and the AD line: the AD line today made a new all time high beyond the last high three sessions ago, but price has not made a corresponding new high. This is hidden bearish divergence and indicates weakness in price. It may be followed by one or two sessions of downwards movement.
I subscribe to Lowry’s On Demand service to keep a track of the health of the market in terms of market breadth. They conclude that this bull market is strong and healthy, and is likely to continue for at least three or four months, if not substantially longer.
DOW THEORY
The DJIA, DJT, S&P500 and Nasdaq have made new all time highs in December of 2016. This confirms a bull market continues.
This analysis is published @ 08:31 p.m. EST.
Now we know the answer to Vern’s question from the last couple of weeks, “Why is IWM not making new highs along with SPX?”
It is because IWM is still leading the market. At this point it is leading the market in a correction. Note that today, IWM is down 1.8% compared to SPX 0.7% (11:30 AM EST). I suspect IWM will fall further and harder than SPX in this Intermediate (4) correction.
I also suspect when the correction is over, IWM will have a strong snap back rally once again leading the markets to regain the previous ATH and more. Because of this possibility, when I go long again, it will be using a leveraged ETF of IWM .
Once again, Lara makes a great call. In this case we had plenty of time to prepare for this correction. Now we look for the target turn around point of SPX ~2220.
Thank you Rodney 🙂
This correction is taking it’s time. We should have plenty of time to find our entry to go long.
Before today’s close, I have liquidated my long positions in my long term account. I netted a 1.7% gain in less than a week. It is a relatively small percentage gain. But the net value or dollars is relatively large. Thanks Lara et al.
I decided to do this because I am concerned the markets may have a bit further to go in this correction than the current target of 2211. Of course, I will reassess the situation when we get near that target.
So, in all accounts I am sitting tight waiting for more information and development.
Lara,
I also subscribe to Lowrys and use their Buying Power/Selling Pressure indicator as a reliable assessment of the primary trend of the market. It is complementary to other technical analysis tools and EW. Glad you are a subscriber as well and see its value. -Dan
Thanks Dan. They are really very good aren’t they.
When this market turns to bear I’ll be updating my subscription with Lowry’s to get their daily updates. Their power rating should be really helpful in picking when bear market rallies may begin, saving us all from seeing profitable trades turn to nothing.
I totally agree with you. They were bearish for most of 2016 (really since August of 2015), and now recently joined the bullish camp. I try to find either positive or negative divergences in their stock charts to look for ideas, but the Market Indicators (BP/SP, % of stocks above 10 DMA, % of stocks off 20%, etc.) are very helpful in identifying overall market trend.
PS: I am still learning EW and your explanations have been very helpful. Thank you.