
Yesterday’s analysis expected downwards movement, but this is not what happened.
Price stopped barely short of the invalidation point.
Summary: A correction down to about 2,120 and the lilac trend line is still expected this week. Use this as an opportunity to join the trend for a third wave up. Volume strongly supports the Elliott wave count. Manage risk because it is the single most important aspect of trading. Do not invest more than 3-5% of equity on any one trade and always use a stop.
Last monthly chart for the main wave count is here.
Last weekly chart is here.
New updates to this analysis are in bold.
MAIN WAVE COUNT
DAILY CHART
Click chart to enlarge.
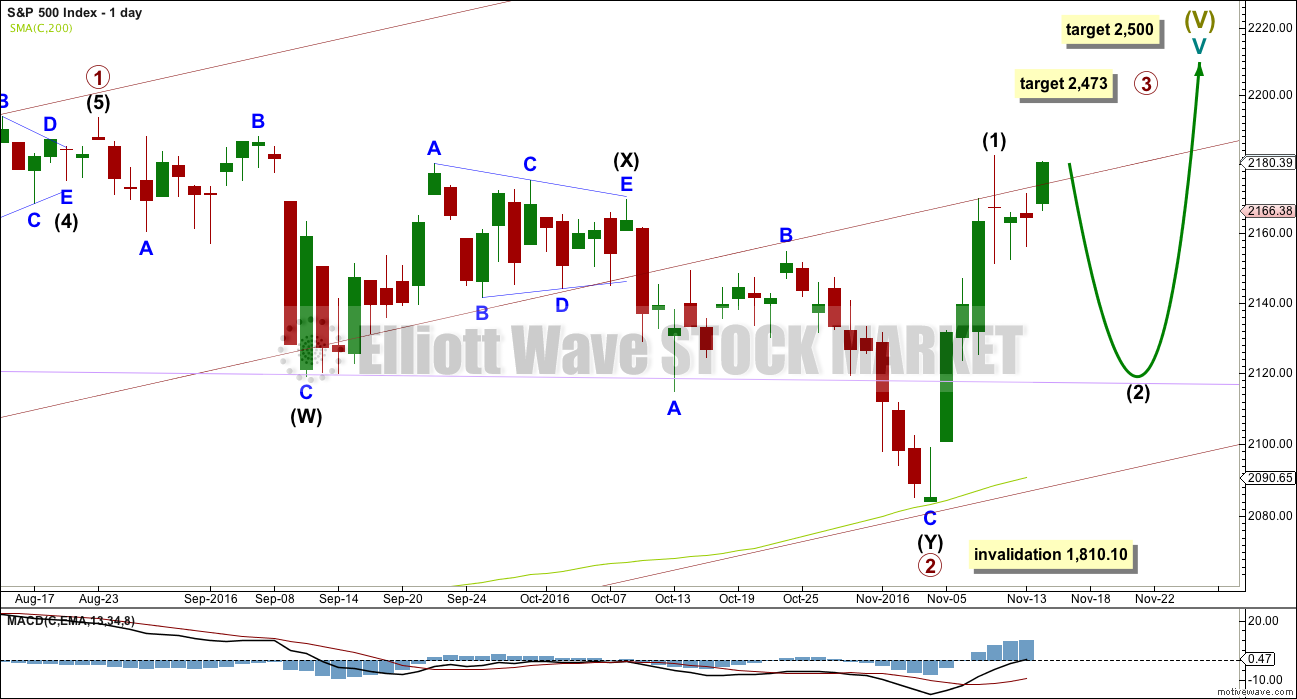
Primary wave 2 now looks to be complete as a double zigzag. Within primary wave 2: intermediate wave (W) was a very shallow zigzag lasting a Fibonacci 13 sessions; intermediate wave (X) fits perfectly as a triangle lasting 20 sessions, just one short of a Fibonacci 21; and intermediate wave (Y) also lasting 20 sessions deepens the correction achieving the purpose of a second zigzag in a double.
Primary wave 2 looks like it has ended at support about the lower edge of the maroon channel about primary wave 1, and at the 200 day moving average.
With upwards movement slicing cleanly through the lilac trend line, this behaviour looks to be more typical of an upwards trend. At this stage, corrections within primary wave 3 may be expected to turn down to test support at this trend line. While after hours movement did not find support there, the New York session did.
At 2,500 cycle wave V would reach equality in length with cycle wave I.
At 2,467 primary wave 3 would reach equality in length with primary wave 1. This is the ratio used in this instance because it fits with the higher target at 2,500.
Within primary wave 3, intermediate wave (1) may have ended at the last high. Intermediate wave (2) may turn price downwards to test support at the lilac trend line. It is typical of the S&P to show the subdivisions of its third waves clearly at higher time frames.
Primary wave 3 may show some strength compared to primary wave 1, but it does not have to. This wave count sees price in a final fifth wave at cycle degree, within a larger fifth wave at Super Cycle degree. The upcoming trend change may be at Grand Super Cycle degree, a once in generations trend change. This final fifth wave should be expected to exhibit great internal weakness; this market may appear broken. That would be typical behaviour for a final fifth wave of this magnitude.
HOURLY CHART
Click chart to enlarge.
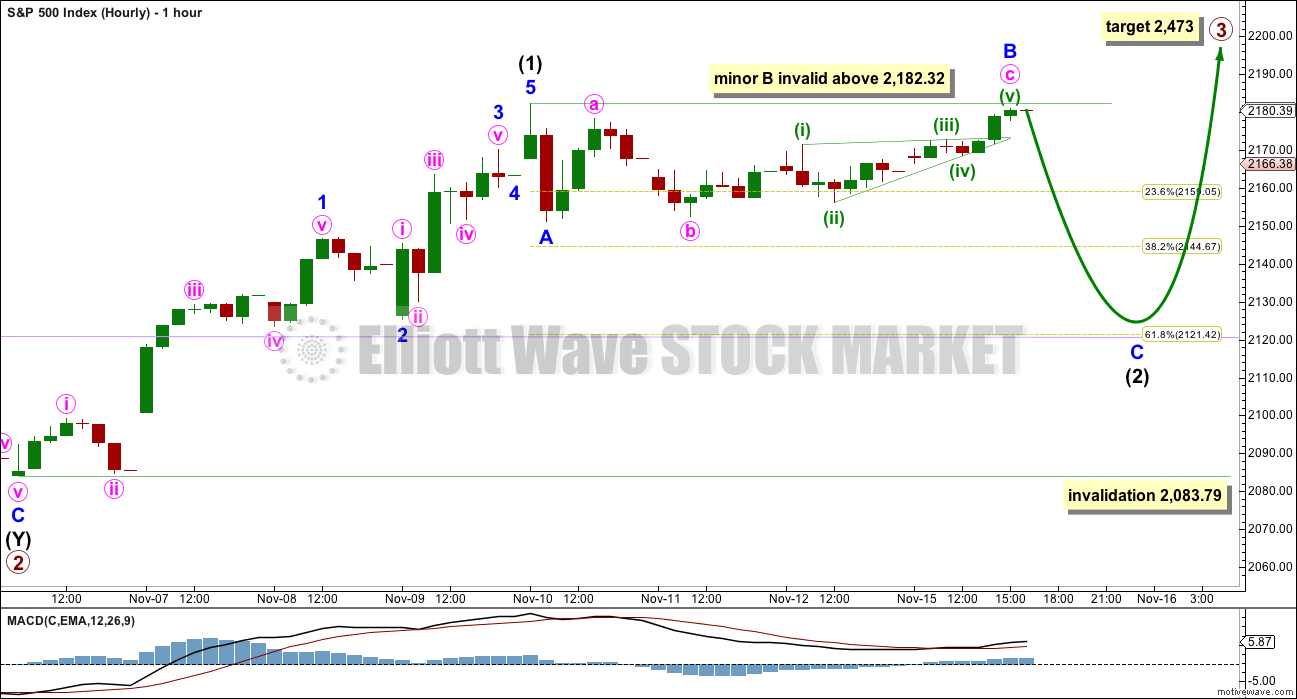
Intermediate wave (1) may have ended at the last high.
Intermediate wave (2) would most likely end about the 0.618 Fibonacci ratio of intermediate wave (1) at 2,121. This is close to the lilac trend line.
Within intermediate wave (2), minor wave B may be incomplete. It may move either higher or sideways. If minor wave A is correctly analysed as a five wave impulse (this is what it looks like on the five minute chart), then minor wave B may not move beyond its start above 2,182.32.
Minor wave B has moved higher. It did not unfold as a triangle and now looks like a zigzag. Minute wave c fits as an ending contracting diagonal, a close relative of triangles. The only thing which looks a little odd about it is the large overshoot of the (i)-(iii) trend line. Normally, the fifth wave only slightly overshoots this trend line.
Intermediate wave (2) may not move beyond the start of intermediate wave (1) below 2,083.79.
Intermediate wave (1) lasted four days. Intermediate wave (2) has so far lasted three days and may continue to total a Fibonacci five or eight days. All of these options would still give the wave count a good look in terms of proportion.
If price makes a new high above 2,182.32 tomorrow, before a downwards wave, then my analysis of minor wave A as a five is wrong. There would be two options at that stage: either intermediate wave (2) was over at the low as a quick shallow zigzag labelled minor wave A, or intermediate wave (2) is continuing further as a flat correction. The second option is more likely.
TECHNICAL ANALYSIS
WEEKLY CHART
Click chart to enlarge. Chart courtesy of StockCharts.com.
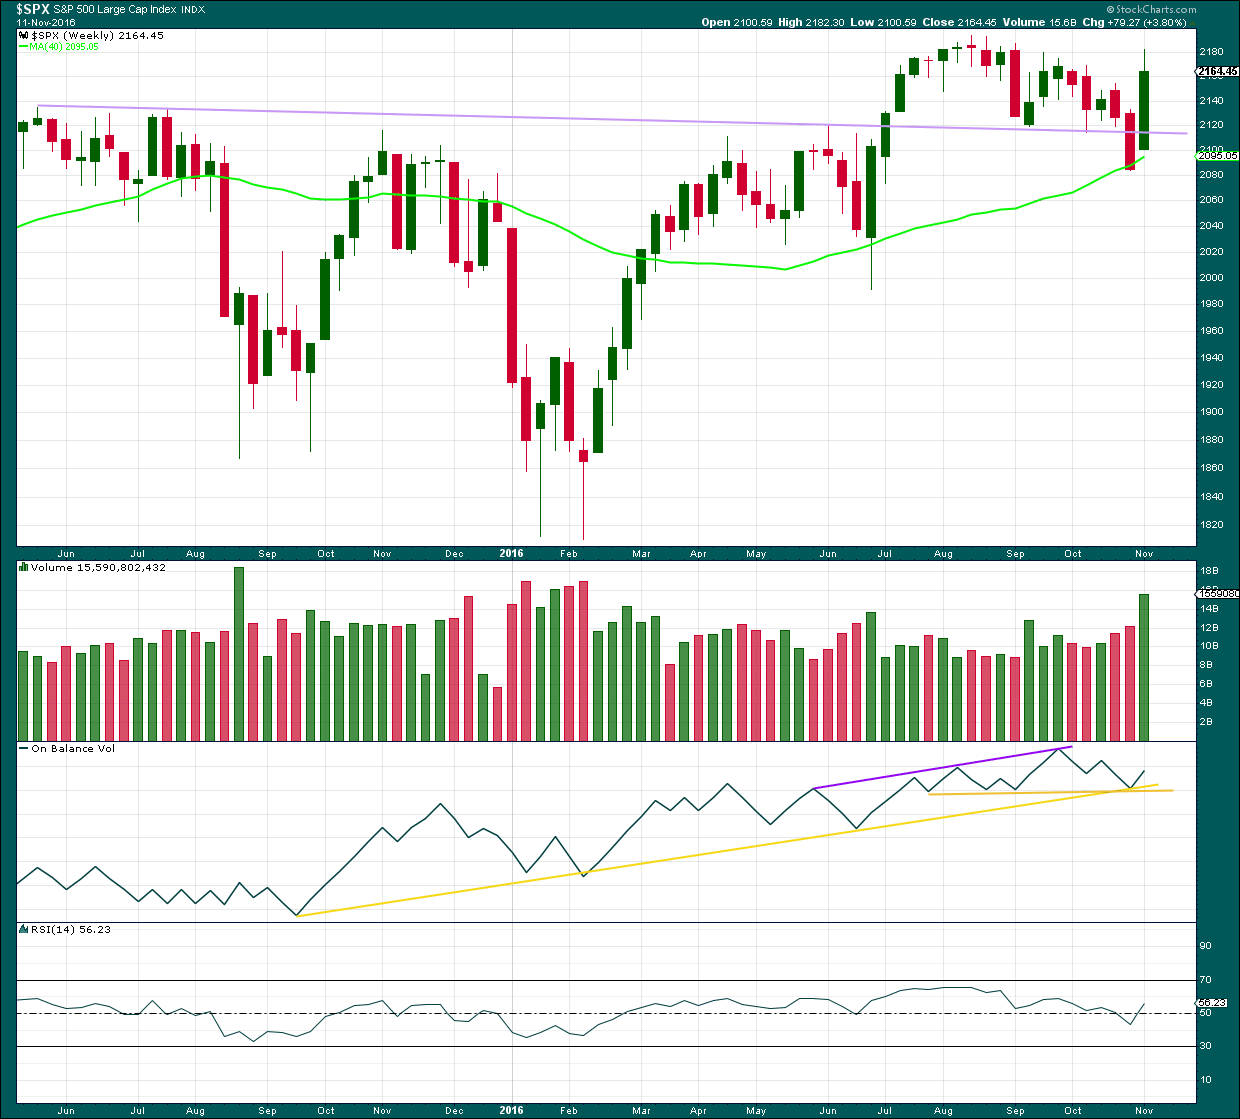
A break back up above the lilac trend line is very bullish. This line is now weakened because of the break, but it should still be expected to provide some support if price turns down a little.
Price has found support at the 40 week / 200 day moving average.
Upwards movement last week has strong support from volume. This supports the Elliott wave count.
On Balance Volume found support at the two yellow trend lines. This also supports the Elliott wave count.
RSI is not extreme, so there is room for price to rise further.
DAILY CHART
Click chart to enlarge. Chart courtesy of StockCharts.com.
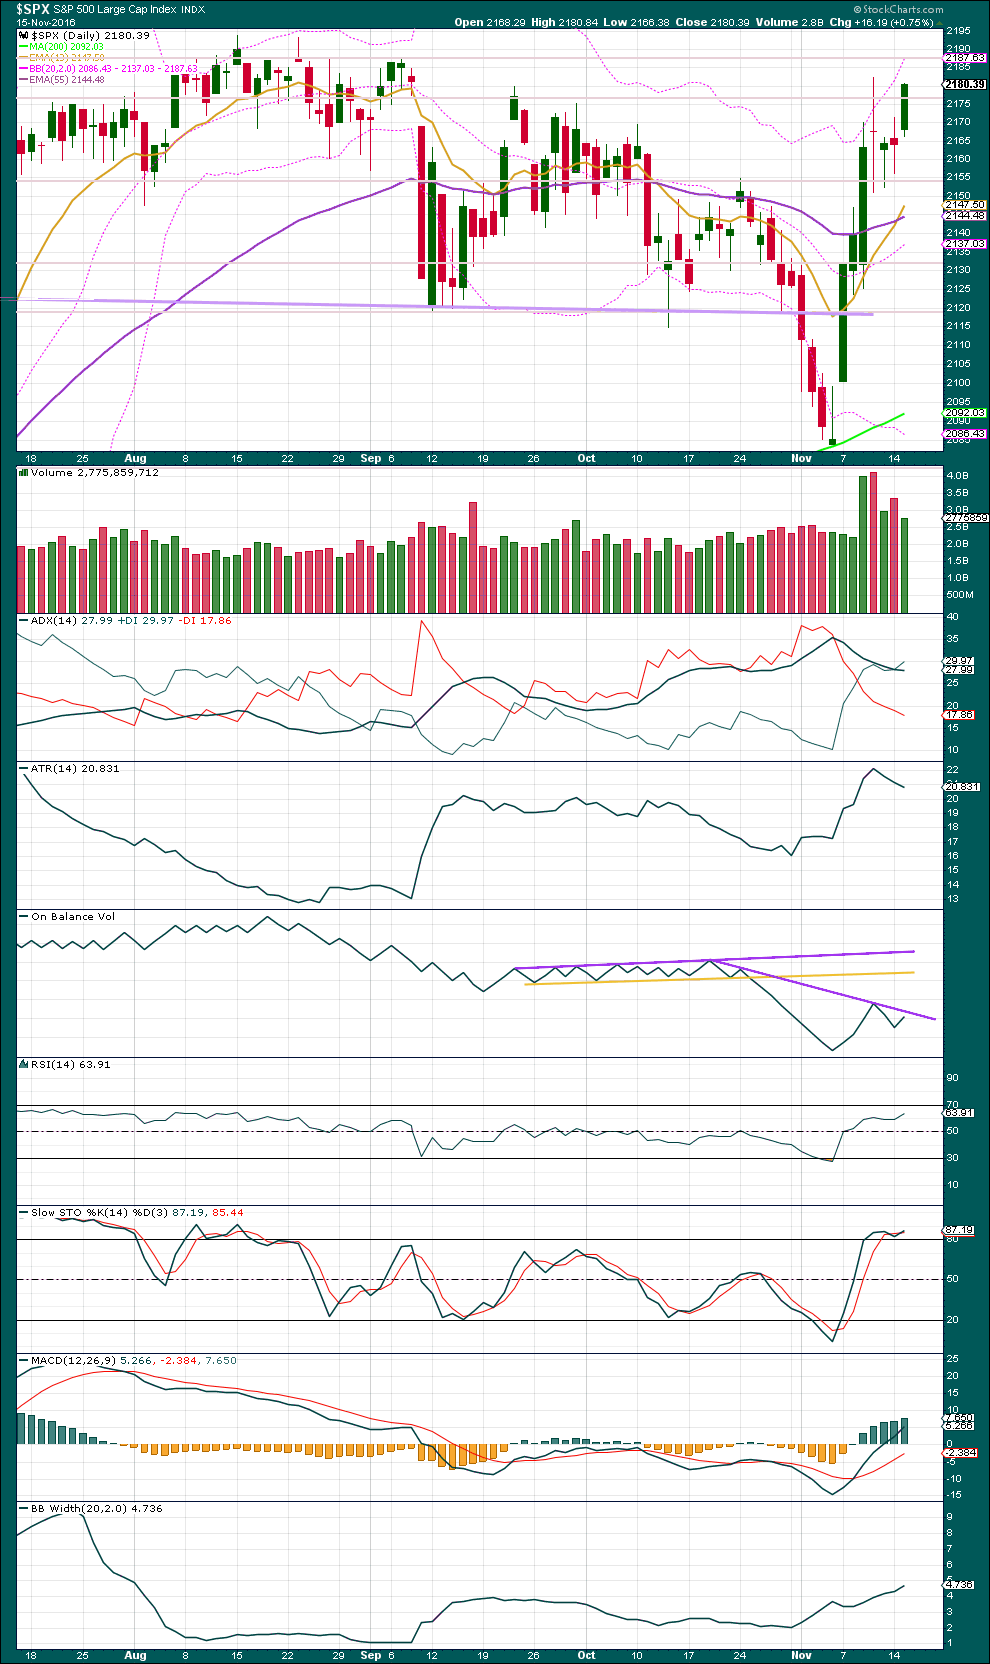
An upwards session comes with a further decline in volume. This upwards movement looks like part of a small consolidation and not a new upwards trend.
On Balance Volume may find some resistance initially here at the downwards sloping purple trend line. This may halt the rise in price here.
ADX continues to decline as does ATR. The market is not trending at this time. Bollinger Bands disagree though as they continue to slowly widen.
There is some small short term divergence with RSI and price today: RSI has made a slight new high above the prior point of the 10th of November, but price has not. This is hidden bearish divergence and indicates weakness today to the upwards movement from price. One or two downwards days may result.
MACD is bullish. The larger trend looks likely to be upwards.
The short term moving average today crossed above the mid term average. All three averages are pointing upwards. The larger trend is up.
VOLATILITY – INVERTED VIX CHART
Click chart to enlarge. Chart courtesy of StockCharts.com.
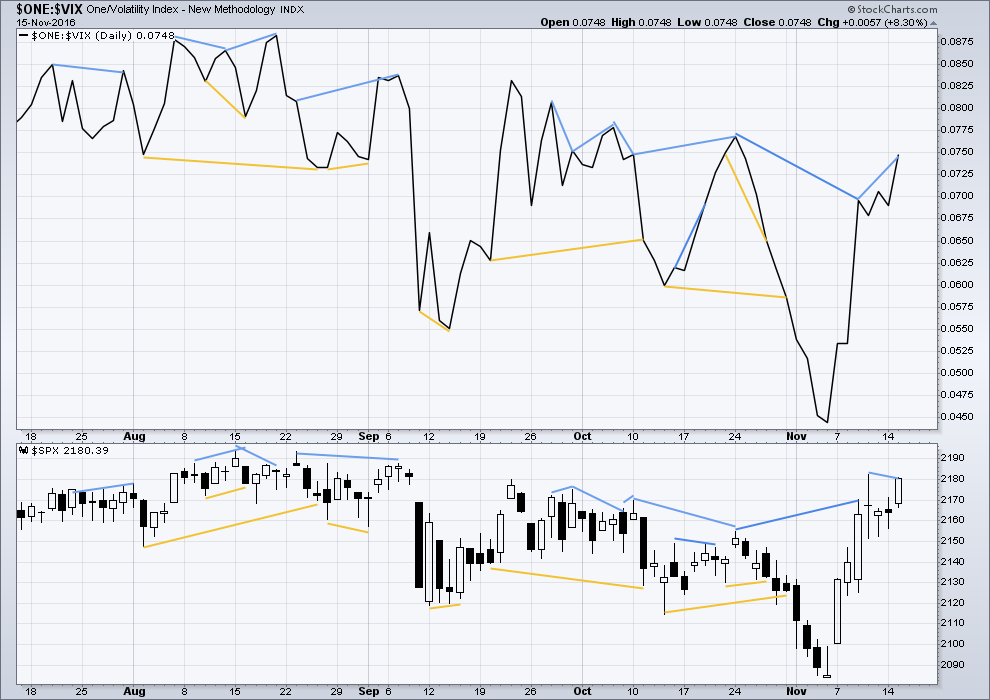
There are a few instances of multi day divergence between price and inverted VIX noted here. Bearish divergence is blue. Bullish divergence is yellow. It appears so far that divergence between inverted VIX and price is again working to indicate short term movements spanning one or two days. While this seems to be working more often than not, it is not always working. As with everything in technical analysis, there is nothing that is certain. This is an exercise in probability.
There is still some hidden bearish divergence between price and inverted VIX: inverted VIX has made a reasonable new high this week, but price has not. This indicates weakness today to upwards movement from price. This divergence may be followed by one or two days of downwards movement. It will only be considered to have failed if price makes a new high above the prior high of the 10th of November.
BREADTH – AD LINE
Click chart to enlarge. Chart courtesy of StockCharts.com.
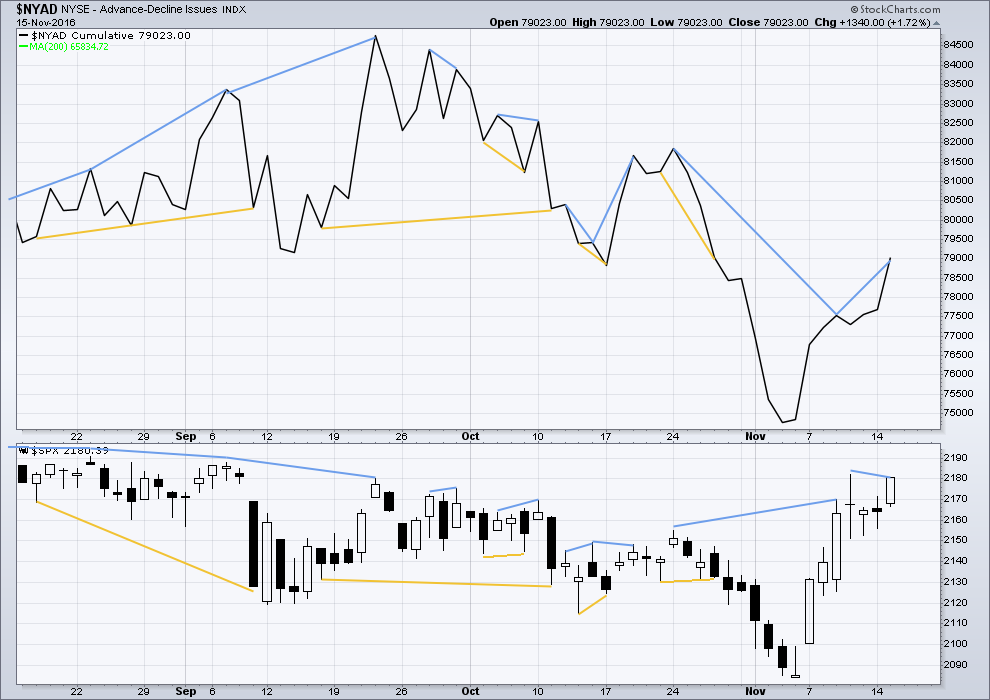
Short term bullish and bearish divergence is again working between price and the AD line to show the direction for the following one or two days.
There is still hidden bearish divergence between price and the AD line: the AD line has this week made a new high, but price has not made a new high above the prior high of the 10th of November. This indicates weakness in upwards movement from price. It may be followed by one or two days of downwards movement. This divergence will only be considered to have failed if price makes a new high tomorrow.
BREADTH – MCCLELLAN OSCILLATOR
Click chart to enlarge. Chart courtesy of StockCharts.com.
The McClellan Oscillator is now extreme (below 60). On its own this is not an indicator of a low, but it is a warning that this market is oversold. The McClellan Oscillator today is at -73.44.
On the 21st August, 2015, the McClellan Oscillator reached a similar point of -71.56. Price found a low the next session, 104 points below the closing price of the 21st August. This very extreme reading for the 24th August would have been a strong indicator of a low in place.
On the 11th December, 2015, the McClellan Oscillator reached -80.82. It moved lower the next session to -92.65 and price moved 19 points lower. The extreme reading of 11th December might possibly have led to an expectation of a bigger bounce than the one that occurred, and might have misled analysis into missing the strong fall from 29th December to 20th of January.
The next most recent occasion where this oscillator was extreme was the 8th January, 2016. It reached -66.25 on that date. The low was not found for seven sessions though, on the 20th January 2016, almost 110 points below the closing price of the 8th January. At the low of the 11th February, there was strong bullish divergence with price making new lows and the oscillator making substantially higher lows. This may have been a strong warning of a major low in place.
The most recent occasion of an extreme reading was -75.05 on the 2nd of November. The last low came two days later.
As an indicator of a low this is not it. It is a warning of extreme levels. The next thing to look for would be some divergence with price and this oscillator at lows. Divergence is not always seen at lows, but when it is seen it should be taken seriously. Any reading over 100 should also be taken very seriously.
This indicator will be approached with caution. It is one more piece of evidence to take into account.
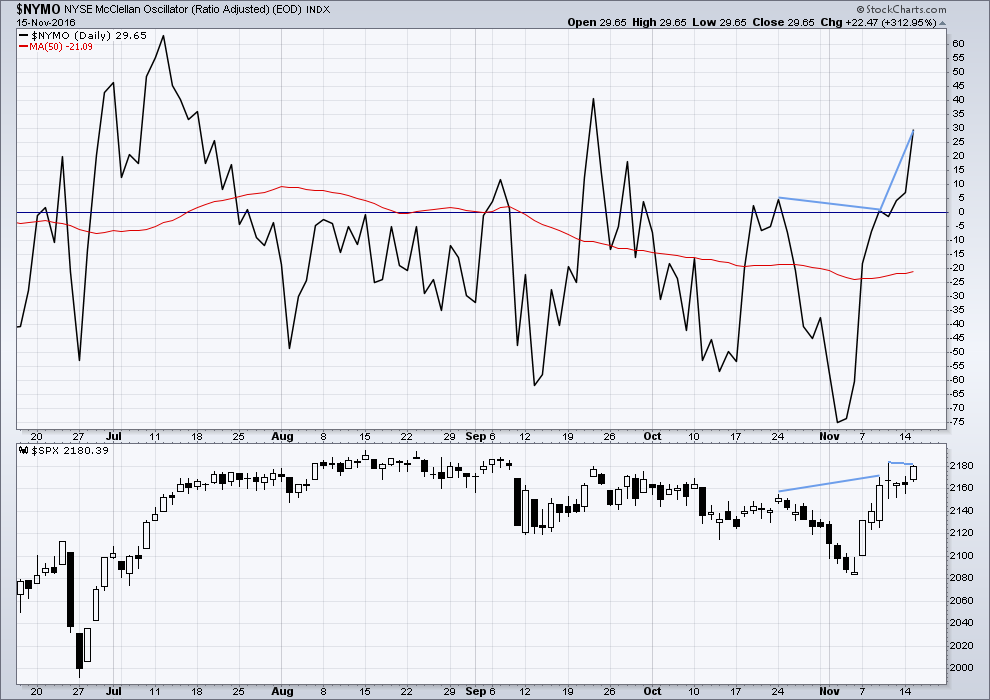
There is still short term hidden bearish divergence between price and the McClellan Oscillator this week. While the McClellan Oscillator has made a substantial new high price has not. This indicates weakness in upwards movement from price and may be followed by one or two days of downwards movement. It will only be considered to have failed if price makes a new high tomorrow.
The McClellan Oscillator is not extreme. There is plenty of room for price to rise.
DOW THEORY
Major lows within the old bull market:
DJIA: 15,855.12 (15th October, 2014) – closed below on 25th August, 2015.
DJT: 7,700.49 (12th October, 2014) – closed below on 24th August, 2015.
S&P500: 1,821.61 (15th October, 2014) – has not closed below this point yet.
Nasdaq: 4,117.84 (15th October, 2014) – has not closed below this point yet.
Major highs within the bear market from November 2014:
DJIA: 17,977.85 (4th November, 2015) – closed above on 18th April, 2016.
DJT: 8,358.20 (20th November, 2015) – closed above this point on the 9th of November, 2016.
S&P500: 2,116.48 (3rd November, 2015) – closed above this point on 8th June, 2016.
Nasdaq: 5,176.77 (2nd December, 2015) – closed above this point on 1st August, 2016.
Dow Theory Conclusion: The transportations indicate an end to the prior bear market. The transportation index confirms a bull market.
This analysis is published @ 11:19 p.m. EST.
A small red doji makes no change to the analysis today.
I am back from visiting Chicagoland (my home town area) and burying my 58 year old sister-in-law. Tough weekend.
This morning, in my short term trading account, I liquidated all my long positions. I had a very large position of URTY which is 3X long on RUT (IWM). I made roughly 16.85%. Will look to accumulate the same positions around 2125 SPX.
My long term account is still 100% long. That may change this afternoon.
Why am I doing this? Or, What caused me to sell my longs? The Bollinger Bands. RUT has been above the upper BB on the daily charts for 3 consecutive days. There is a high probability it will ‘Revert to Mean’. In addition, the MACD histogram has flattened out on RUT and SPX daily. Finally, Lara’s count is calling for a relatively sizable ‘c’ wave down.
So I am taking the profits and running. Looking to reload in a couple of weeks depending on how things look at the time.
Have a great day all.
I should have also mentioned RUT is well above its BB on the weekly. This is unsustainable longer term.
I made the decision already. Long term account moving to 100% cash for a very small profit.
Medium term account has been in cash all along.
By the way, I want to mention, many of us are focused only on profits and I certainly understand that focus. However, up until recently, Lara’s analysis and counts have keep my long and mid term accounts in cash since May 2015. I may not have made profits, but at many points I was saved from a lot of potential loses. This is as important to me as it is to make profits. This fact alone has made the subscription price well worth it.
Thanks Lara!
Rodney,
Thanks for sharing what you are doing. I have scaled my longs but still 60% long, 20% cash and 20% short (as a hedge). Depending on what markets do today, I might scale some more. But we are also in seasonally strong period now.
Welcome back Rodney, and thank you very much for the outline of your trading strategy today.
I have a small short on DJIA following Verne’s note that it was at the upper edge of it’s Bollinger Bands a couple of days ago. I’m holding that for a short term profit, to take if it has a strong downwards day.
I have a short on Oil, and may do another day trade today to make some $$ today.
That’s all I have ATM.
Looking at NZDUSD I see an interesting trend line break, but the set up to go short may be a couple of weeks away there. I’m waiting patiently for that one.
EURUSD also is breaching trend lines again, but with about 6 days down now it’s due for a bounce.