
A little more downwards movement was expected to 2,076.
The downwards trend was judged to be weak on Friday. Monday has seen a very strong upwards day, with no new low at the beginning of the session.
Summary: The short term target is at 2,139.50 for tomorrow. Thereafter, a second wave correction should move price lower. Look for strong support at the lilac trend line. If that line is breached, then the alternate wave count will increase in probability. A new high above 2,154.79 would provide strong price confirmation of a bull market, whereas a new low below 1,810.10 is still required to confirm a large bear market.
Last monthly chart for the main wave count is here.
Last weekly chart is here.
New updates to this analysis are in bold.
MAIN WAVE COUNT
DAILY CHART
Click chart to enlarge.
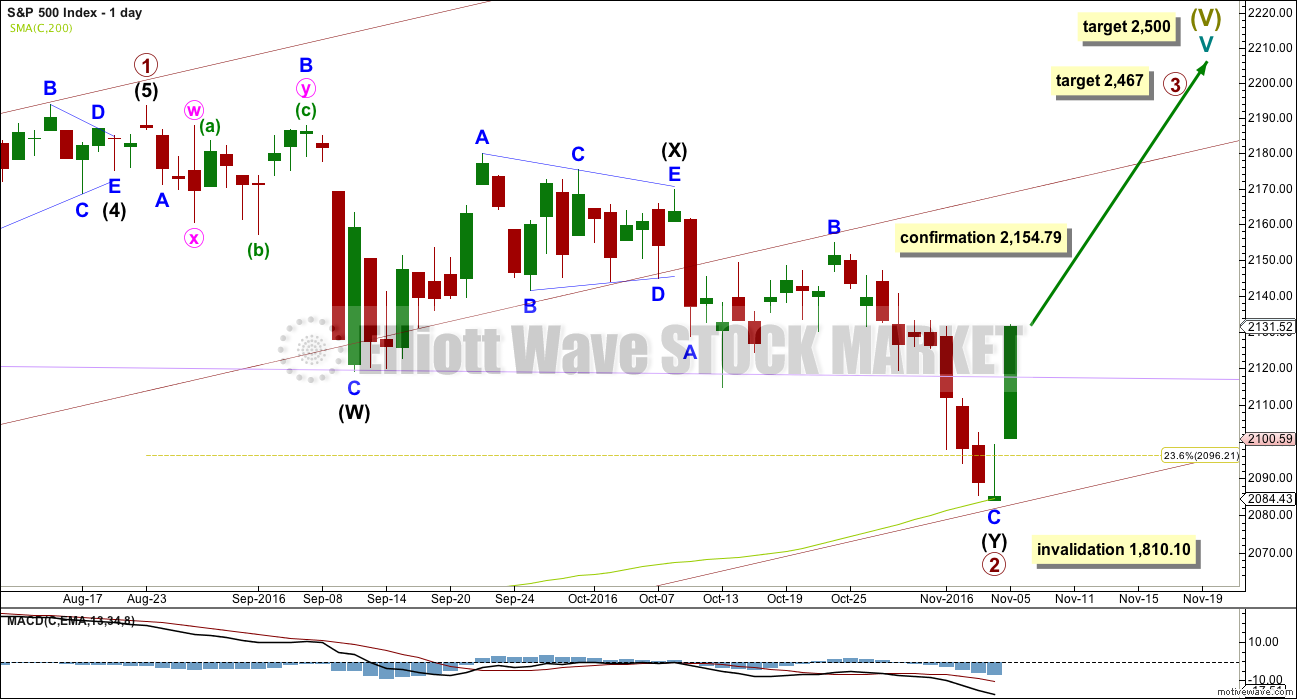
Primary wave 2 now looks to be complete as a double zigzag. Within primary wave 2: intermediate wave (W) was a very shallow zigzag lasting a Fibonacci 13 sessions; intermediate wave (X) fits perfectly as a triangle lasting 20 sessions, just one short of a Fibonacci 21; and intermediate wave (Y) also lasting 20 sessions deepens the correction achieving the purpose of a second zigzag in a double.
Primary wave 2 looks like it has ended at support about the lower edge of the maroon channel about primary wave 1, and at the 200 day moving average.
With upwards movement today slicing cleanly through the lilac trend line, this behaviour looks to be more typical of an upwards trend. At this stage, corrections within primary wave 3 may be expected to turn down to test support at this trend line.
At 2,500 cycle wave V would reach equality in length with cycle wave I.
At 2,467 primary wave 3 would reach equality in length with primary wave 1. This is the ratio used in this instance because it fits with the higher target at 2,500.
Primary wave 3 may show some strength compared to primary wave 1, but it does not have to. This wave count sees price in a final fifth wave at cycle degree, within a larger fifth wave at Super Cycle degree. The upcoming trend change may be at Grand Super Cycle degree, a once in generations trend change. This final fifth should be expected to exhibit great internal weakness; this market may appear broken. That would be typical behaviour for a final fifth wave of this magnitude.
HOURLY CHART
Click chart to enlarge.
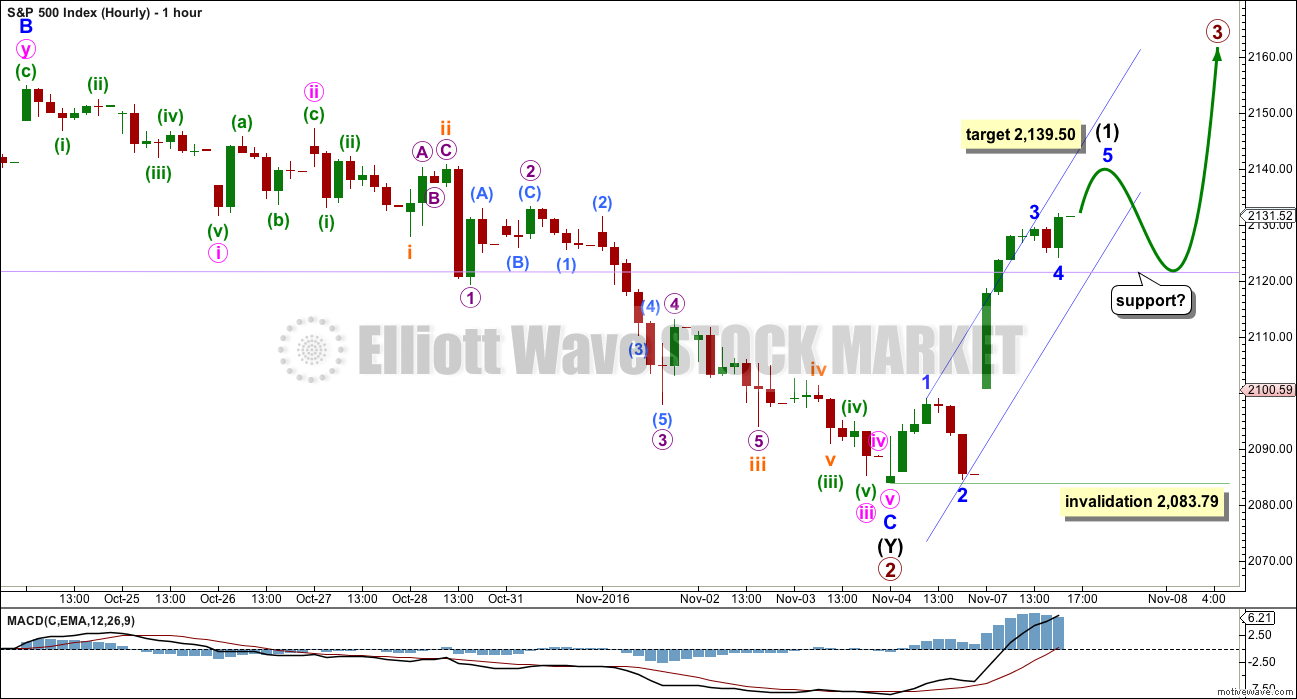
Minor wave C ended with brief shallow fourth wave corrections and short fifth waves.
A five wave structure upwards may be very close to completion. This may be intermediate wave (1), or the degree of labelling within this upwards movement may need to be moved down one degree to minor.
The invalidation point is at the same place no matter what degree of labelling is used. Intermediate wave (2) to come may not move beyond the start of intermediate wave (1) below 2,083.79.
There is no Fibonacci ratio between minor waves 3 and 1. At 2,139.50 minor wave 5 would reach equality in length with minor wave 1. This is the most common ratio for a fifth wave to exhibit, so this target has a reasonable probability.
Intermediate wave (2) may be relatively shallow if it finds support about the lilac trend line. It would be typical behaviour of price to turn down to test support after breaking through this line.
The narrow channel about intermediate wave (1) is too steep to have any reasonable technical significance. If it is breached by downwards movement, then it would indicate an end to intermediate wave (1) and the start of intermediate wave (2).
If price does find support at the lilac trend line, then it may offer an opportunity to join an upwards trend. However, it is essential that stops are used. The risk is that the alternate wave count may still be correct, so this risk must be accepted.
ALTERNATE WAVE COUNT
DAILY CHART
Click chart to enlarge.
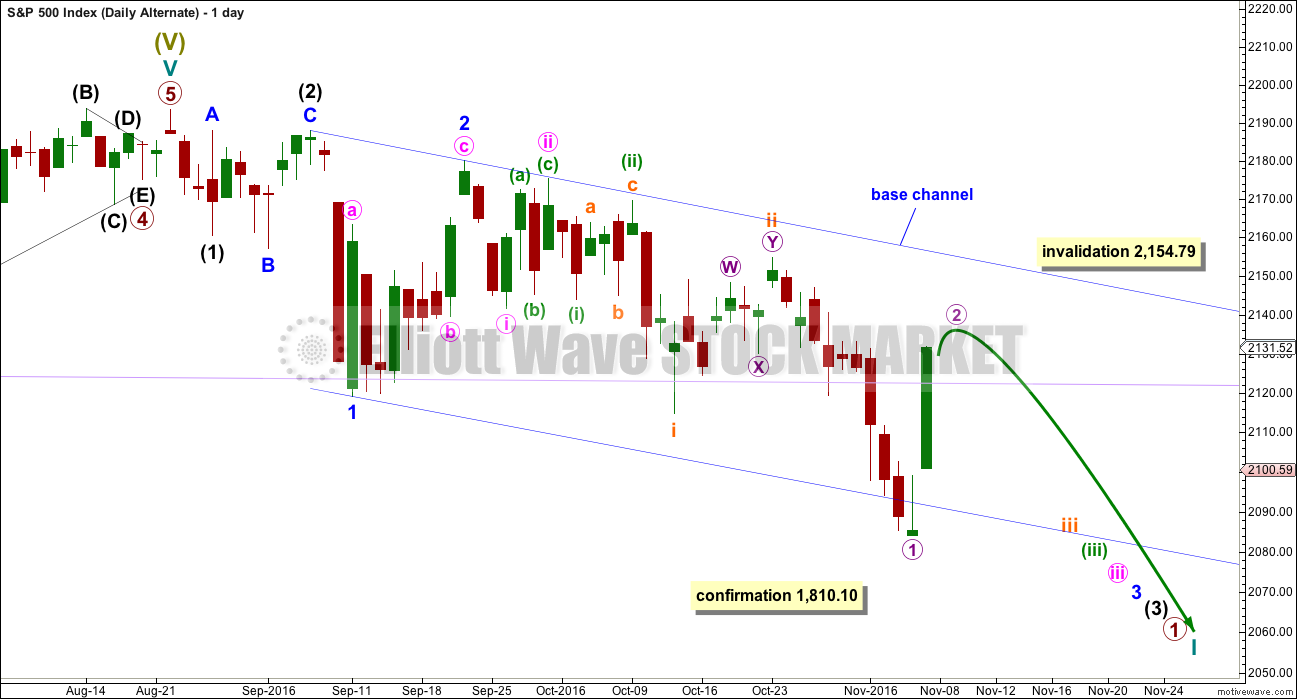
What if this downwards movement is the start of something even bigger?
This wave count expects that a new bear market to span several years and take price substantially below 666.76 has begun. For such a huge call it absolutely requires price confirmation below 1,810.10.
If a new bear market has begun, then the degree of labelling within the last impulse upwards is simply moved up one degree.
Downwards movement from the all time high may be a series of overlapping first and second waves. What looks like an obvious triangle must be ignored for this wave count. This is problematic, and it reduces the probability of this wave count. But this is a viable wave count.
The dark blue channel is a base channel about minor waves 1 and 2. Minor wave 3 should have the power to break through the lower edge of the base channel. The middle of minor wave 3 would not yet have passed for this wave count because price remains within the base channel.
The degree of labelling within the last impulse down is moved down one degree. Another first and second wave correction may be completing at micro degree. There may now be six overlapping first and second waves. This wave count now expects to see an imminent explosion to the downside.
At the hourly chart level, micro wave 2 is incomplete and should move higher. It should find very strong resistance at the upper edge of the dark blue base channel. Any breach of the upper edge of this channel would substantially reduce the probability of this wave count.
Micro wave 2 may not move beyond the start of micro wave 1 above 2,154.79.
TECHNICAL ANALYSIS
WEEKLY CHART
Click chart to enlarge. Chart courtesy of StockCharts.com.
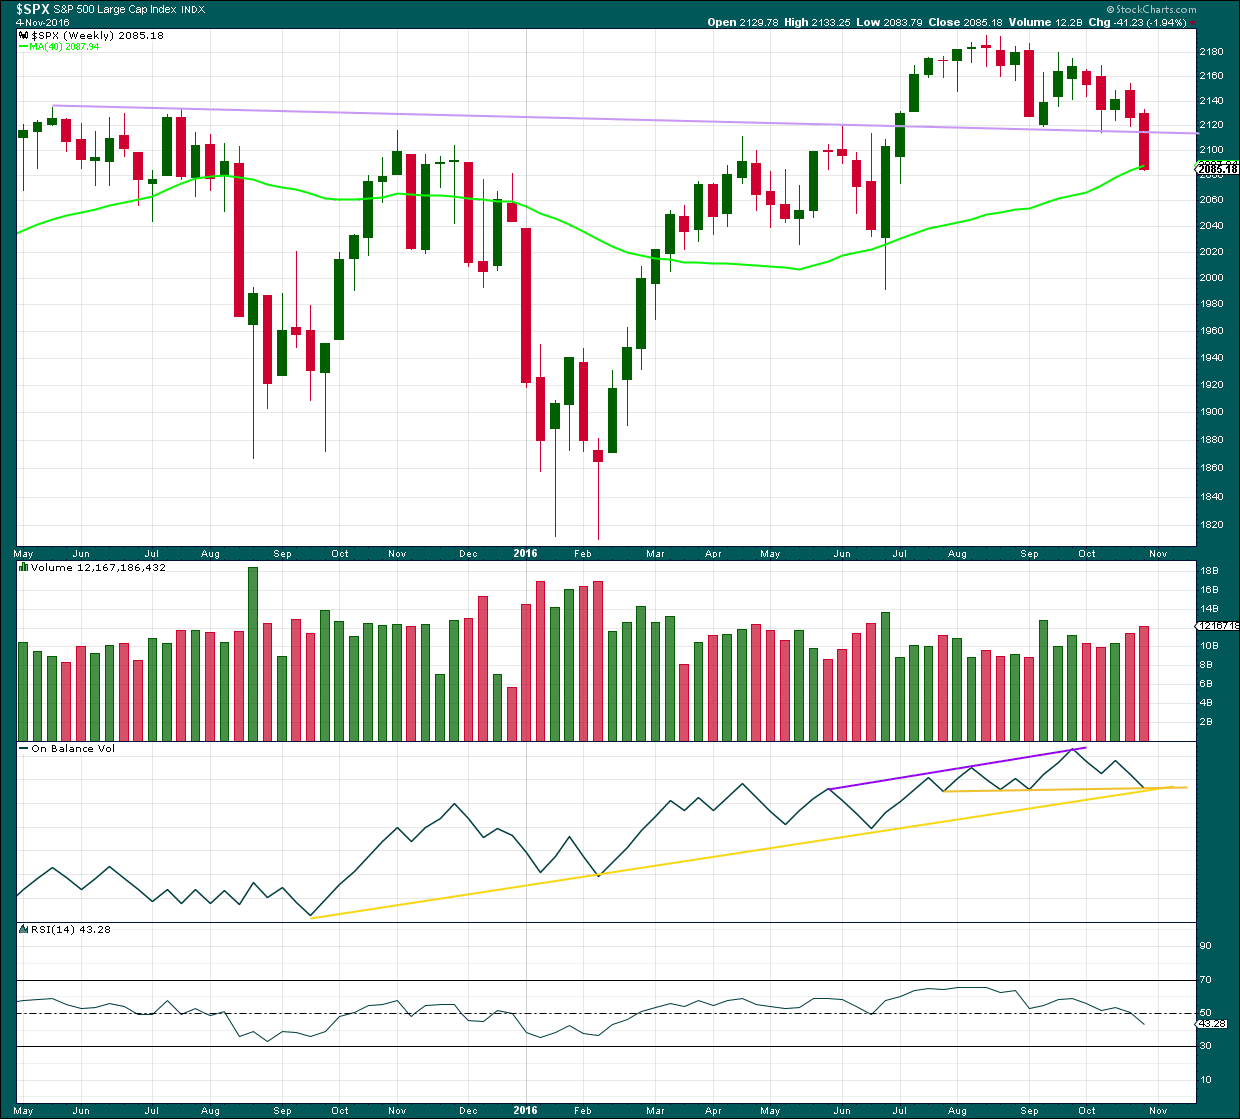
A strong downwards week breaking and closing well below the lilac trend line is a strong bearish signal. After a trend line breach, it would be typical to see price turn upwards and test resistance at the line.
There is strong support for price here from the 40 week (200 day) moving average. There is strong support for On Balance Volume here by both yellow lines. This suggests price may bounce early next week.
How high the bounce goes is going to tell us which Elliott wave count is correct. From a classic technical analysis point of view a breach back above the lilac line would be very bullish. If that happens, then new all time highs may be expected. But if the lilac line remains intact and provides strong resistance, then the possibility of a bear market would increase.
DAILY CHART
Click chart to enlarge. Chart courtesy of StockCharts.com.
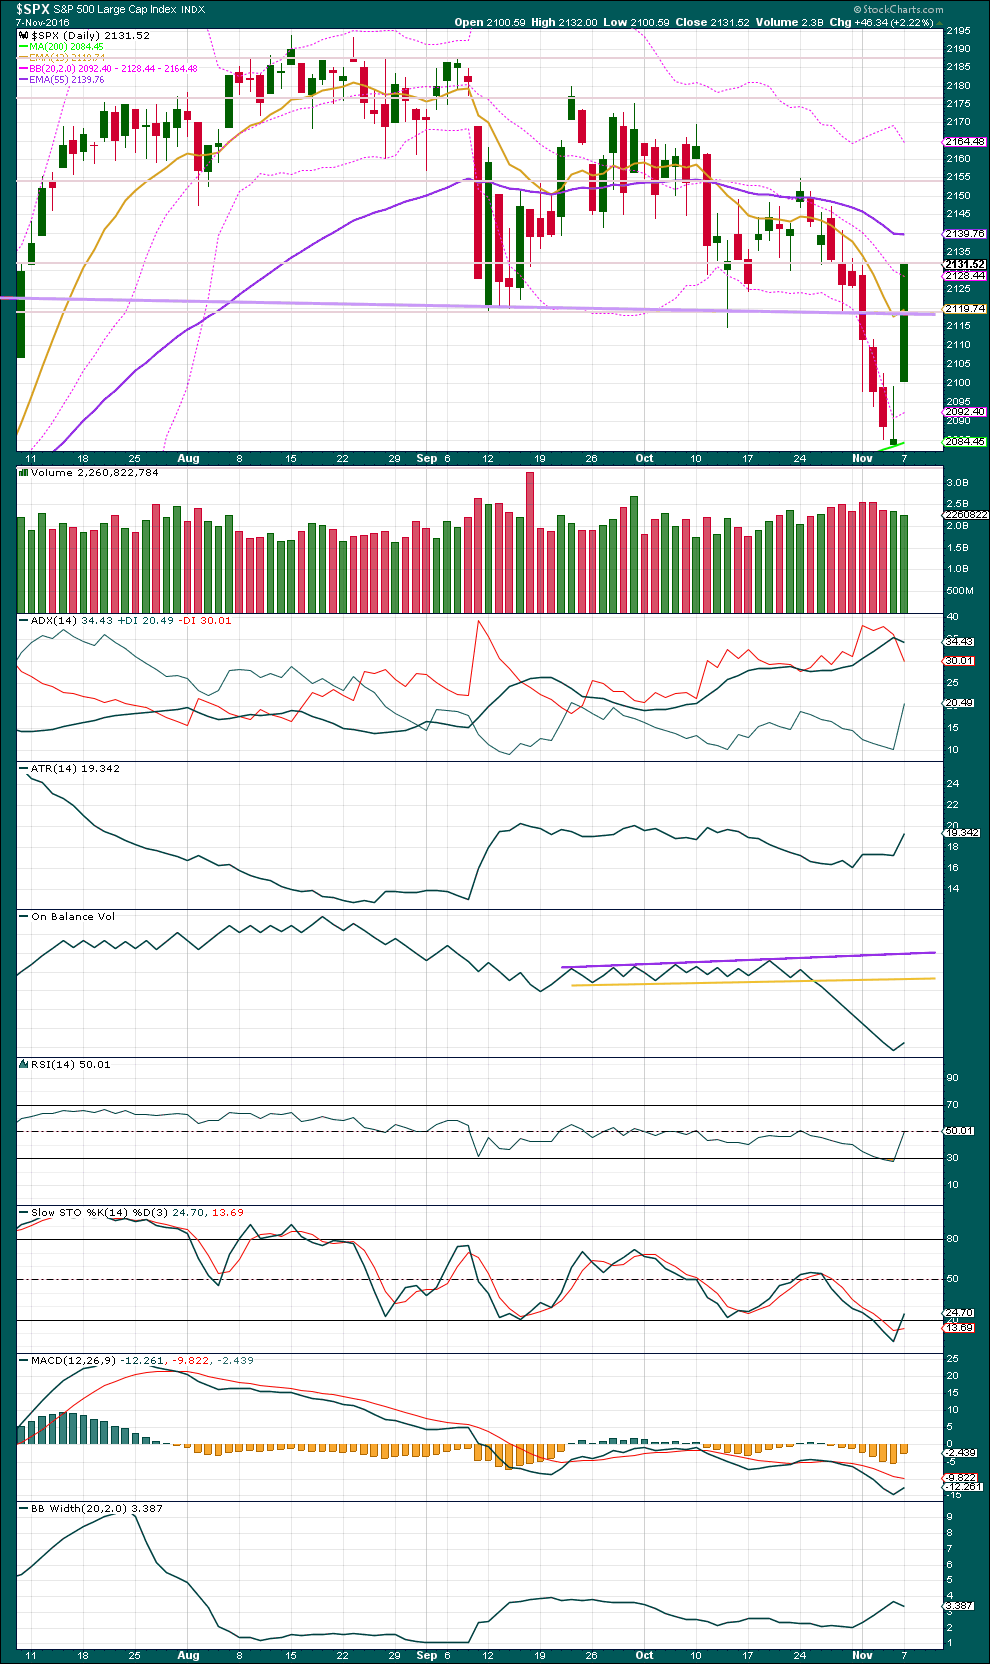
A strong upwards day does not have good support from volume. The last two green daily candlesticks have both now come with declining volume. This slightly supports a bearish outlook over a bullish one.
Price has closed well above the lilac trend line, slicing cleanly through and finding no resistance. This is very bullish. It would now be typical behaviour to see price turn around to find support at this line before moving up and away. If it does that, it may offer a good opportunity to join a trend.
ADX today has declined indicating the market is no longer trending downwards. It has not yet indicated a trend change: the -DX line remains above the +DX line.
ATR increased today. A new trend may be developing, but Bollinger Bands slightly contracted. If it is a new trend at this very early stages, it is showing signs of weakness.
Today’s strong green candlestick completes a very strong bullish engulfing candlestick pattern with support at the 200 day moving average. The close of today’s session almost at the high engulfs the last four candlesticks. For the purposes of an engulfing pattern, it is the close of the second candlestick in relation to the open of the first that’s important. So if the close is above for a bullish pattern, then the bulls were able to push price beyond the real body of the prior session. In this case, the bulls were able to push price above the real bodies of all sessions back to the 31st of October, which is very bullish indeed.
This single session has brought RSI up from oversold to neutral. There is plenty of room for price to rise or fall.
Stochastics is just returning from oversold.
VOLATILITY – INVERTED VIX CHART
Click chart to enlarge. Chart courtesy of StockCharts.com.
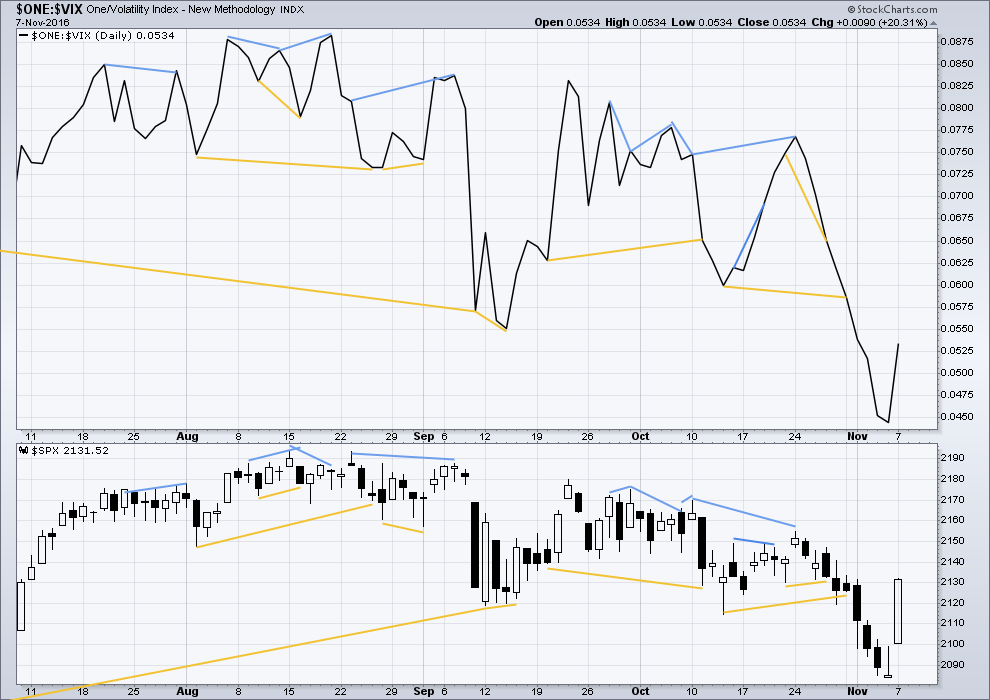
There are a few instances of multi day divergence between price and inverted VIX noted here. Bearish divergence is blue. Bullish divergence is yellow. It appears so far that divergence between inverted VIX and price is again working to indicate short term movements spanning one or two days.
No new divergence is noted today.
BREADTH – AD LINE
Click chart to enlarge. Chart courtesy of StockCharts.com.
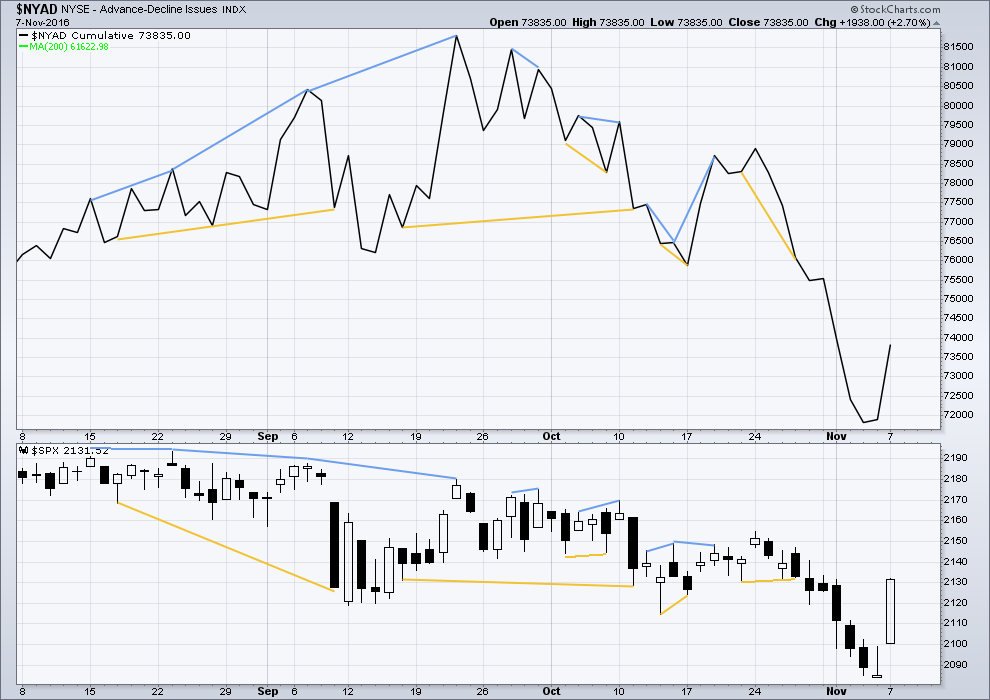
Short term bullish and bearish divergence is again working between price and the AD line to show the direction for the following one or two days.
No new divergence is noted today.
BREADTH – MCCLELLAN OSCILLATOR
Click chart to enlarge. Chart courtesy of StockCharts.com.
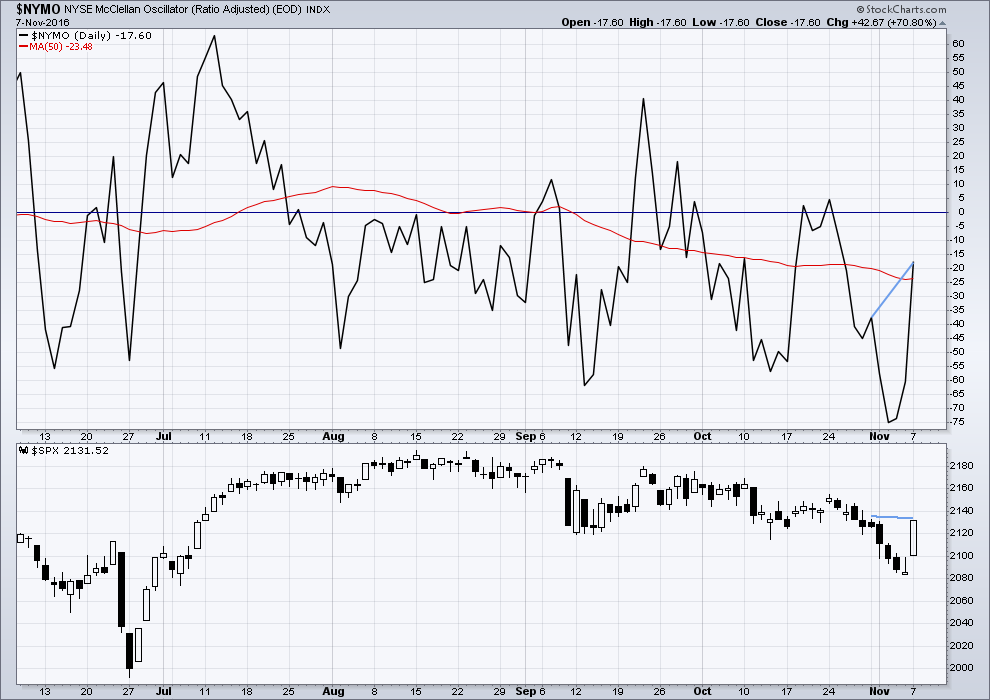
The McClellan Oscillator is now extreme (below 60). On its own this is not an indicator of a low, but it is a warning that this market is oversold. The McClellan Oscillator today is at -73.44.
On the 21st August, 2015, the McClellan Oscillator reached a similar point of -71.56. Price found a low the next session, 104 points below the closing price of the 21st August. This very extreme reading for the 24th August would have been a strong indicator of a low in place.
On the 11th December, 2015, the McClellan Oscillator reached -80.82. It moved lower the next session to -92.65 and price moved 19 points lower. The extreme reading of 11th December might possibly have led to an expectation of a bigger bounce than the one that occurred, and might have misled analysis into missing the strong fall from 29th December to 20th of January.
The next most recent occasion where this oscillator was extreme was the 8th January, 2016. It reached -66.25 on that date. The low was not found for seven sessions though, on the 20th January 2016, almost 110 points below the closing price of the 8th January. At the low of the 11th February, there was strong bullish divergence with price making new lows and the oscillator making substantially higher lows. This may have been a strong warning of a major low in place.
As an indicator of a low this is not it. It is a warning of extreme levels. The next thing to look for would be some divergence with price and this oscillator at lows. Divergence is not always seen at lows, but when it is seen it should be taken seriously. Any reading over 100 should also be taken very seriously.
This indicator will be approached with caution. It is one more piece of evidence to take into account.
Bullish divergence noted in last analysis may now be resolved by a very strong upwards day.
Some very weak bearish divergence is noted today: the McClellan Oscillator today made a new high substantially above the prior point of the 31st of October, but price has failed to make a corresponding new high. The failure in price is only by 1.25 points though, so this divergence is only weak.
DOW THEORY
Major lows within the old bull market:
DJIA: 15,855.12 (15th October, 2014) – closed below on 25th August, 2015.
DJT: 7,700.49 (12th October, 2014) – closed below on 24th August, 2015.
S&P500: 1,821.61 (15th October, 2014) – has not closed below this point yet.
Nasdaq: 4,117.84 (15th October, 2014) – has not closed below this point yet.
Major highs within the bear market from November 2014:
DJIA: 17,977.85 (4th November, 2015) – closed above on 18th April, 2016.
DJT: 8,358.20 (20th November, 2015) – has not closed above this point yet.
S&P500: 2,116.48 (3rd November, 2015) – closed above this point on 8th June, 2016.
Nasdaq: 5,176.77 (2nd December, 2015) – closed above this point on 1st August, 2016.
Dow Theory Conclusion: Original Dow Theory still sees price in a bear market because the transportations have failed to confirm an end to that bear market. Modified Dow Theory (adding S&P and Nasdaq) has failed still to confirm an end to the old bull market, modified Dow Theory sees price still in a bull market.
It is noted today that while the S&P500, DJI and Nasdaq moved lower, DJT did not. This is not part of Dow Theory, but divergent behaviour between DJT and the other indices is a cause for concern regarding this downwards trend for the S&P500.
This analysis is published @ 07:55 p.m. EST.
Over the years of following Lara’s analysis we have so often waited with bated breath as we anticipated stacked third waves to the downside but they always seemed to elude us. Maybe some of us were starting to wonder if that animal even existed.
Well, you’re looking at him, and he is a BEAST! 🙂
The futures red candle is engulfing several weeks of candles…Wow!
There’s gonna be an awful lot of margin calls tomorrow and this thing could get really ugly as positions are forcibly liquidated….
Those two dollar SPX 214 puts expiring tomorrow are now looking like a bargain…it was staring me right in the face and I was too clue-less to get it….silly me! 🙂 🙂 🙂
The banksters are going to have to spend a lot of count to claw their way out of this one baby! A LOT of coin!
Holy mashed potatoes Batman!
If SPX 2000 falls by even the tiniest amount overnight…
Farewell and adieu
To you Spanish Ladies… 🙂
Man Oh man! VIX gets it right every time…!
If I had any cohones, that green print should have been the clue and I would have loaded the short side wagons.
I missed it when I went to vote. 🙁
We may be looking at a sextuplet of thirds to the downside people!
Nobody will be confused about what we are seeing now will they?
YOWZA! Futures heading South people! Ai YiI Yi!
Anybody looking at that HTZ chart? Yikes!
It fell 50% during the first few hours of trading and incinerated a cool 2 billion from the trading accounts of a lot of very savvy investors, including people like Carl Ichan. Ouch!
We should see a nice bounce so it looks ripe for a quick upside trade; quick being the operative word. I think it is a dead man walking. That VIX print today could spell trouble for the bulls.
Well…back from doing my civic duty and voting. Why do I have this nagging feeling that regardless of who is declared the winner, not much is going to change in Gotham City? 🙂
Does Elliott Wave ignore “noise” and the waves play out, or can it alter results? Aka election, Brexit, etc.
I think the “noise” is supposed to be irrelevant. As counter-intuitive as it seems, the thinking is that the waves make the news and not the other way around.
Ok, thanks Vern. I only trade big coming out of wave 4’s, so I wasn’t sure about the early waves.
The big moves usually turn up as third waves of impulses, the strongest portion often happens on a news release.
Or fifth waves. Particularly for commodities, and for the S&P when it’s in a bear market.
So here the main wave count expects a spike down to end intermediate (2), maybe that will happen mostly after hours.
Then the next move is expected to be a third wave within a third wave up. That should show some strength.
I’ve been musing on whether Trump or Clinton will win based on which count, bull or bear is correct. EW theory expects that during a bear market the electorate desires change, so that would favour Trump winning. During a bull market the electorate prefers the status quo. As Obama is a Democrat that would favour Clinton, another Democrat winning.
So I’m thinking that who wins may give us a little information as to which wave count is correct.
And if the main wave count is more likely then that points to Clinton as maybe more likely to win.
Just my two cents worth on that anyway.
Personally, I want to be up and awake to profit from any price shock, and then I’ll just be really happy for the whole election thing to be over. I don’t recall any past US elections having this saturation of coverage world wide.
Can we close above the 50 SMA? That would be big.
Huge! Believe me. 🙂
It doesn’t look like that will happen in the closing minutes.
But it does look like SPX will close above yesterday’s close with VIX closing below yesterday’s close. This is the confirmation of the buy signal I was looking to see.
In the last ten minutes it looks like the bears are selling it into the close or the bulls are taking their money off the table. I think it is the start of the c wave of this correction down to the 2114-2120 region. I suspect we will see that tomorrow morning.
Regarding the ‘noise’, Elliott Wave as done by Lara, looks at price alone. There is no adjustment or compromise because of extenuating circumstances. She does not regard overnight or after hours futures trading. Lara will correct this if I am wrong. But that is what I like about her analysis, invalidation points are viewed as to price alone. I have also learned that confirmation points are often best thought of as confidence points.
Correct.
I think perhaps I should stop using “confirmation” and just use “confidence”
Thanks Rod, appreciate it
SPY 214 strike puts expiring tomorrow are trading for TWO BUCKS!!
I was thinking about buying a few just for laughs and selling ’em before the close but two bucks is more than ridiculous. What exactly is it that them there market makers know that we don’t???!!! 🙂 🙂 🙂
I thought you were a market maker? ? lol
He! He!
I never thought I would be cheering legislative action taken by the Brits but I am today.
The French kleptomaniacs had mounted a full scale assault on British overseas terrotories, including my beloved homeland, the British Virgins Islands, to get them listed as non-cooperative because of their zero percent corporate taxes.
Listen up you Frogs – the per capita income in the BVI is 1 1/2 times that of your decaying country so mind you own damned business will ya?
The British Parliament told the EU to take a long walk on a short pier. ‘Nuff said!
That’s the way to tell em!
😀
I’m looking at possibly moving in 2 years when my son has finished school.
So I’m looking at options with very low or no tax, and BVI is one. Panama is another good one and has better surf. Bermuda looks good too, but a very high cost of living.
Or so the internet tells me.
I have a very comfy condo for you and your family on Tortola. Surf on the North Side would be awesome!
That’s very kind Verne, thank you. I like the tax rate in BVI. 0% would suit me just fine 🙂
Panama is epic, with great food and great surf on both coasts!
Pretty good on banking privacy too; the recent “Panama Papers” was an unfortunate exception.
How exciting for you and your family. Good luck and joy in the search as well as in the relocation. If you go a bit north of those ( like a few thousand miles) you’ll be in my neck of the woods! No surf but ice cold water and glaciers.
Awesome guys! Yes, I did look at the surf on BVI and Tortola does look pretty good.
Closer to the time when we’re making our decision I’ll definitely be asking for local inside knowledge, this membership has people in many of the countries we’ll be looking at.
FYI, SPY was rejected at the 50 SMA today.
That my dear friends, is HUGE (as Trump would say!) 🙂
Great analysis from Lara and Vern. All cash is the play. No fear of missing out.
He who fights and runs away,
is safe to fight another day! 🙂
I know the original says “Lives”, but “safe” seemed more apropo when talking about our trading accounts! 🙂
Shorted SPX at 2146 with very tight stop loss. Let see if this will crash to 1850 tonight. Goodnight
We have 2 Davids??I’m all cash.
My head is spinning guys. Who, exactly is who??!! 🙂
Uh oh. That’s not good. Hold onto your hat Verne…
One of the Davids will need to make a small change to your name. Which one and to what? Email me please and let me know
admin@elliottwavestockmarket.com
It looks like I post the most, so I will email you.
That’s okay, I’ve changed the other David’s name to DavidH.
If DavidH is not happy with that then I will change it to something else.
Problem sorted now I think.
So far since your name is in caps, I have you as Big David. No offence little david. 🙂
Thanks pal, I’ll take it.
I’ve made an executive decision and changed your name to DavidH
Ok, sounds good
Updated hourly chart:
Minor 5 if it’s over here (and it looks over) is 1.59 points short of 1.618 X minor 1.
Intermediate (1) is now a five wave impulse. Intermediate (2) may correct to the 0.382 Fibonacci ratio at 2,123, it would find support at the lilac trend line there.
Wouldn’t wave 2 need to be deeper than 38.2? If not, that is something I did not know about wave 2.
Other than an ending diagonal.
Second waves are commonly deep. But they don’t have to be.
In this instance I am expecting that the strength of support at the trend line will force intermediate (2) to be more shallow.
Ok, thanks for that.
Be on the look-out for a violent down-draft into the close as that has been the pattern lately. A green VIX print to day is short term bearish, and possibly short term VERY bearish.
This something I have not seen for quite some time.
My trading portfolio is EMPTY!
I’m looking at VIX data on StockCharts, and its still red but the body is very small.
Starting to look like a fade to me folks. VIX inching ever so closer to green territory. We should not be even discussing a green VIX print in the middle of a third wave up imo…
Good morning Verne. It does look rather weak…. only an hour and a half to go.
But as Rodney points out there are also just too many problems with the alternate wave count. The problem there from an EW perspective… is the first wave down needs to be either an impulse or a leading diagonal. It simply won’t fit as a leading diagonal. The only way I can see a new trend down beginning is as an impulse.
Now micro 2 is too huge for such a low degree wave.
But it’s still technically viable.
Morning Lara!
You slept well I trust?
We tried to mind the store in your absence…. 🙂
I did thank you. I had a little sleep in to 8am. Oh, the luxury 🙂
I think you’ve done an excellent job minding the store.
Selling SVXY 67 strike call for a small gain on two days of upside pop. I had planned to hold and take delivery of 100 shares if we had volume confirmation of a move to the upside but changed my mind due to extremely low volume.
Wow! My trading spreadsheet is almost empty! Weird!
Selling to close 15 of my 25 SPY 208 puts to reduce my exposure and protect spread profits. If we take out today’s highs will sell remaining 10 contracts.
Selling my last two UVXY puts. Just about 100% cash.
Don’t want to sound like a broken record but please also take a long hard look at volume – not the stuff of which sustained rallies are usually made. Going to take a quick look at market breadth.
The very worst thing that could happen to long positions is a massive overnight gap down trapping bulls in long trades. If that happens stops are not going to do you one bit of good as price will blow right past them and if you have not used a limit order, you may well get filled with substantially larger losses than you had anticipated.
VIX will probably tell you if you need to exit those positions before the close.
If it prints a green candle today, I don’t care what the indices are doing- up hugely or flat.
You are taking a big risk remaining in your trades on the long side.
Whoa! DJI poking above its upper BB. That is like screaming “Short me!” 😀
Closing my short GDX trade for a modest gain. I held it too long and gave away two thirds of my loot while I dithered. A good reminder of one of my basic trading commandments:
“Know when you are going to get out, before you get in!” 🙂
Stay alert people. VIX is not behaving as if we are starting a third wave move to the upside. I realize that could be because we are a terminal fifth of a fifth but usually blow-off tops scream higher for several days without looking back and VIX simply swoons with huge red candles during the blow-off.
Closing the short put side of my bullish SPY put spread for gain of just over 800.00
The big question is whether to hold onto the long SPY 208 put. I think I will hold them and see if we exceed today’s high. If we do I will sell the 212 puts and stay in the trade for more upside.
Wall Street is really worried!!!!
Day TWO of the Big Con Job… to drive Votes to Hillary Clinton!
Yesterday I posted…
Warning!!!! Today was nothing more than a Big Con Job by Wall Street! Notice it all started in the over night where it didn’t take much capital! Actually 6-7PM ET Sunday more than half the move occurred.
This was Wall Streets way of generating turn out (voting wise) for Hillary Clinton! Wall Street owns Hillary Clinton as WikiLeaks has proven!
Yes… The Economy and everything is else is fantastic and the Stock Market Proves it.
Yea… Sure it is!
We could be looking at a buy the rumor sell the news scenario. I think the political risk to the market is to the downside. Clearly the powers that be want everyone to think that a Clintonista win is a forgone conclusion, and that outcome may very well be baked into the market.
And what, may I ask, if it ain’t necessarilly so??!! Hmmnnn?
Brexit Redeux?
Fully long at the moment. Have put stops in just above my open
Hoping for the 3rd wave to ramp things up but at worst will take a small profit.
As you all keep saying “no one goes bust taking a profit”
Good luck to all of you 🙂
Yesterday morning I mentioned the 2140 – 2150 are as the first area of resistance. We are there and I think completing Intermediate (1) as per Lara’s main wave count and target of 2139+. Intermediate (2) should start sometime today. If it does not, I think we will be seeing an extended 1st wave and the degree of labeling will need to be lowered at least one degree.
It would strongly support the main wave count / bull count if VIX can close down and SPX close up. They have come from outside of their respective BB’s but the signal needs to be confirmed today by the closing prices. If this occurs, it is a reliable strong buy indicator.
Nice to read your comments again Joe. I remember the Reagan victory quite well. It was a couple for tough years as things turned around. But it gave us a almost two decade long period of real growth and prosperity. This last 16 years has been horrible for a whole variety of reasons.
I think the Main wave count is right on. I expect a return to the lower trendline of the descending triangle starting back in September. This matches the lilac trendline in Lara’s count. I see this as the 2114 to 2120 range. If this test holds and the market begins to move up and exceeds today’s high, we are on our way well above 2200 short term.
If that line does not hold, well ….. 1810 could be upon us quickly as well.
However, I do not like the Alternate count at all. First, a sextuplet of 3’s is almost a thing of dreams. I have seen it many times before enticing a trade and yet, it does not pan out. Secondly and more importantly, the Macro degree is the largest on the hourly count. It doesn’t look right. Thirdly, we have said here a million times, “If you have to ask if it is a third wave, it is not a third wave.” Yesterday has the look of a start of a third wave up not down. Fourthly and finally, Lara mentions the Alternate count requires us to disregard a triangle and that lowers the probability. All said and done, I place little confidence in the Alternate count.
The SPX 4 hour MACD has crossed over to the upside. The daily has not yet done so. I expect it to do so in a couple of days. However, as Vern mentions below, placing trades on market expectations can be very risky.
Here is how I plan to trade any election related market volatility.
Trying to anticipate what the market is going to do is a fool’s game and there is no way to safely take a large position ahead of elections results without exposure to undue risk. Small positions using straddles is probably the safest approach.
There is a way however, to take advantage of what the market actually does, and this is clearly far safer than trying to take advantage of what it might do.
I am looking at the VIX 20 strike puts expiring Nov 23. The ask for these puts is remarkably close to the ask for Nov 16 puts giving additional margin for the trade to pan out with very little additional premium cost, granted we will know by Nov 16 what Mr. Market has up his sleeve.
If we get a massive sell-off, those Nov 23 20 strike puts, now trading at an ask of 5.3 (Nov 16 for 5.1) have an excellent chance of trading for under a buck as VIX spikes towards 30. As VIX reverts to the mean (one of my bread and butter trades, RTM) it will certainly fall back below 20, giving at the very least an easy double on that trade.
I am placing a BTO order on VIX Nov 23 20 strike puts for a limit price of 0.99 GTC (fondly known as a “stink bid”)
If the market heads the other way, I will simply go long SPX and ride the final wave to the top. Merry Xmas! 🙂
FWII, the lat time we saw a candle this huge was on January 29.
It does seem to be the case that these kinds of manic moves occur predominantly in bear markets, and a few sharp traders I know are massively short. If we get a green VIX today I will be joining them…. 🙂
Actually we had a 70 point candle to the red on June 24th. But yesterday’s 43+ green candle is one of the largest since the swing high in early September. This is one clue that the downwards movement from the September high will be completely retraced.
I guess I should have specified a GREEN candle… 🙂
NYAD weekly…orange/blue trend indicator is key…?
Surely the market will show its hand tomorrow with such divergent wave counts.
The main count calls for action that is tepid.
The alternate calls for action that is torrid.
Which, Oh which shall it be?!
I can imagine hints of a Trump win could unleash a torrent of third waves to the downside – a sextuplet to be exact. That does seem an unlikely connection as micro two should be done long before the election results are in and the market would be well on its way to the downside prior to any election outcome being determined.
Languid movement for a day-long second wave correction would be a perfect set-up for a third wave to the upside if the Clintonista prevails.
I will be keeping my powder dry, and calmly watching from the sidelines. 🙂
I’m planning on getting up really horribly early here in NZ… maybe about 4-5am. I want to make some $$ when the markets go ballistic… a price shock should be a result of the election results.
So if I can manage to become conscious at that horrible early hour, I may randomly turn up here for a visit 🙂
Actually… after figuring out when the results may be in and factoring in time zones… I’m not getting up at that hour. It would probably be a waste of time.
Wrong morning… you won’t get any valid indications until after 8-9PM ET
Exit Polls are all BS and have been dead wrong many times in the past!
My feel is Trump wins with more than 300+ Electoral Votes.
Hillary gets the Votes of the elite 3-4% of income earners and of the very un-informed about what matter here in the USA!
It’s the same feeling that I had when R Reagan won in 1980