
Downwards movement was expected.
Summary: In the short term, a bounce may arrive to move price higher Monday / Tuesday which if it is deep may end about 2,082. The mid term target for a third wave at minor degree is 2,000. The long term targets for primary wave 3 are 1,595 or 1,271 (the lower target with a higher probability).
Trading advice (not intended for more experienced members): Corrections are an opportunity to join the trend or add to short positions. Traders with a short term strategy may take profits here and wait for a bounce to re-enter, but this does risk missing a possible strong move down that may continue with little interruption for a few days. It may be better to hold on until about 2,000 if not below. If holding on, then move stops to break even or just above 2,113.32 if it protects some profit.
Stops (and risk) for new positions may now be moved down to just above 2,113.32.
Last published monthly charts are here.
New updates to this analysis are in bold.
BEAR ELLIOTT WAVE COUNT
WEEKLY CHART
Click chart to enlarge.
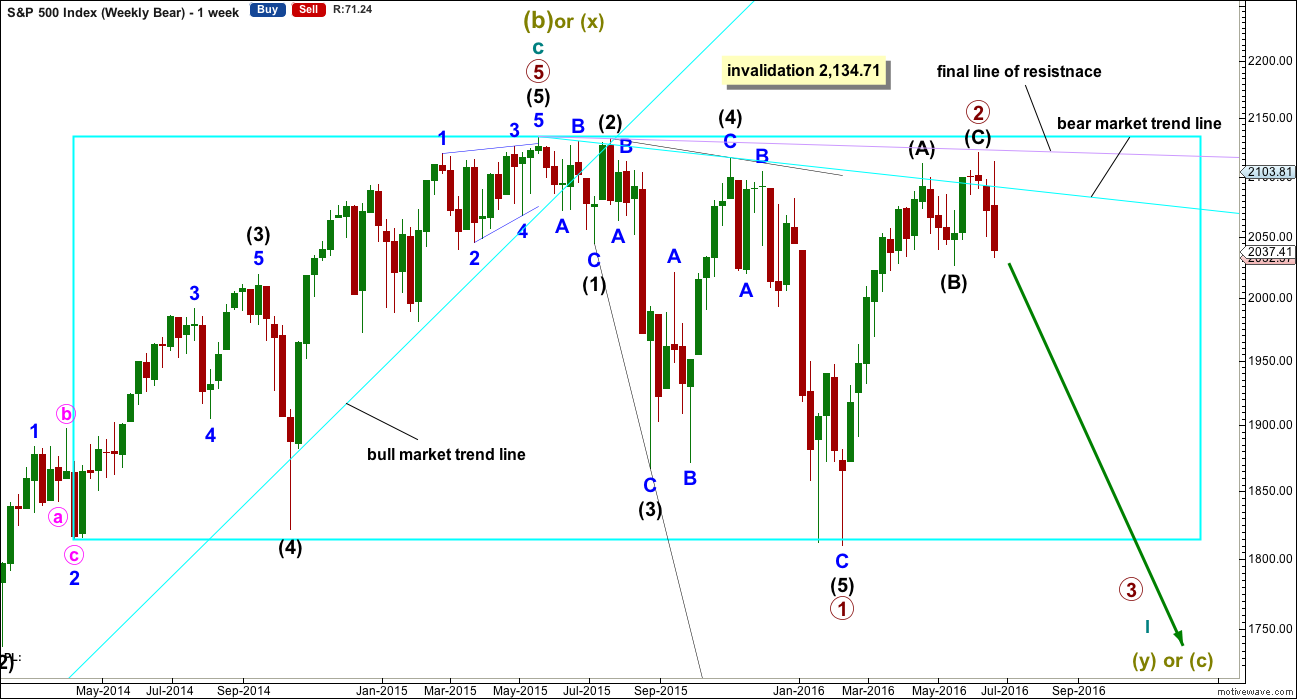
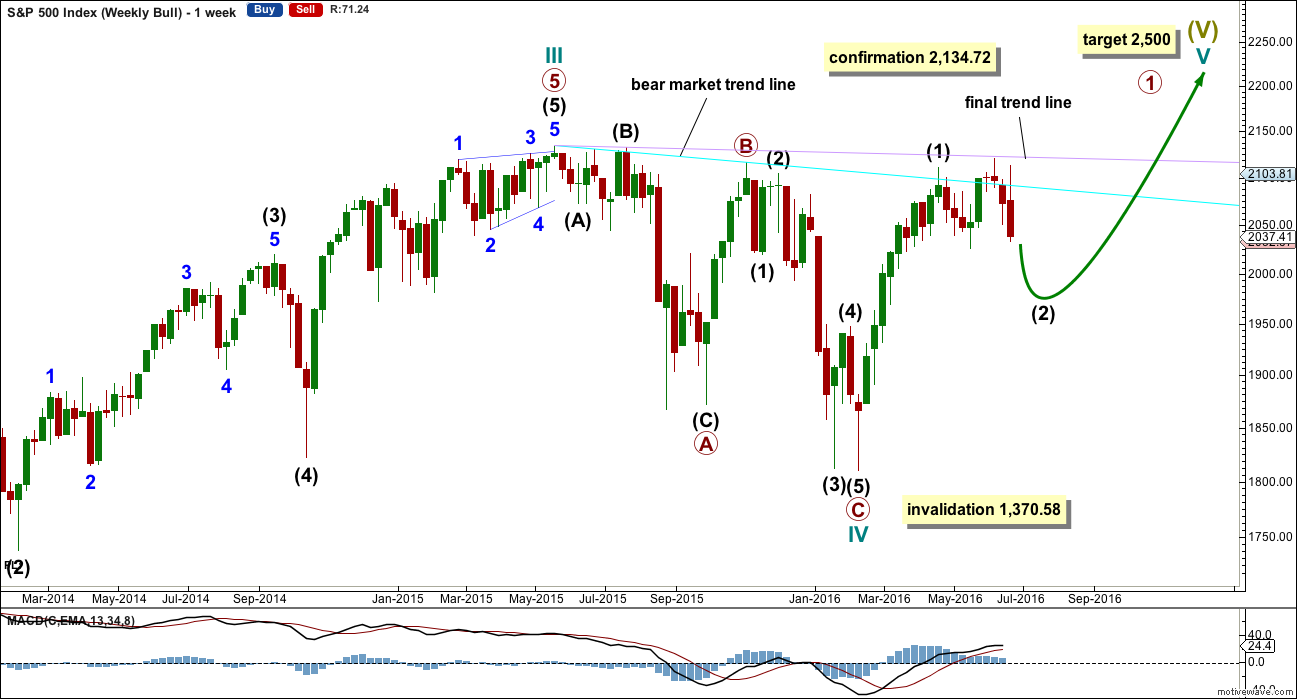
The box is added to the weekly chart. Price has been range bound for months. A breakout will eventually happen. The S&P often forms slow rounding tops, and this looks like what is happening here at a monthly / weekly time frame.
Primary wave 1 is seen as complete as a leading expanding diagonal. Primary wave 2 would be expected to be complete here or very soon indeed.
Leading diagonals are not rare, but they are not very common either. Leading diagonals are more often contracting than expanding. This wave count does not rely on a rare structure, but leading expanding diagonals are not common structures either.
Leading diagonals require sub waves 2 and 4 to be zigzags. Sub waves 1, 3 and 5 are most commonly zigzags but sometimes may appear to be impulses. In this case all subdivisions fit perfectly as zigzags and look like threes on the weekly and daily charts. There are no truncations and no rare structures in this wave count.
The fourth wave must overlap first wave price territory within a diagonal. It may not move beyond the end of the second wave.
Leading diagonals in first wave positions are often followed by very deep second wave corrections. Primary wave 2 would be the most common structure for a second wave, a zigzag, and fits the description of very deep. It may not move beyond the start of primary wave 1 above 2,134.72.
So far it looks like price is finding resistance at the lilac trend line. Price has not managed to break above it.
I have two Elliott wave counts at the daily chart level. Only one will have an hourly chart; a second will be added when the daily wave counts materially diverge.
DAILY CHART
Click chart to enlarge.
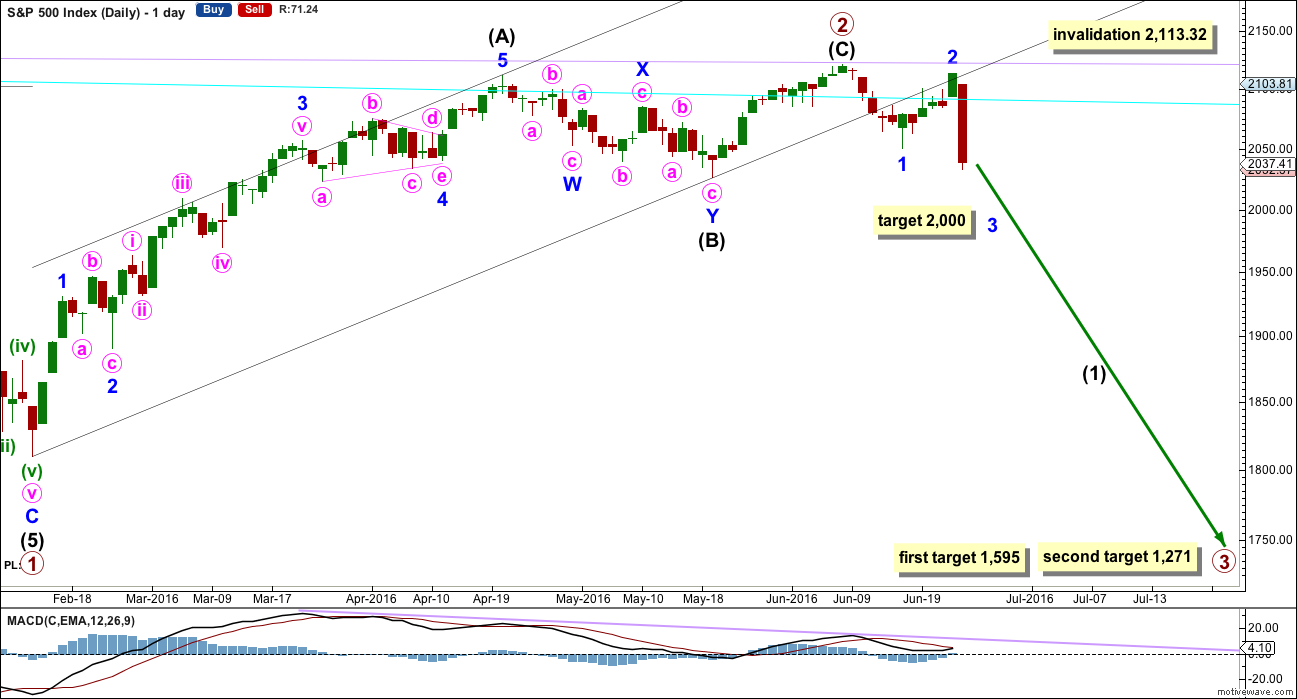
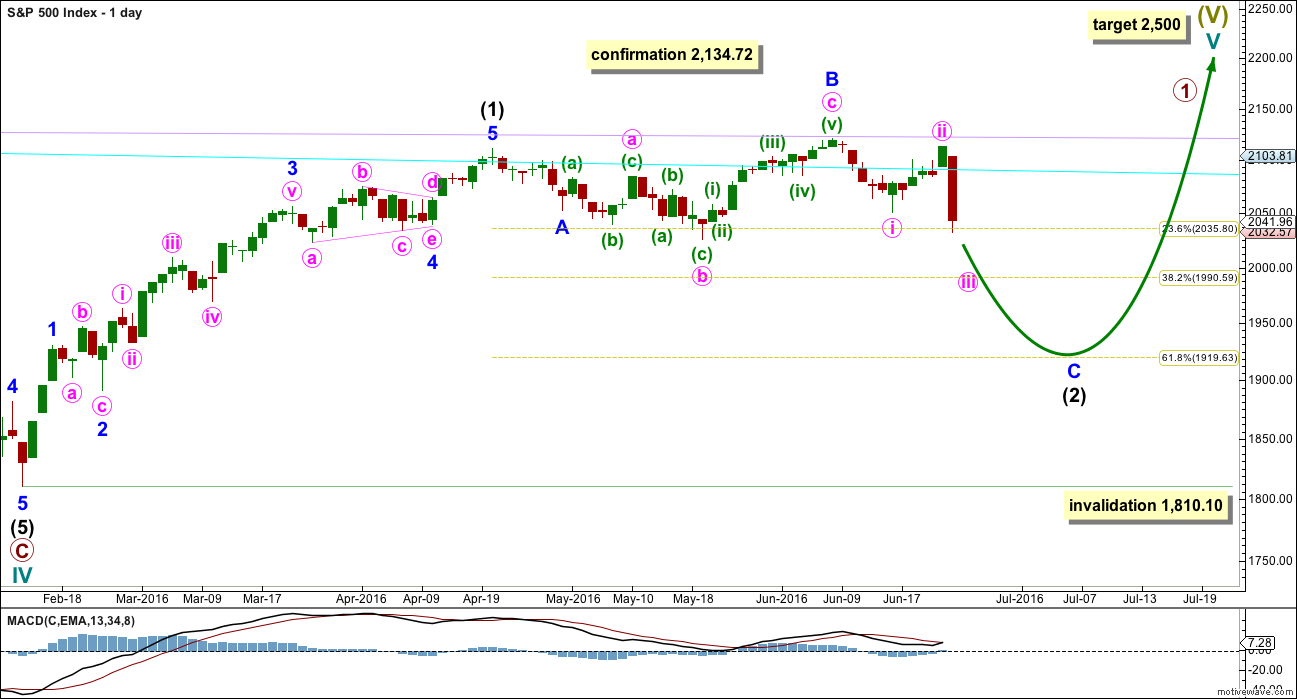
Primary wave 2 may have been a zigzag over earlier on 7th of June at 2,120.55. Thereafter, intermediate wave (1) may be underway with minor waves 1 and 2 complete.
At 2,000 minor wave 3 would reach 1.618 the length of minor wave 1. If this target is wrong, it may not be low enough. The next possible target would be at 1,930 where minor wave 3 would reach 2.618 the length of minor wave 1.
Within minor wave 3, no second wave correction may move beyond the start of its first wave above 2,113.32.
HOURLY CHART
Click chart to enlarge.
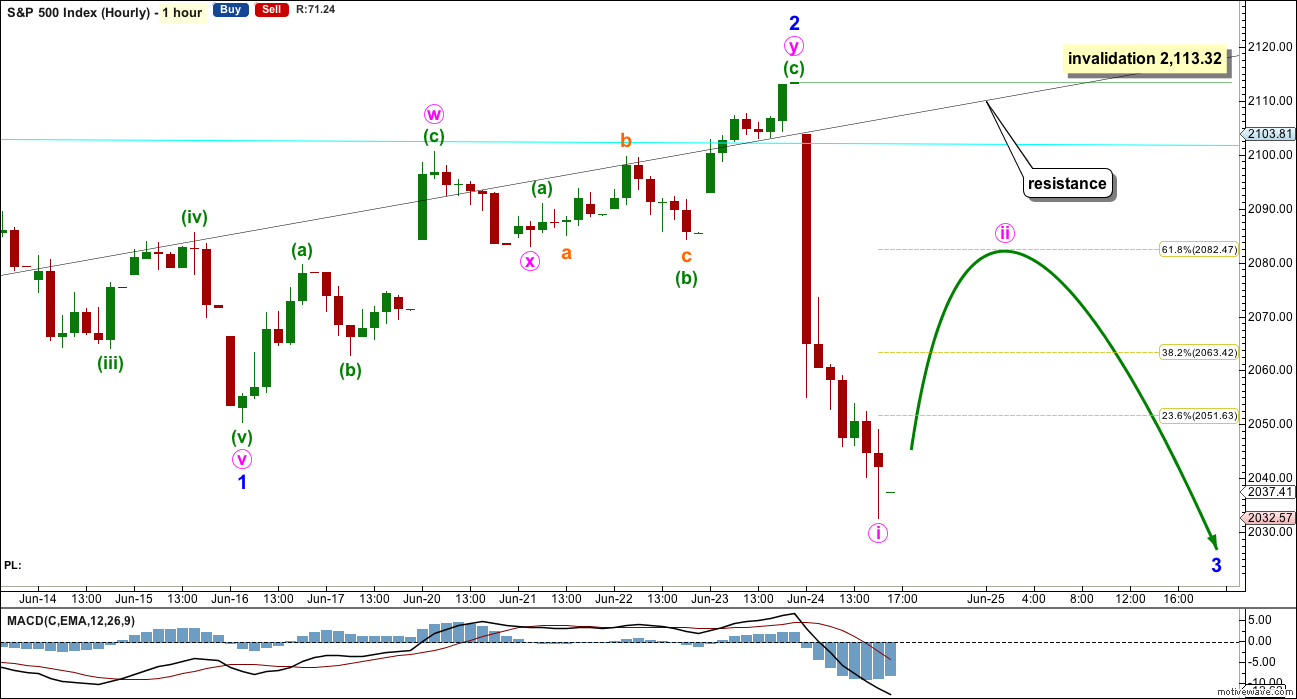
On the five minute chart, minute wave i subdivides neatly as a complete five wave impulse. Minute wave ii may end about either the 0.382 or 0.618 Fibonacci ratios at 2,063 or 2,082. I would favour the higher target slightly as this would be a second wave correction.
Minute wave ii may show up on the daily chart as one to three green daily candlesticks or doji.
It this expectation is wrong, then it may be that minute wave ii could be more brief and shallow. Look out for continuing surprises to the downside.
If minute wave ii unfolds as expected, then it would offer an excellent opportunity to join the downwards trend.
ALTERNATE DAILY CHART
Click chart to enlarge.
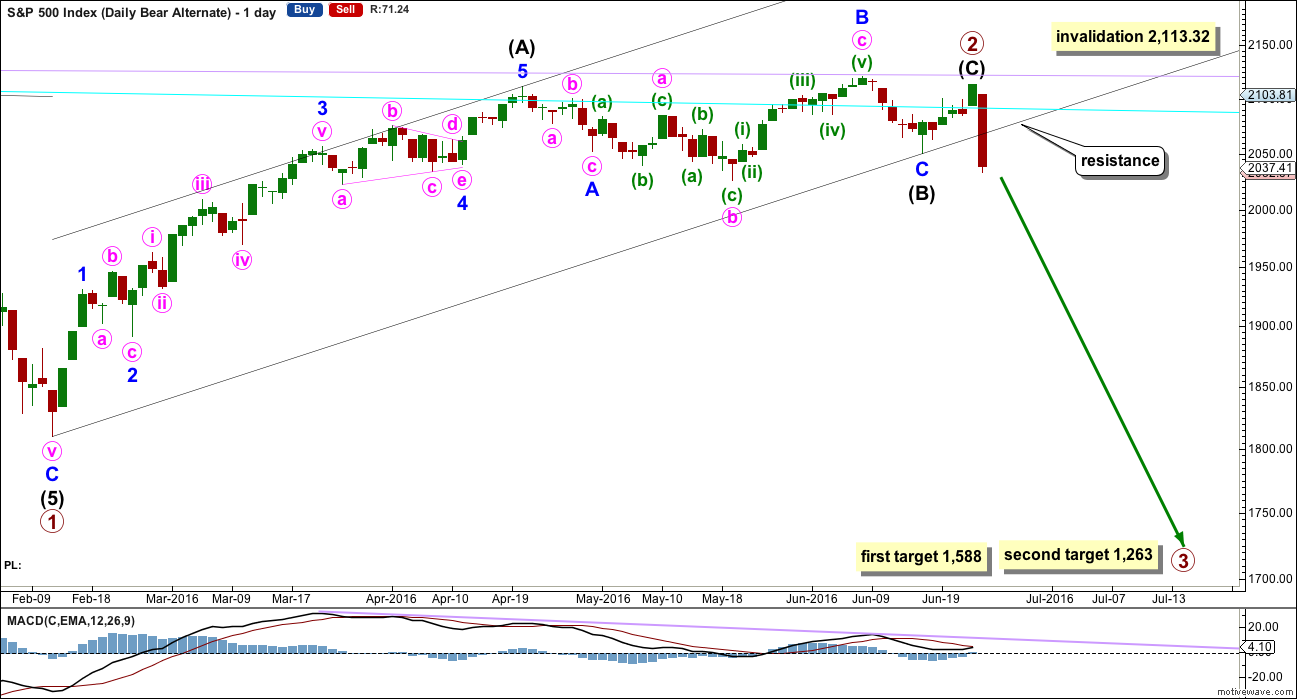
Primary wave 2 is relabelled. Intermediate wave (B) within it may have been more time consuming than previously expected. It subdivides as an expanded flat, minor wave B is a 1.16 correction of minor wave A and there is no Fibonacci ratio between minor waves A and C. Minor wave C ends slightly below the end of minor wave A avoiding a truncation.
If price moves any higher when markets open tomorrow (and price moved higher during after hours trading) then it should stop when the final line of resistance, the lilac trend line is touched.
The most common structure for a second wave correction is a zigzag.
Within primary wave 3, no second wave correction may move beyond the start of its first wave above 2,113.32.
At this stage, this alternate does not diverge from the main wave count at the hourly chart level. Both see an impulse downwards complete and both would expect a second wave correction to most likely unfold early next week. Again, look out for continuing surprises to the downside. If this analysis is wrong at the end of this week, it would be in expecting a more time consuming correction for a second wave, which may not turn up.
BULL ELLIOTT WAVE COUNT
WEEKLY CHART
Click chart to enlarge.
Cycle wave IV is seen as a complete flat correction. Within cycle wave IV, primary wave C is still seen as a five wave impulse.
Intermediate wave (3) has a strong three wave look to it on the weekly and daily charts. For the S&P, a large wave like this one at intermediate degree should look like an impulse at higher time frames. The three wave look substantially reduces the probability of this wave count. Subdivisions have been checked on the hourly chart, which will fit.
Cycle wave II was a shallow 0.41 zigzag lasting three months. Cycle wave IV may be a complete shallow 0.19 regular flat correction, exhibiting some alternation with cycle wave II and lasting nine months. Cycle wave IV would be grossly disproportionate to cycle wave II, and would have to move substantially out of a trend channel on the monthly chart, for it to continue further sideways as a double flat, triangle or combination. For this reason, although it is possible, it looks less likely that cycle wave IV would continue further. It should be over at the low as labelled.
At 2,500 cycle wave V would reach equality in length with cycle wave I.
Price has now broken a little above the bear market trend line. This line is drawn from the all time high at 2,134.72 to the swing high labelled primary wave B at 2,116.48 on November 2015. This line is drawn using the approach outlined by Magee in the classic “Technical Analysis of Stock Trends”. To use it correctly we should assume that a bear market remains intact until this line is breached by a close of 3% or more of market value. Now that the line is breached, the price point at which it is breached is calculated about 2,093.58. 3% of market value above this line would be 2,156.38, which would be above the all time high and the confirmation point.
This wave count requires price confirmation with a new all time high above 2,134.72.
While price has not made a new high, while it remains below the final trend line (lilac) and while technical indicators point to weakness in upwards movement, this very bullish wave count comes with a strong caveat. I still do not have confidence in it. It is produced as an alternate, because all possibilities must be considered. Price managed to keep making new highs for years on light and declining volume, so it is possible that this pattern may continue to new all time highs for cycle wave V.
The invalidation point will remain on the weekly chart at 1,370.58. Cycle wave IV may not move into cycle wave I price territory.
This invalidation point allows for the possibility that cycle wave IV may not be complete and may continue sideways for another one to two years as a double flat or double combination. Because both double flats and double combinations are both sideways movements, a new low substantially below the end of primary wave C at 1,810.10 should see this wave count discarded on the basis of a very low probability long before price makes a new low below 1,370.58.
DAILY CHART
Click chart to enlarge.
Intermediate wave (2) may be continuing lower. The 0.618 Fibonacci ratio would be a reasonable target at 1,920.
Intermediate wave (2) may not move beyond the start of intermediate wave (1) below 1,810.10.
I still do not have confidence in this wave count. It absolutely requires a new all time high above 2,134.72 before it would be taken seriously. This wave count has no support from classic technical analysis at the monthly chart level.
TECHNICAL ANALYSIS
WEEKLY CHART
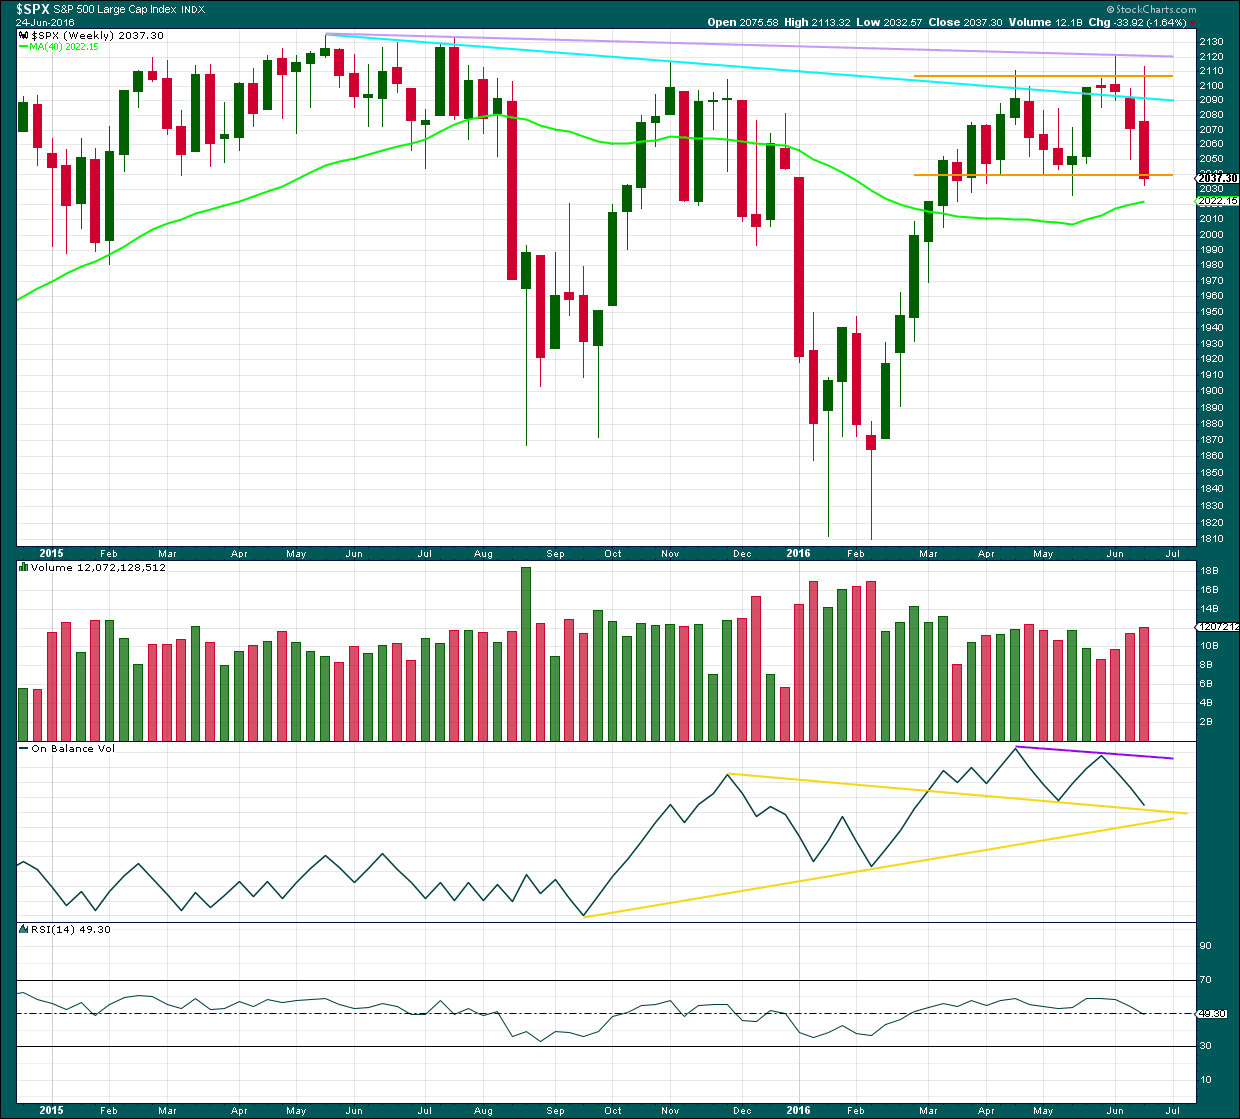
Click chart to enlarge. Chart courtesy of StockCharts.com.
Another strong downwards week is supported by an increase in volume. If next week can remain below the lower orange support line, then a downwards breakout from consolidation would be confirmed.
Overall price is falling on increasing volume For four weeks in a row. This supports a downwards trend.
On Balance Volume trend lines have been redrawn again. OBV may be finding support this week at the first yellow line. This may initiate a bounce next week, but it does not indicate how long the bounce may last for though, only that a bounce here is likely.
RSI is neutral. There is plenty of room for price to fall. This downwards wave may only be considered over when RSI reaches oversold at the weekly chart level, and preferably also exhibits divergence with price at a low. This was seen at both the last two important weekly lows, so it will be expected as likely to show up again.
DAILY CHART
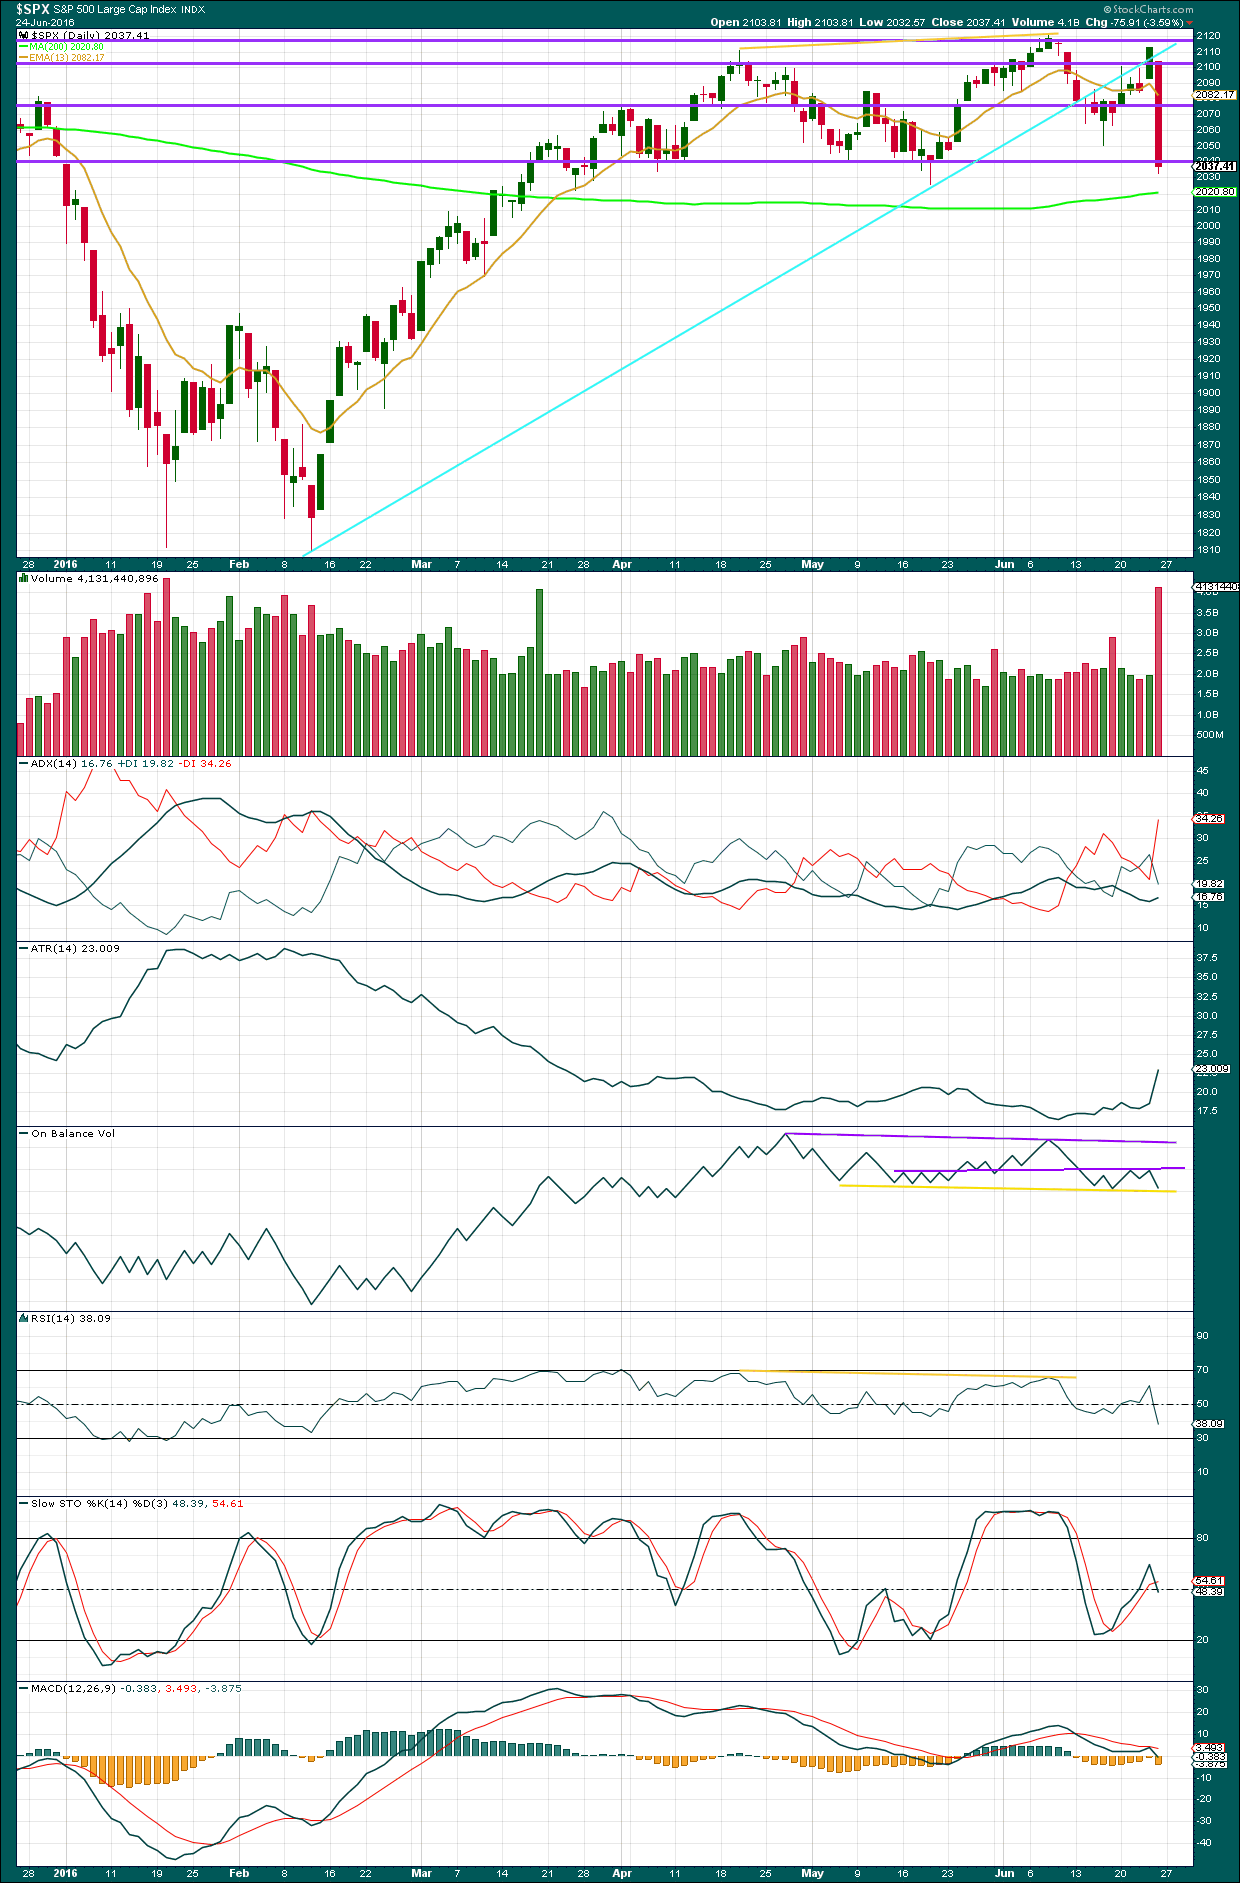
Click chart to enlarge. Chart courtesy of StockCharts.com.
Volume data on StockCharts is different to that given from NYSE, the home of this index. Comments on volume will be based on NYSE volume data when it differs from StockCharts.
Volume from NYSE indicates a decline in volume for Friday with 330.16mil compared to higher volume for Thursday of 525.31mil. NYSE volume data will be used today for volume analysis. The fall in price was not supported by volume; the market fell of its own weight. An absence of buyers can achieve the same outcome for price as an increase in sellers. However, for price to move through a third wave sellers should enter to increase volume. This looks like a first wave which fits the Elliott wave count.
ADX is increasing and the -DX line is above the +DX line indicating a downwards trend is in place. ATR strong agrees today that there is a downwards trend in place. This supports the Elliott wave count.
On Balance Volume has come lower for Friday’s session to touch the first yellow line. This may hold up price for a small bounce, and this may be a second wave bounce expected from the Elliott wave count on Monday / Tuesday.
If OBV moves below the first yellow line, that would be a strong bearish indicator. It would then be in free-fall territory.
RSI is not yet oversold. There is still room for price to move lower. RSI may remain extreme for some time during a strong trend. RSI on the weekly chart level will be more useful to indicate when a low is in place.
Stochastics is also neutral. There is plenty of room for price to fall.
VOLATILITY – INVERTED VIX MONTHLY CHART
Click chart to enlarge. Chart courtesy of StockCharts.com.
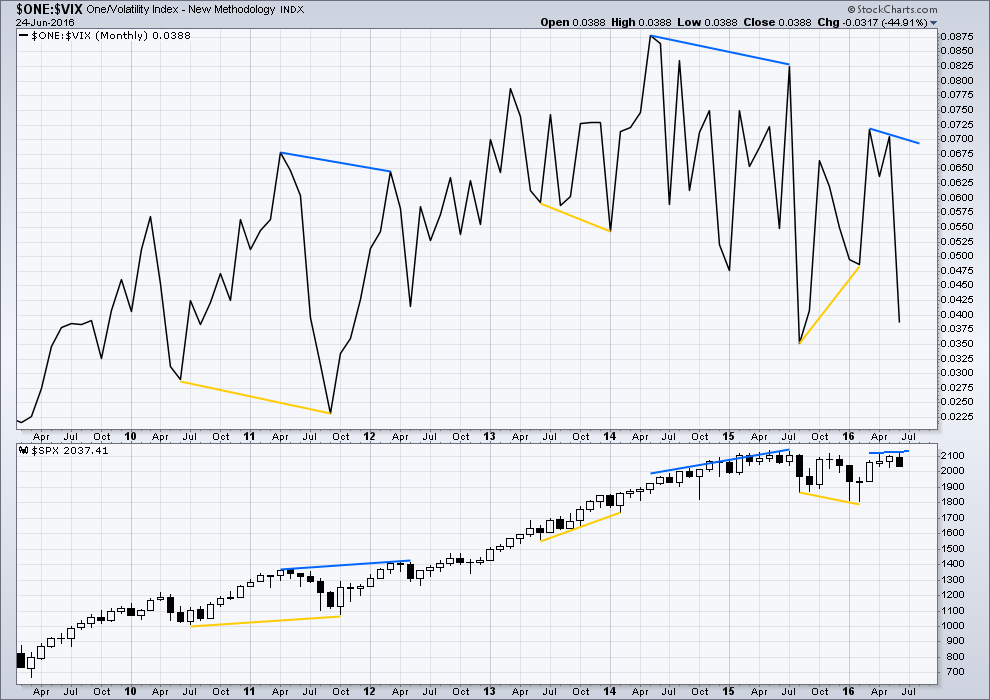
Several instances of large divergence between price and VIX (inverted) are noted here. Blue is bearish divergence and yellow is bullish divergence (rather than red and green, for our colour blind members).
Volatility declines as inverted VIX rises, which is normal for a bull market. Volatility increases as inverted VIX declines, which is normal for a bear market. Each time there is strong multi month divergence between price and VIX, it was followed by a strong movement from price: bearish divergence was followed by a fall in price and bullish divergence was followed by a rise in price.
There is still current multi month divergence between price and VIX: from the high in April 2016 price has made new highs in the last few days but VIX has failed so far to follow with new highs. This regular bearish divergence still indicates weakness in price.
At the end of this week, there is no bullish divergence at the monthly chart level from VIX. Overall, more downwards movement is still indicated for price.
VOLATILITY – INVERTED VIX DAILY CHART
Click chart to enlarge. Chart courtesy of StockCharts.com.
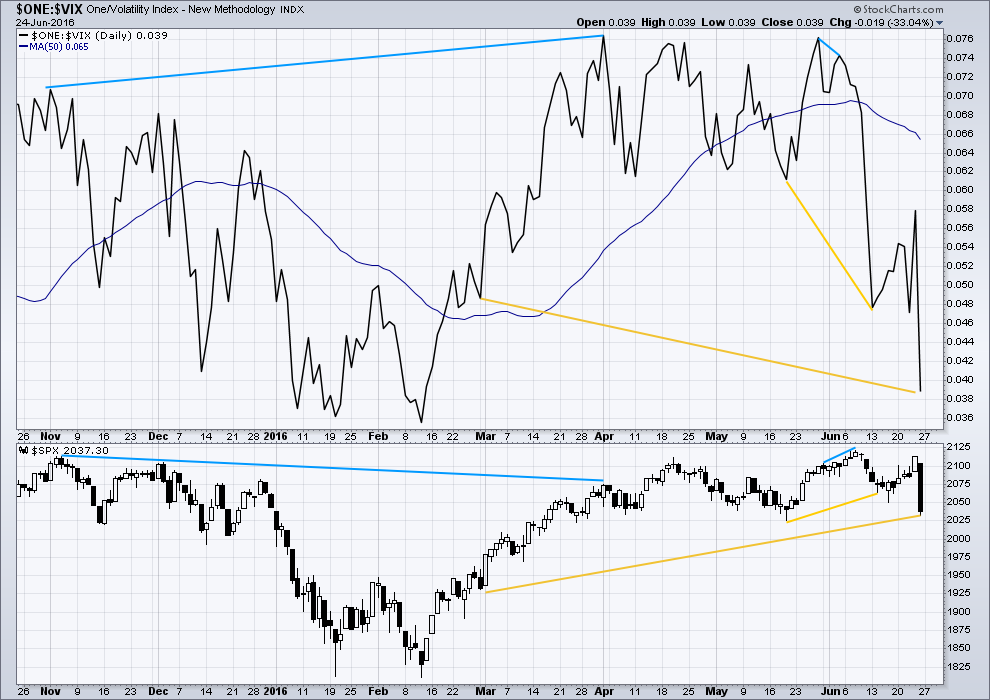
Bullish divergence noted with the shorter yellow lines should be resolved now from upwards movement which unfolded over most of last week (until Friday).
There is another instance of longer term possible hidden bullish divergence noted here between price and inverted VIX with longer yellow lines. From the low of 29th February, volatility has at the end of this week strongly increased yet this has not yet translated into an increase in price. Surprisingly, after a very strong downwards day on Friday, this indicates weakness to downwards movement from price. In conjunction with lighter volume for Friday’s session this supports the short term expectation of a bounce on Monday / Tuesday to resolve this divergence.
While I would not give much weight to divergence between price and many oscillators, such as Stochastics, I will give weight to divergence between price and VIX. Analysis of the monthly chart for the last year and a half shows it to be fairly reliable.
BREADTH – ADVANCE DECLINE LINE
Click chart to enlarge. Chart courtesy of StockCharts.com.
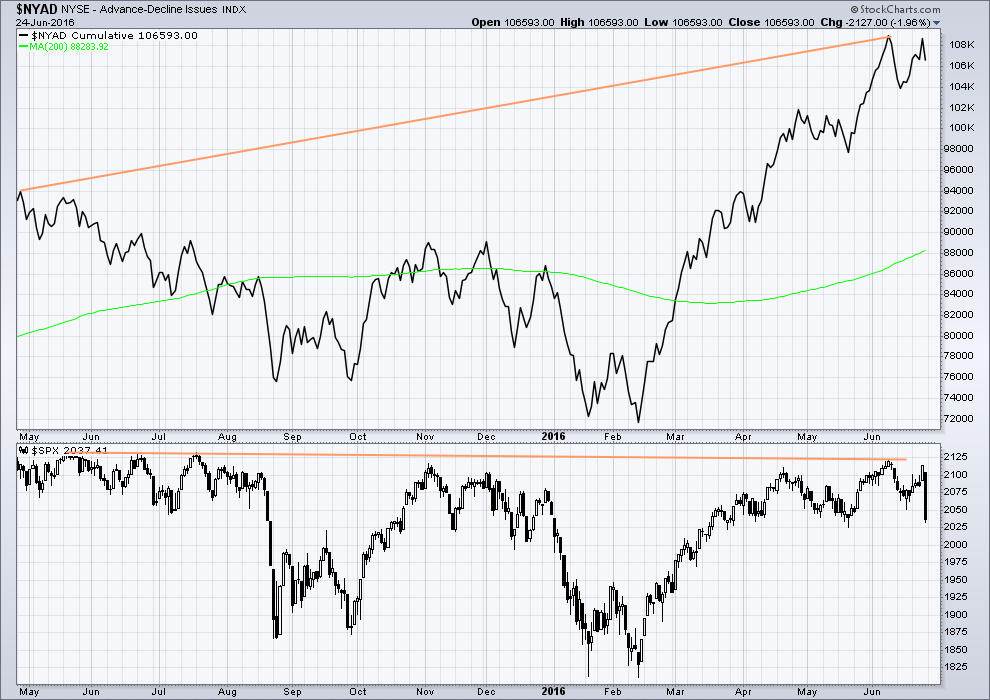
With the AD line increasing, this indicates the number of advancing stocks exceeds the number of declining stocks. This indicates that there is breadth to prior upwards movement.
Taking a look at the bigger picture back to and including the all time high on May 2015, the AD line is making substantial new highs but price so far has not. While market breadth is increasing beyond the point it was at in May 2015, this has not translated (yet) into a corresponding rise in price. Price is weak. This is hidden bearish divergence.
DOW THEORY
The last major lows within the bull market are noted below. Both the industrials and transportation indicies have closed below these price points on a daily closing basis; original Dow Theory has confirmed a bear market. By adding in the S&P500 and Nasdaq a modified Dow Theory has not confirmed a new bear market.
Within the new bear market, major highs are noted. For original Dow Theory to confirm the end of the current bear market and the start of a new bull market, the transportation index needs to confirm. It has not done so yet.
Major lows within the prior bull market:
DJIA: 15,855.12 (15th October, 2014) – closed below on 25th August, 2015.
DJT: 7,700.49 (12th October, 2014) – closed below on 24th August, 2015.
S&P500: 1,821.61 (15th October, 2014) – has not closed below this point yet.
Nasdaq: 4,117.84 (15th October, 2014) – has not closed below this point yet.
Major highs within the new bear market:
DJIA: 17,977.85 (4th November, 2015) – closed above on 18th April, 2016.
DJT: 8,358.20 (20th November, 2015) – has not closed above this point yet.
S&P500: 2,116.48 (3rd Nobember, 2015) – has now closed above this point on 8th June, 2016.
Nasdaq: 5,176.77 (2nd December, 2015) – has not closed above this point yet.
It is a reasonable conclusion that the indices are currently in a bear market. The trend remains the same until proven otherwise. Dow Theory is one of the oldest and simplest of all technical analysis methods. It is often accused of being late because it requires huge price movements to confirm a change from bull to bear. In this instance, it is interesting that so many analysts remain bullish while Dow Theory has confirmed a bear market. It is my personal opinion that Dow Theory should not be accused of being late as it seems to be ignored when it does not give the conclusion so many analysts want to see.
This analysis is published @ 07:49 p.m. EST.
Wow,
Someone bought 1000 /ES contracts this morning for a 7/1 Put to hit 1560. Interesting idea to buy way out of the money on the cheap. Still it would have to move along way for these to increase in value?
BUY +1,000 /ESU6 1/50 JUL 16 (Wk1) /EW1N6 1570 PUT @.20 LMT
My bad, should say 7/15 above. Still curious.
Anyone have a clue why UVXY is popping big after hours? SPY also down big…
Something is going on…
UVXY manipulated DOWN all day…..
Absolutely bizarre…. price went down but volatility declined (inverted VIX moved up) today
Bullish divergence. It indicates a bounce is coming. But we have recently seen this persist for three days before the bounce arrived. So price may still fall tomorrow…. but a bounce is coming.
I figured the same thing Lara. I bought some SPY calls right at the close… I’m thinking after hours market wanted to shake out some longs. And kudos to Olga for selling 25% of her position on that crazy bounce after hours. US futures are pointing higher atm…
These prices spikes after hours indicate that SPY wants to go up…
Thanks for the chart. Its definitely up now. I was just wondering what in the world took it down so much immediately after market close. And then when futures re-opened, it was up…
That’s weird!
ES 5:00PM Close 1982 down 9.00 from 4:00PM
This is 0.50 from the Low of the day of 1981.50
ES 4:00PM Close 1991
30 Year US Treasury Yield at 2.265% 5:23PM almost at it’s closing all time historical low of 2.25% Yield.
Bond money is “the smart money”… the BIG R & BIG D is here! You will all be hearing about it and reading about it in a couple of months.
UVXY with a $2 pop in after hours. Banksters held this beast down all day. We gap down again this may open at $20.
Sold 25% short after hours @ UVXY 16.50 (13.5% after hours gain!!???) – will let the remaining 25% ride tomorrow. Chances are that a lower low still won’t achieve that price but yer never know 🙂
Great move Olga!
Very savvy…
🙂
Laura , wanted to say thanks for your thoughts and encouragement last Wednesday Thursday . Your service help me to stay short for 100 plus SP points the last few days .
You’re welcome Fred. We should all be profiting very nicely today.
I’m holding onto my shorts for now, and looking to add to them while price is still within intermediate (1) territory.
Because when intermediate (3) is complete the following correction for (4) can’t move back up onto (1) territory.
HI Lara,
How many short positions do you keep at any one time?
So far maximum two.
But then I am aiming for more, to scale up as price falls, to add to my short each time price bounces.
Sideways movement looks like a small fourth wave triangle. No ratio between the first and third wave, so the fifth down tomorrow may = the first if it is 58.36 points in length.
Another down day tomorrow….
But first I need to see what VIX and RSI were up to today. So that musing comes with the caveat that I haven’t gone through my analysis process yet….
I’m rethinking how this third wave is going to behave. It looks like it may be more like intermediate waves (3) and (5) within primary 1, and less like primary 3 of the last bear market. In other words, a sheer drop with corrections that don’t show up on the daily chart for some time.
My preferred daily chart which sees minor 1 and 2 complete and this minor 3 down, I think there we really may be able to use the targets for intermediate (3) as targets to close shorts if this third wave behaves violently.
Just letting some idea percolate this morning…. when I’ve gone through the process of analysis it should be clearer.
Pretty sure the low isn’t in yet.
EURUSD looks like a good short trade too 🙂
Thanks Lara – do you have any thoughts on GBP:USD (don’t know if you trade it or not)? My long term count has it going near 1:1
I used to analyse that one daily and trade it…. but I haven’t even looked at in a long while. Time today to do that!
Will be updating counts and will publish a bunch of charts for all on here and on EWG for all members.
Very much appreciated!! 🙂 🙂
You’re welcome Olga. I am appreciating your involvement and posting charts here! It’s kinda like you’re a wing woman for when I sleep…. 🙂
I second the appreciation… 🙂
If we can finish below the round number 2000, then that is a feather in the bear’s cap.
Oh man. I show we missed by 0.56 points.
20min chart, if drops down for a little 5, then divergence on indicator(s) then would be a good buy, late in day though
I agree we need 1 more lower low in 5 waves – todays sidewave move looks complex (corrective) to me. Last move down made a slight lower low on my chart.
this is a 4th of some degree to the down, 5 to go yet, since day is over maybe take out low tomorrow morning then go up in a reversal; bullish engulfing candlestick
I agree, I’ll put it at the same degree as Friday’s down day which I’ll have as a first wave.
Now this is the fourth…. the third at 81.21 points has no ratio to the first
So the fifth to come tomorrow should have a ratio to one or three.
After analysis of the 5 minute chart and classic TA signals, this view changed.
Obviously.
little bear pennant here, typically a 4th wave, so 5 down yet on a 20min chart
I agree. We are running out of time today. I will look for a gap down open tomorrow and a finish of the fifth and final wave of this first impulse down. Then we move back up in a multi-day correction. I did not yet exit my shorts. Looking for tomorrow.
Had to keep telling myself that no one went bust by taking a profit today. Sold all my shorts at 2009 and kicked myself for not hanging in there but need to remember there will be plenty more moves ahead if you have the powder to throw at them
Also I opened an upward position at 1996. I hate myself for this as trading the counter trend was my biggest mistake in riding the 2007-2009 crisis but just felt right today
Would actually be nice to take a break but feel this is the oppurtunity we have all been waiting for. Just keep remembering “The trend is your friend” and keep with it until proven otherwise
Sorry just waffling on
Some very obvious divergences atm so very wise to take at least some profits here imho – especially if using leverage products. Snap backs will remain brutal until we get to the middle of P3. There should be plenty of opportunities to get back on board.
Short term risk / reward constantly changes as the count progresses.
SPX off 40 points and UVXY essentially flat
VIX is down 2.25 to 23.51………… Just Crazy!
NO FEAR… ZERO FEAR!
UVXY usually achieves it’s highest price at the end of 3rd wave.
There might also have been a bit more of a skew than usual due to Brexit panic trades.
Took 1/2 off short position
Perhaps minuette iv on Gary’s chart below may not be over yet. A ‘c’ wave up is yet needed above 2006.
very possible Rodney
SPX down over 2% atm, but VIX also down 8%.
I don’t recall seeing this kind of discrepancy…
Any thoughts on this? What it tells me is that we’re about to most likely have a big correction up… But the market overall is very bottom heavy…
I almost want to buy some UVXY puts here… (short term of course 🙂 )
I’ve been looking at the same thing. Also with SPY 60 cents off lows of day, UVXY over $1 off highs of day. Classic divergence but like you say, market bottom heavy here.
And UVXY is positive 5%. I think we are seeing BB pressure on the VIX daily holding it down. If it closes in the BB today, I think it will be signaling the multi-day upwards correction starts tomorrow. If it can finish above the daily BB today, then I think it buys another day or half a day before the correction.
On Friday VIX was up around 48%. That is one of the largest up days for VIX in history, percentage wise. So today we are seeing the pressure / resistance.
Volatility really not moving much……what did Lara mention when volatility is underperforming the down move?
bullish divergence
looks like minuette w(iii) did extend… so iv and v to of minute w(3)
Yep – if we make a lower low that count is my fav atm
Me too. I think we will not see the fifth wave until late this afternoon which would make a good set up for a gap up open tomorrow.
BTW Olga, regarding a coversation last Friday, you remembered correctly that I exited my short positions. But I re-entered my shorts on Friday AM. It cost me 8 cents in lost possible profits. So I am okay with that. Now I want to get out today.
Great move – I’m still short – just seeing what this current wave down does.
If this currently move is a 4th wave (which seems likely atm) it could go higher yet. The first move up from the lows is a clear 5 which would suggest it’s an (a) wave (though I could also count it as a double zig zag at a stretch).
I’ve just sold 50% of my short. Will re-purchase below todays lows for a scalp
From the high off last Thursday’s close, what if we are still in minute i from the main hourly wave count. So as of 13:30 we are in minutte 4?
1 – impulse, 2 – expanded flat, 3 – impulse, 4 – combination
Very nice Rudy. Thanks.
Back on line. What a nice day. I went for a walk with the dog right after the open. Came back and saw more good news. The 2025 resistance has been shattered. The 2000 round number has been penetrated. The 1991 pivot point provided a weak bounce going one now. If we can break the 1991 pivot the next stop is 1956. I am guessing that will be the end of the fifth wave down in this plunge. I also think it may be labeled by Lara as minute 1 or minor 3 of intermediate 1. I am looking to0 take profits between 1965 and 1956 then SOH for the 1st correction.
With your low targets, then 50% up from the high to your low(s) would be 2036ish.
Yes this has mostly 50% targets and retracements. that is a weakness of the count.
Interesting that it seems like the the SP bottomed (so far) when the EU markets closed.
I have no idea…what the count is. Anyone? Thank you in advance.
Few options on the table atm – this is one of them – invalid if we make new lows
long weekly SPY 201 calls…looks like short term low may be in
Plenty of +ve div on 1min chart – been a good ride down but might be getting close to switching sides. Still 100% short but on the lookout now for a reversal pattern to short ‘the beast’ 🙂
UVXY not really convincing with what appears to be a 20 point gap down open.
Barry,
Keep an eye on Put/Call ratio as I suspect some point in time during the trading day, we are likely to have a buy signal triggered. With FED induced liquidity, the ramp is going to be fast and furious JMHO.
If SPX were to open now SPX would be down 24.60… at 2012.81
UST 30 Year at a 2.30% this morning
Is Lara really targeting just 2000 for minor wave 3? Doesn’t seem very low to me?
Yes, I really was. It remains to be seen, but if tomorrow moves up then it looks like that target was fairly close.
It’s still intermediate (1) though.
Interesting….just got to my computer….I like to look at the change in open interests in the short term to see what money is doing….Friday, while we had a huge drop, open interest for the weeklies puts expiring in 3 days were deflating…while on the call sides, no real explosion. Makes me think we are range bound maybe for few days….
The only strike to actually increase was the 200 SPY….hummmm…..
I will post this daily if people want.
Folks let’s not forget what Fed said ahead of the Brexit vote. They are going to put enough liquidity short term to show that they are in control. Expecting a buy trigger tomorrow for a counter trend bounce.
Yup, so far relatively calm. I wonder if the BREXIT is sufficient for wave 3 to really get velocity underway or if something else needs to happen…
ES Futures Low 2004.25 but now at 2009.75 down 8.50
Friday 4.00PM Close for ES 2027.50
Friday 5.00PM Close for ES 2018.25
Now at 2005.00 … Down 22.50 from Friday 4.00PM Close
SPX Friday Close 2037.41
SPX Equivalent of Current ES price is 2014.91
Friday SPX Volume was 1.392 Billion (1,392.477 Million)….
You all should be able to quote it using:
Symbol $TVOLSP which is the S&P 500 Total Volume and is SPX Volume from what I have been told by my brokerage and is what I have been using all along.
2012 so far!!
How much support will the round 2000 give?
“Exchange-traded funds, meanwhile, bought $3 billion, which comes out to $12 billion on an annualized [2016] basis, significantly below $175 billion in purchases for 2015.” June 21st, David Kostin chief analyst of Goldman Sachs. Posting this quote again because I question whether ETF’s are ever going to make the big leaps upwards (bearish inverse ones) like when prior stock market drops occurred. 93% of money inflows to ETF’s have vanished just since 2015. Inflows:
$ 72 billion in 2011
$133 billion in 2012
$167 billion in 2013
$188 billion in 2014
$175 billion in 2015
$ 12 billion in 2016 (on annualized basis)
Is the ETF party over with?
Good article on companies exposed to BREXIT.
JPM Head Quant: Expect Up To $300 Billion In Program Selling, “5-10% Near-Term Downside To The S&P500”
“As we noted earlier this week, we expected a Brexit outcome to have an asymmetric impact for equities, with downside exacerbated by unwind of long equity investor positioning. In particular, increasing equity volatility would induce systematic strategies (Volatility Targeting, Risk Parity, CTAs) to start deleveraging their high equity exposure, resulting in $100-300 billion of selling.”
http://www.zerohedge.com/news/2016-06-26/jpm-head-quant-expect-300-billion-program-selling-5-10-near-term-downside-sp500?utm_source=feedburner&utm_medium=feed&utm_campaign=Feed%3A+zerohedge%2Ffeed+%28zero+hedge+-+on+a+long+enough+timeline%2C+the+survival+rate+for+everyone+drops+to+zero%29
Looks like Molson Coors Brewing top exposure to UK.
Showing price action after the 3pmCST close. 30 minute chart. Looks like a gap down for Monday. Bearish flag too. Anyone have a different alternative count?
As of 6/24 Dark Pool chatter suggests next support with 34 million shares at SPY $201.84 which puts SPX at 2019 and /ES at 1970 using correlation.
Using $GDOW correlation SPX could speed up and blow pass 2019 and hit /ES 1970 right away.
This would fit the WOLF (Weather Options Likely Forecast) of 90% chance below 1996.75 with a measley 100,000 contracts.
Sheesh! Dark pool is a dark ocean!!!!
I am trying to get an earlier view of Monday. Here is Bitcoin live on the 4H and it is declining which I think means the dollar is strengthening which makes sense in light of the current flee to safety with dollar perceived more safe and liquid than Bitcoin at the moment.
https://cryptowat.ch/bitfinex/btcusd/4h
Sunday afternoon will be super interesting to see what happens with Forex… Who is our expert on this blog? If you are a Forex Pro any comments much appreciated 🙂
Here is the FX answer:
“The calm is over. FX markets are open and Cable is currently down another 170 pips, testing 1.3500 once again. USDJPY is also sliding back below 102.00 as the world awaits China’s reaction with its official peg as offshore Yuan plunged on Friday…”
http://www.zerohedge.com/news/2016-06-26/currency-carnage-continues-cable-usdjpy-tumble-fx-markets-open?utm_source=feedburner&utm_medium=feed&utm_campaign=Feed%3A+zerohedge%2Ffeed+%28zero+hedge+-+on+a+long+enough+timeline%2C+the+survival+rate+for+everyone+drops+to+zero%29
Waiting on the Yuan response…
I show NYSE volume 669 from IBD…has hourly breakdown for Friday..
Did anyone else notice the one day island reversal top put in by the NYA (NYSE) this past week? If you look at SPY it was very close to doing the same thing. The implications are the same and they are very bearish.
Also, Ciovacco Capital uploaded a very good video on youtube yesterday. At the 10 minute mark, he does what I think is an outstanding analysis of volume over the past month or so.
Yes, an island reversal. Very rare.
And yes, as always outstanding solid TA from Ciovacco Capital. Well presented too.
I really have no idea why the NYSE shows lighter volume for Fridays down day. And I’m starting to think I need to ignore that data now… which is most frustrating after prior situations where I had to ignore StockCharts data and go with NYSE data….
I like reliable data. And I’m not getting it 🙁
“Since 1990 when the SPX has lost more than 1.5% on a Friday, Monday saw a lower low 87 / 91 times. 95.6%.” from an analyst at Breakpoint. Doesn’t say however how many times the price did make a lower low on the Mondays, then went up for the day.
Lara,
Thanks for the great analysis. I have a question. You write in the daily TA section,
————————————————————————————————————–
“Volume from NYSE indicates a decline in volume for Friday with 330.16mil compared to higher volume for Thursday of 525.31mil”
—————————————————————————————————————
However, the red volume bar on your daily chart for Friday shows the volume hugely larger than Thursday. I assume the volume on the chart is for SPX alone. My question is this, does not this SPX volume show strong support for the downward move in the SPX on Friday? It is massive relative to most other days. Since we are analyzing and counting the SPX, would not the SPX volume be very significant support to the bear count?
StockCharts and NYSE volume is sometimes different. I have concluded in the past that when they differ I will take volume analysis from NYSE data for the S&P500, not StockCharts. This seems reasonable because that is the home of the S&P500 so I’d expect their data to be the most accurate.
The fact that they differ so significantly for Fridays session is a concern though.
If it helps, I have Friday’s SPX Total Volume at…
1,392.477 Million
520.397 Million Thursday
There was also a big Russell rebalancing at Friday’s close. I am not sure how many S&P 500 stocks are also in the Russell Indexes. To the extent there is overlap between the two… the SPX volume would have been impacted.
MY number above 1,392.477 Million IS =
1.392 Billion
The Volume I post is TD Ameritrade date using Thinkorswim platform…. Usually very accurate to within 4 to 8 million on volume on SPX Total Volume $TVOL. Very accurate on price.
Lara I am afraid that 330 million figure for volume is grossly in error. Every data feed I have seen states over 1 billion shares were traded on Friday – about 1.4 billion.
I am at a complete loss to understand where they got that number. Something there is not right.
Total stock market volume was over 14 billion, highest since last August 24. That 330 million for SPX simply cannot be accurate.
I am too at a complete loss to understand why the NYSE, the home of the S&P500 is stating a volume of 330.16 for Friday, here.
Crikey, if you can’t trust the data given on the website of the NYSE, then what on earth is going on here?!?!
Because, as we all know, it makes a BIG difference.
Aaaarrgh! Most annoyed I am.
Anyway, there is still divergence with VIX and price… technically that should interpreted as bullish so that must be how I interpret it. It doesn’t mean it will be followed by a bounce Monday / Tuesday, but that must be a reasonable probability.
On Balance Volume has still come down to support, and so I’ll still be expecting a bounce Monday as fairly likely.
If I’m wrong then it may not materialise. Price may just keep falling. And if it’s supported that well by volume then that is a very real possibility.
There are some other strange things going on. One of brokerage accounts had a few days of missing candles on its charts.
🙁
That’s not good.
If the markets are seriously crashing then this may be the new normal for some time…. If not right now then at some time in the foreseeable future.
My technical issues are resolved, and I’ll be home tomorrow.
It appears the daily volume number on the NYSE webpage is not fully updated yet. If you look at a lower time frame, for example 5 minute data, the volume doesn’t add up to the daily total of 330 mil. My guess is that daily number will soon be adjusted upward. Looking at the smaller time frame data indicates the volume was quite high on Friday. The last 5 minute bar alone shows 509 million. The entire day adds up to 1.4 billion. That correlates better with the pattern seen on other data sources, indicating the volume for Friday was much higher than previous days.
I am still fully short, hoping for a waterfall Monday 🙂
Thank you.
This week’s weekly candlestick including the upper and lower wicks is longer than any candlestick from the start of the rally off the Feb 2016 lows. This is an indication that the movement from the Feb low to the June high is over. Just one piece of evidence indicting the trend has reversed.
Rodney you mentioned that unusually long lower wick on VIX and I was doing a bit of digging and what I discovered is exactly what I expected. A lot of eager beavers are assuming that VIX at these levels is a one-way bet for a short side trade in a knee-jerk reaction to its rocketing upwards. I hope they are paying attention to that long wick. Anyone shorting at the lower tick is already seriously under water as those lower levels have been forcefully rejected. It looks to me like they have jumped the gun and inadvertently produced the exact opposite signal of the one they should have been looking for prior to entering short. I hope the market gives them time to cover. I hope they are not trading on margin.
As an aside, I assumed if my reasoning was right I should see a long upper wick on the VIX inverse ETF as folk prematurely piled into that instrument in anticipation that the
banksters would put a speedy halt to the market’s swoon. I have posted a chart that gives the answer to that fascinating query…
I cannot blame them for jumping early. The lower BB penetration is usually a good set up. They may get a brief window on Monday to escape with intact hineys… 🙂
I think the theme for Monday is now “Wick way does she go?” 😉
Wick way indeed! 🙂
Reminds me of one of my favorite Steely Dan tunes:
“Wicky, don’t loose that number!” 🙂
Ah Steely Dan! They’ve been one of my favourite bands since I was young. I saw them when they last came to NZ about three years ago now. They’re so fantastic!
https://www.youtube.com/watch?v=UfZWp-hGCdA 🙂
I always liked the slightly weirder tracks… Gold Teeth was one of my favourites.
They were just one of a multitude of great bands and great music. 1974 was a good year for me. I was in love with the woman I have been married to now 40 years this next month.
That’s most fantastic Rodney, well done!
Awesome! 25 years here to a wonderful woman. Cheers!
One can reasonably assume that many are trading on margin for a VIX position as well as all sorts of positions. Margin is cheap! If we get a correction up to 2083 or so on Monday and Tuesday. Wednesday or Thursday is when we might see margin calls being issued en mass. However, if we go down strong on Monday, we might see the margin calls on Monday or Tuesday. Calling in margin will crush a market faster than anything else because it is accompanied by mass fear. “Get me out at any cost! Now!”
So you are assuming that the brokers will view any bounce as an opportunity for those underwater to escape with at least a portion of their hiny intact?
That would be a concession to a continuing downtrend it seems to me. You mean they no longer think the banksters are going to save them??!! 🙂
That is one big wick on the SPY and compared to the last two corrections (8/18 & 12/30) from the top, it is looking pretty significant:
http://stockcharts.com/h-sc/ui?s=SPY&p=D&b=5&g=0&id=p33678137880
Note: This huge upper shadow / wick follows a failed breakout attempt to the upside. The 8th failure since May 2015. Failed breakouts can produce a very sharp reversal as we are witnessing for the 3rd time since May 2015.
Thanks for all the articles / links, Jim.
Good article by John Mauldin on where we find over selves Politically and Economically. More pain to come as we reset. We are in eye of the hurricane of the fourth turning.
“Generational Chaos Ahead” by John Mauldin: http://www.mauldineconomics.com/frontlinethoughts/generational-chaos-ahead
Thank you Jim for linking to that article. Most interesting!
Swan Chart
Could be a cascading effect. Keep an eye on China.
This is getting curioser and curioser! Apparently folk are now blaming Angela Merkel for not doing more to convince the Brits to remain in the EU!
ANGEGLA MERKEL???!!!
The same person now listlessly presiding over the disintegration of German society by her reckless and ridiculous immigration scheme? I have professor friend whose parents now want to move to the US because of the chaos in Germany.
Why on earth does anyone in their right mind think UK citizens would be interested in anything this Frau has to say, the veritable poster child for all that is so very wrong with the EU?!
Incredible!
Rather than respond with some sorely needed humility, with some indication they would seriously consider the implications of the stinging rebuke of the UK vote, EU finance ministers have decided double down on their hubris. They are now telling the UK to “hurry up and leave!” Their demented delusion knows no bounds. They apparently have no clue that their heavy-handed abuse of their EU client states, and insane immigration policy that is destroying centuries old cultures and communities might warrant some re-consideration. If ever one needed any indication that the EU’s days are numbered, there you have it…what fools these (EU) mortals be!!
The sad part is the UK still has a lot of bank exposure to the EU despite BREXIT.
Germany will want to crush the UK so other countries will think twice about an EU exit. Already anti EU factions all over the EU are drumming up support for referendums, especially Italy and the Netherlands. Germany will want to make it obvious leaving the EU is a painful and damaging experience. This separation will be a nasty divorce and Germany will want to smack down exiting members in the harshest possible way. This probably won’t stop the collapse of the EU, but most likely will serve to fire up nationalistic conflicts and resentments.
Continuing my musings on various VIX vicissitudes, in addition to the exception of the second close below the BB not always being bullish for equities, we also have the matter of price divergence with SPX. There is no question that it is far more often than not a portent of at least a medium term trend reversal. The last time VIX traded at its current level was on Feb 09, with SPX at 1839.94 and just two days from a significant low. As someone said, while history does not always repeat itself, it often rhymes. I will pose the same question I did a few days ago with regard to VIX, SPX price divergence. Could it perhaps in this case be sending the atypical signal that instead of an impending trend reversal to the upside, perhaps SPX has some catching up to do to the downside? If the pattern rhymes, we should see at least one more VIX red candle before a capitulation spike back above the BB. This wave down just might conclude with greater rapidity than many anticipate. It often takes a very close second look to recognize when these signals are saying the exact opposite of what they usually mean, and I am sure glad I demurred on my good friend and master trader Jeff Clark’s contention that this week was a good time to be long equities. The market is always right!
According to $GDOW correlation: SPX should be at 1926. SPX is showing signs it wants to catch up. (SPX is white, $GDOW G/R)
I concur! 🙂
VIX may be hinting same…
2007 pattern being repeated right now? Another “Push Away???”
http://blog.kimblechartingsolutions.com/2016/06/2007-pattern-being-repeated-right-now-another-push-away/
British Pound broke historic support.
http://jlfmi.tumblr.com/post/146427293440/not-your-everyday-pounding
“Today Is The Appetizer For Monday”
“I do feel that Monday is where we’re going to see a truer-look at “where the bodies are buried” and a more accurate “price discovery” process than what we’re seeing today (as we’re washing out all the delta one flows which are dwarfing client trading)…lots of discipline being displayed thus far, with low turnovers and folks not chasing. ”
http://www.zerohedge.com/news/2016-06-24/today-appetizer-monday?utm_source=feedburner&utm_medium=feed&utm_campaign=Feed%3A+zerohedge%2Ffeed+%28zero+hedge+-+on+a+long+enough+timeline%2C+the+survival+rate+for+everyone+drops+to+zero%29
Hello Everyone,
I am going to try a new forecasting method and post here to see if this has any ability to help us out. Then I will track over time if it proved to be correct and post that record with each forecast.
***So fair warning I have no idea if this is going to work but the math is sound.***
Hence going forward I am going to call this the WOLF or Weather Options Likely Forecast (Copyright) in case this thing works 😉
WOLF for 7/15/2016 for /ES:
There is a 90% chance that /ES will be greater than 2031.54 or less than 1996.75. The expiring option ratio of Call/Put is .22 or about 5:1 in favor of Puts so the conclusion is we will be below *1996.75.
This forecast has a prediction strength of 97,171 open contracts.
**This forecast is based on statistics and the combined option trader sentiment based on open options for ./EW3N6C2015 and is subject to change as traders readjust their positions to reality and assumes the holders of these options are more smart than dumb 🙂
Cheers!
P.S. This forecast is produced by a team of 3 crack analysts. Myself and my two cats who have an excellent track record of predicting where mice are going to be.
Jim
Jim…one thought:
Should you do the ratio call/put for only in the money? Don’t they say smart money is usually in the money with options?
Let me know what you think? Curious to know what that ratio turns out to be
Interesting observation. I need to think about that…
For example last week there was a huge open interest at 2050 and 2000 and the gangster made sure the 2000 expired worthless! Out of money is often gamblers…not always though. I would do both and see what the difference is
Following is an example of what individual investors the world over are hearing from their investment advisors. It shows that the masses are yet unaware of what is about to take place. It is amazing what naivety is displayed.
————————————————————————————————————————–
So Britain is leaving the EU. You may also have noticed that the stock market is in flux because of all the hoopla. Be of good cheer, regardless of what the media prognosticators may say or what the stock market may temporarily do in response. We and those economists that we consider worth listening to, expect nothing negative long term to impact your investments from this long anticipated development. Some even predict an opposite effect.
Remember that the stock market’s ebb and flow is largely connected to the collective investor sentiment du jour. And that doesn’t necessarily have anything to do with real world concerns but is more a result of sentiment and often-times, uncertainty promoted by media. What we are actually investing in are companies, not politics. More specifically, companies that are currently enjoying great success and are expected to continue doing so.
So what we should all do now is simply nothing. Ride out this blip until the gradual calming of the investor sentiments produces the natural market rebound that we confidently anticipate.
We are here if you have any concerns regarding your investments and welcome a conversation. In the meantime, we’ll be in touch if there’s anything significant to report.
————————————————————————————————————————
It is so sad it is almost comical. “We’ll be in touch if there is anything significant to report.” Hello! the DJIA fell over 600 points in one of its worst days in history! While I feel sorry for all those who have no idea what is happening, I am encouraged that the current bear counts are correct. The devastation is about to begin. I wonder what they will be saying as we break the 1500 price on SPX. They expect nothing negative long term. So sad.
You know I got the same thing from my banker yesterday, Bronfman E.L. Rothschild, two pages long and saying absolutely nothing! It is as if the same person wrote as what you posted. Can’t produce it here as it is copyrighted. Of course they are very conservative but they are towing the party line and clueless of what is happening with all the debt issues in the world.
http://www.belr.com/
Anyone would think it is in their interest to keep people in the burning theatre for as long as possible /sarc 🙂
But then – most ‘advisors’ probably believe their own waffle. I say most as I’ll bet the guys at the top of the chain have quietly moved their own interests to far safer places.
I posted a chart earlier this week (Tuesday) where Jeff Clark of Stansberry Research suggested it was time to buy stocks. He argued (and correctly) that a second close below the upper BB by VIX was generally bullish for stocks, at least in the short term.
At that time I expressed my reservations about that call, in no small part because of the massive green candle that VIX was printing that day. Well, on Thursday Jeff Clark looked like a genius, and I felt a bit sheepish as the market went on a tear, at least for a day! Sometimes an upper band penetration by VIX is just a warm-up for the real action and we saw a similar fat green candle Jan 13 after VIX upper BB penetrations on Jan 7,8, and 11.
We all know what happened subsequently. I mentioned my thesis about the big VIX candle being a massive short seller and the monster ramp up on Thursday being a CB assault on the trade and did a bit of poking around. It would seem we have a perpetrator, well know for these kinds of bets. His name? George Soros! Looks like he is already on the winning side of that trade. Follow the money, or in this case the VIX candles! These kind of plays do not always work in the trader’s favour. I mentioned the huge bets on the Brexit vote that predicted a remain win. The traders rolled most the massive profits on Thursday into higher strikes and were in the trade still as the results came Thursday evening. The bids on those contracts collapsed from around three to five points in the money to almost zero in a matter of hours! Five million went poof! Ouch!
Here is that chart again in case you missed it.
Hi Verne,
Very helpful. What causes the months to turn red or green on your chart?
Thanks,
Jim
Due to my forgetfulness in not bringing a power cable the video will be recorded and uploaded tomorrow morning my time. Just so you all know, it will be done and it will be ready during your weekend. I didn’t forget to do it 🙂
Awesome!!Thanks for your hard work Lara!!Very much appreciated, hope you enjoy your weekend!!
You know, since that clink we did, the market kept falling and didn’t look back, here’s another one for our profits this week and for the markets “behaving” next week 🙂 (clink)
Friends are over to celebrate the great Brexit vote, opened a 2003 bottle of Champagne Taittlinger and proceeding to rejoice for the people of the UK into the wee hours. May your trading be successful!
Nice Peter!! Enjoy!
Enjoy!! Im at the beach celebrating too! One of the best trading weeks of my career
how bout that, been a while,, oh no, I see Ramona beat me to it
Not by much Doc. It was a closer race than the Brexit vote.
Numero uno.