
Upwards movement continued and a green candlestick fits the Elliott wave count perfectly. The target remains the same, but I am adding a second (lower probability) target for you today.
Summary: The first target for this upwards movement to end is at 2,035. If price keeps going up through this first target the next target is at 2,191, although this has a low probability.
Click on charts to enlarge.
Bull Wave Count
I will favour neither the bull or bear wave count. Both are viable and both expect this current upwards impulse to end. When the trend change arrives I will let price illustrate which wave count is correct by looking at the structure and depth of downwards movement.
To see a weekly chart with subdivisions and how to draw trend lines and channels click here.
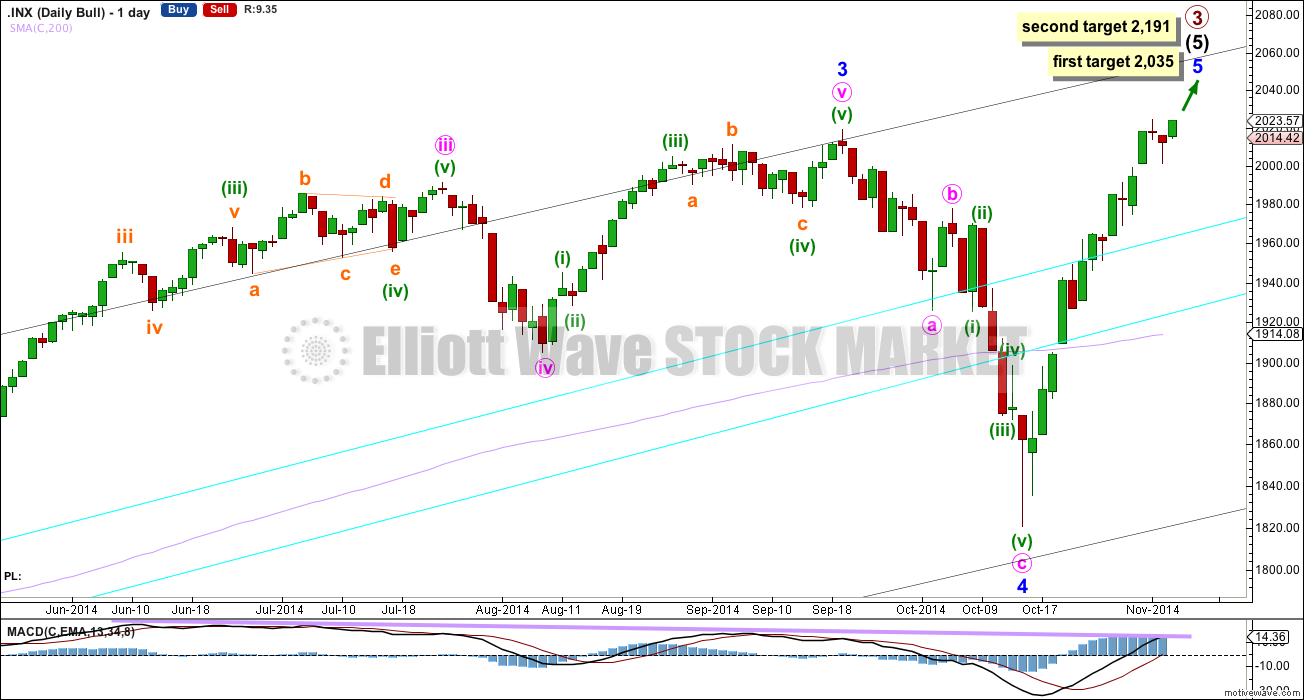
Upwards movement from the low at 666.79 subdivides as an almost complete 5-3-5. For the bull wave count this is seen as primary waves 1-2-3.
Within intermediate wave (5) minor wave 2 is an expanded flat and minor wave 4 is a zigzag. Minor wave 3 is 14.29 points longer than 1.618 the length of minor wave 1. Because there is already a close Fibonacci ratio between minor waves 3 and 1 I would not expect to see a Fibonacci ratio for minor wave 5.
The aqua blue trend lines are traditional technical analysis trend lines. These lines are long held, repeatedly tested, and shallow enough to be highly technically significant. When the lower of these double trend lines is breached by a close of 3% or more of market value that should indicate a sizeable trend change.
There is now double technical divergence between MACD and price at the weekly chart level.
There is also technical divergence between price and MACD at the daily chart level.
Within minor wave 5 no second wave correction may move beyond the start of its first wave below 1,820.66.
When this final upwards impulse of minor wave 5 is a complete structure I will have an alternate wave count which moves the degree of labelling within minor wave 5 all down one degree, because a five upwards structure may be just minute wave i within minor wave 5.
Minor wave 5 may extend, and this idea fits with the second target. The first target is calculated at the hourly chart level, and price may find resistance at the upper edge of the black channel.
At 2,191 primary wave 3 would reach 1.618 the length of primary wave 1. This would see intermediate wave (5) and minor wave 5 within it both extended. This is possible, but unlikely. Continuing divergence at the weekly and daily chart levels indicates this wave may end sooner.
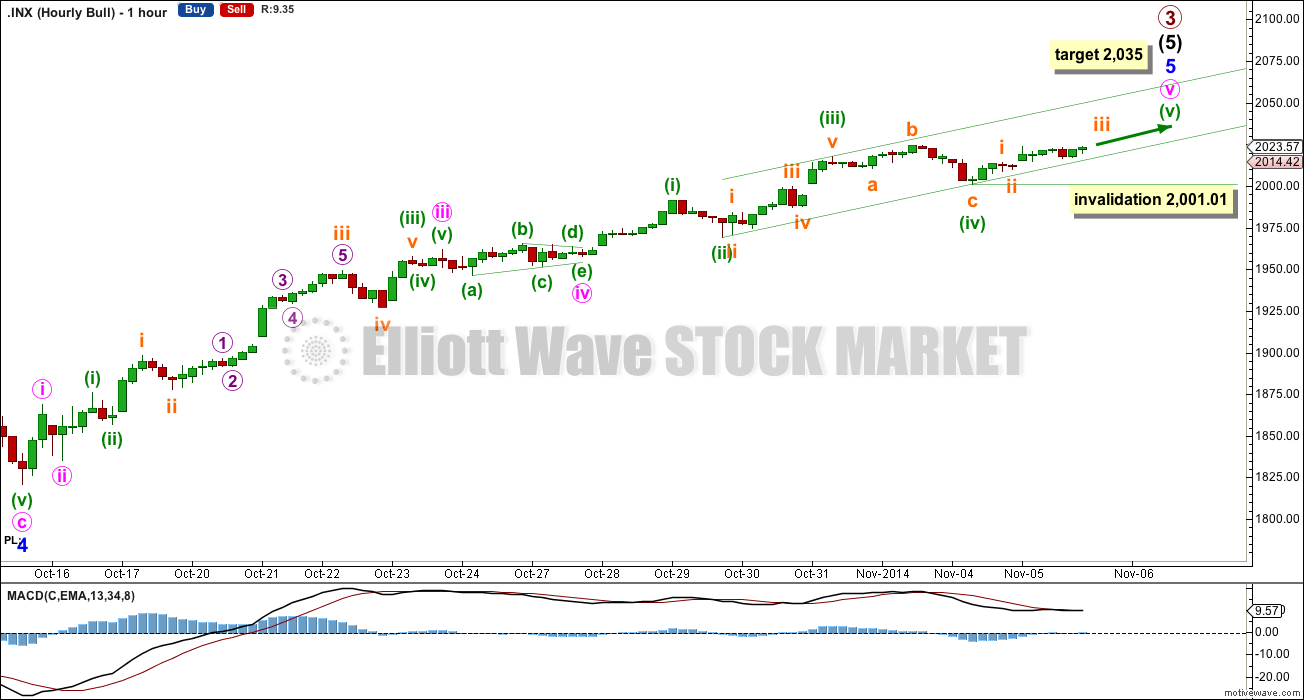
Upwards movement continues as expected from last analysis, and is contained within the small channel about this very final fifth wave.
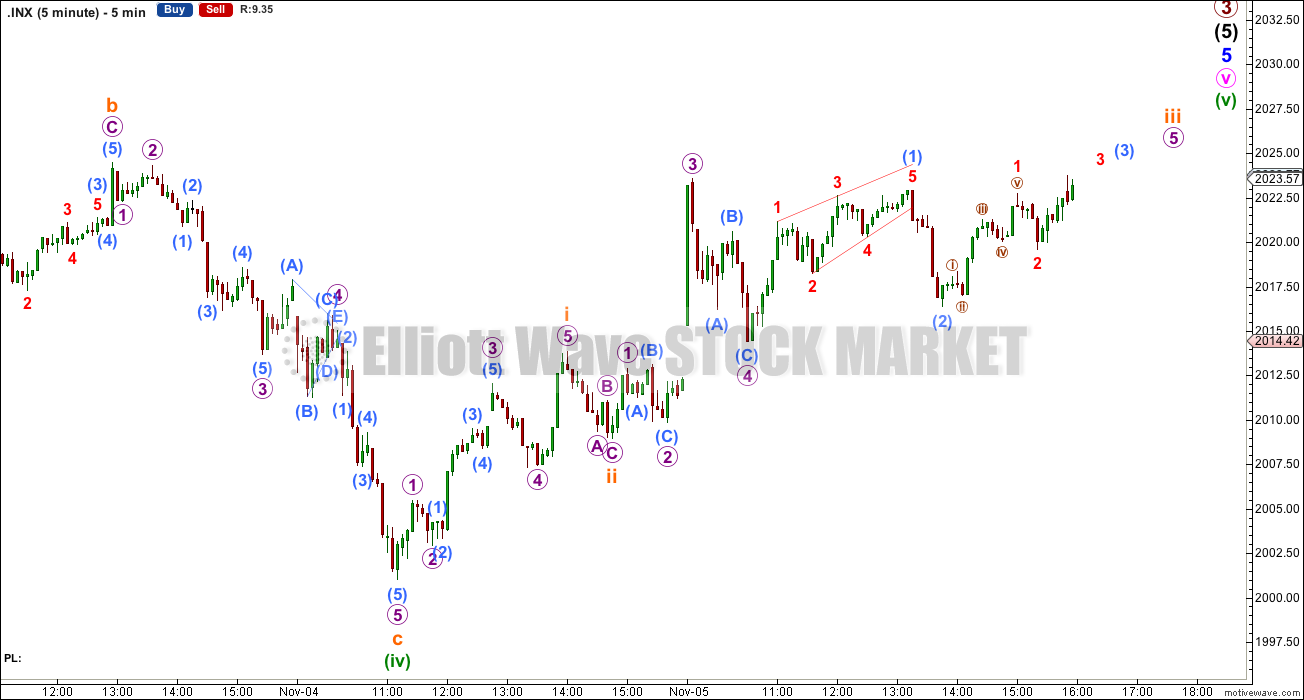
At 2,035 minuette wave (v) would reach equality in length with minuette wave (i). Because there is no Fibonacci ratio between minuet waves (iii) and (i) it is more likely we shall see a Fibonacci ratio for this final fifth wave. On the five minute chart the structure within minuette wave (v) is incomplete.
The target is best calculated at minuette wave degree because at minute, minor and intermediate wave degrees there are already very good Fibonacci ratios between their first and third waves. The S&P 500 often exhibits Fibonacci ratios between only two of its three actionary waves within an impulse.
Draw the channel about minute wave v using Elliott’s second technique: draw the first trend line from the ends of minuette waves (ii) to (iv), then place a parallel copy on the end of minuette wave (iii). I would expect minuette wave (v) to remain contained within the lower half of this channel. When this channel is breached by clear downwards movement (not just sideways movement) that may be the earliest indication that this upwards structure is complete.
Within minuette wave (v) no second wave correction may move beyond the start of its first wave below 2,001.01.
Bear Wave Count
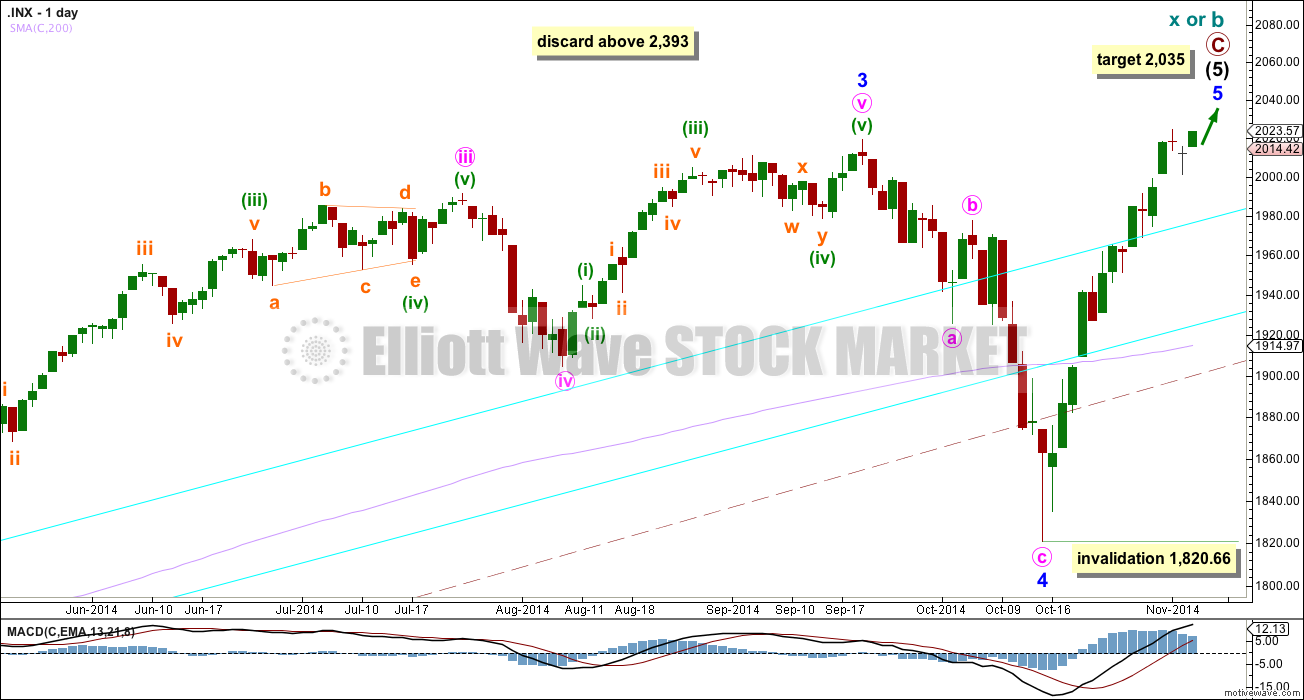
This bear wave count differs from the bull wave count at the monthly chart level and at super cycle wave degree. To see the historic picture go here.
The subdivisions within primary waves A-B-C are seen in absolutely exactly the same way as primary waves 1-2-3 for the bull wave count.
For both wave counts when minor wave 5 is a complete structure on the hourly and five minute charts then I will have an alternate wave count which moves the degree of labelling within it all down one degree. A completion of a five wave impulse up within minor wave 5 may be either minor wave 5 in its entirety, or it may only be minute wave i within minor wave 5. This is why I am leaving the invalidation point at 1,820.66.
At cycle degree wave b is over the maximum common length of 138% the length of cycle wave a, at 157% the length of cycle wave a. At 2,393 cycle wave b would be twice the length of cycle wave a and at that point this bear wave count should be discarded.
This analysis is published about 06:39 p.m. EST.