
Upwards movement invalidated the hourly wave count yet again. I have been struggling with the wave count for the S&P 500 over the last four weeks. Today I think I have found the answer as to why.
Summary: Minor wave B is incomplete and should move higher. The short term target for tomorrow is 1,890 to 1,891. Movement above 1,894 has a low probability.
This analysis is published about 06:45 p.m. EST. Click on charts to enlarge.
Bullish Wave Count.
The aqua blue trend lines are critical for all wave counts. Draw the first trend line from the low of 1,158.66 on 25th November, 2011 to the next swing low at 1,266.74 on 4th June, 2012. Create a parallel copy and place it on the low at 1,560.33 on 24th June, 2013. While price remains above the lower of these two aqua blue trend lines we must assume the trend remains upwards. This is the main reason for the bullish wave count being my main wave count.
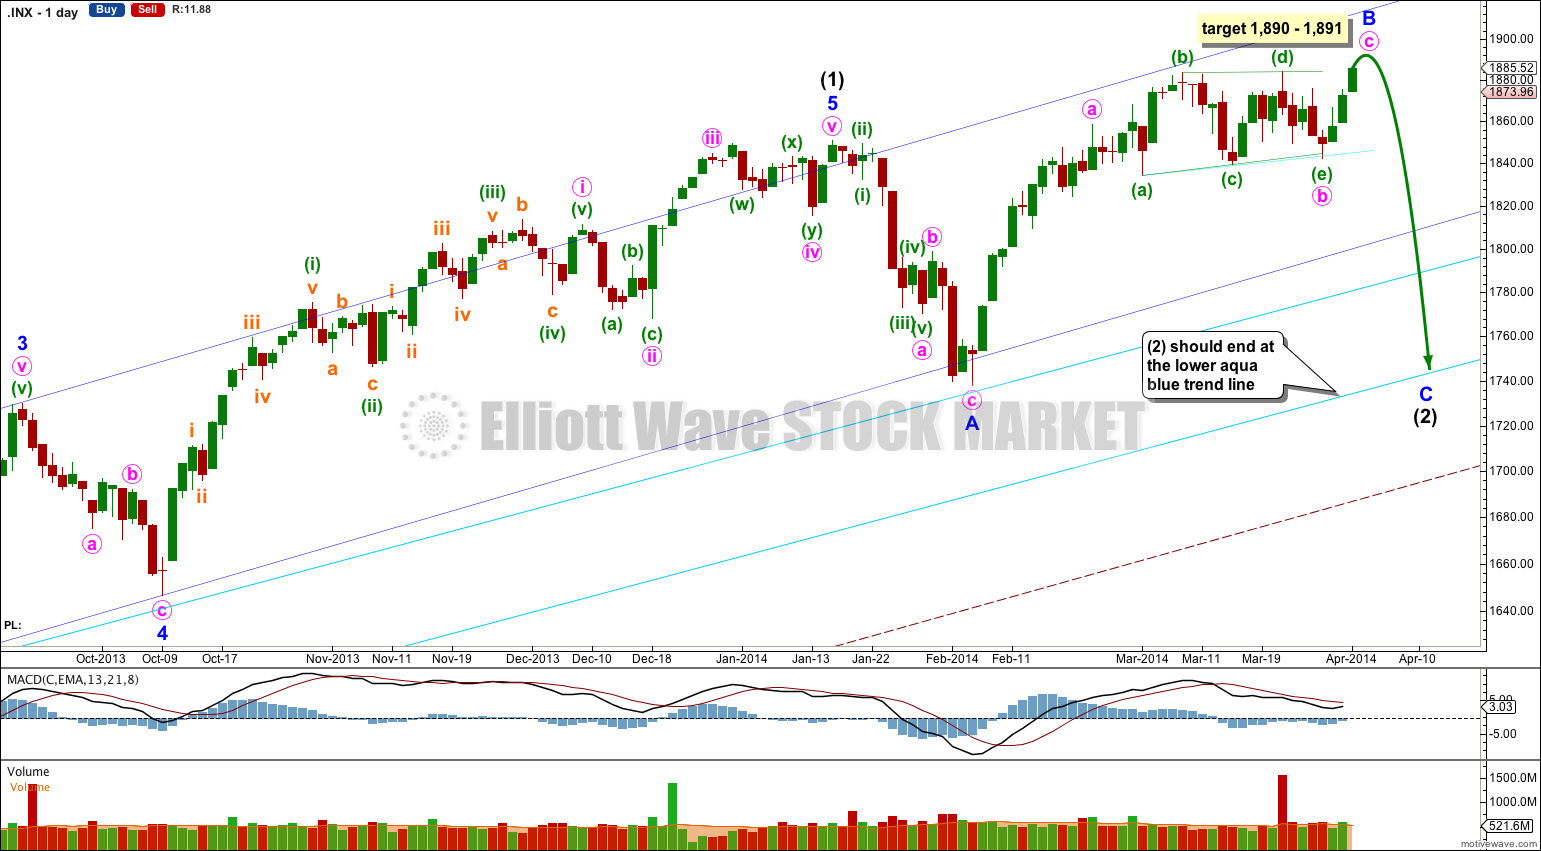
This bullish wave count expects a new bull market began at 666.79 for a cycle wave V. Within cycle wave V primary waves 1 and 2 are complete. Within primary wave 3 intermediate wave (1) is complete at 1,850.84. Intermediate wave (2) is continuing as an expanded flat correction.
Intermediate wave (2) should find strong support at the lower of the two aqua blue trend lines. It is very unlikely to be over at the low labeled minor wave A because it would not have breached the dark blue channel containing intermediate wave (1), and it would be a remarkably brief intermediate degree correction.
For this bullish wave count when intermediate wave (2) is complete then very strong sustained upwards movement would be expected as an intermediate degree third wave within a primary degree third wave upwards unfolds.
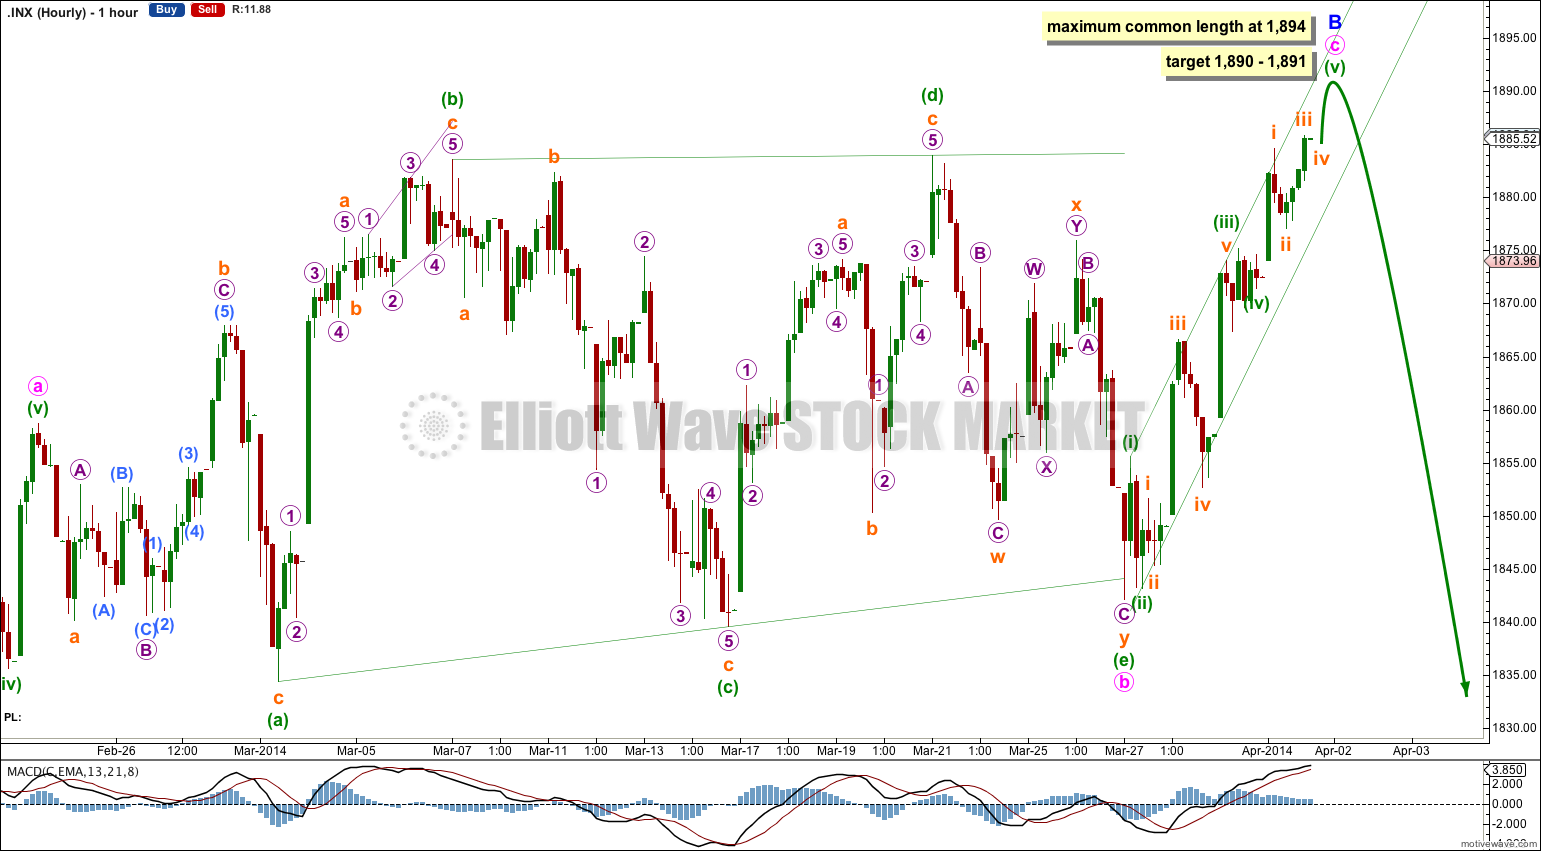
Minor wave B is an incomplete zigzag. Within it the last four weeks of choppy, overlapping sideways movement subdivides perfectly as a complete barrier triangle for minute wave b.
At 1,891 minute wave c would reach equality in length with the widest part of the triangle.
Within minute wave c there is no Fibonacci ratio between minuette waves (i) and (iii). This makes it more likely we shall see a Fibonacci ratio between minuette wave (v) and either of (i) or (iii). At 1,890 minuette wave (v) would reach 0.618 the length of minuette wave (iii).
Within minute wave c minuette wave (iv) was a barrier triangle. When fourth waves subdivide as barrier triangles the following fifth waves are usually either very brief or very long extensions. I expect minuette wave (v) is extending. If the target is wrong it may be too low, although at 1,890 minuette wave (v) would still be extended in comparison to minuette wave (i).
At 1,894 minor wave B in its entirety would reach 138% the length of minor wave A. As this is the maximum common length of a B wave within a flat correction it is likely minor wave B will end before this point.
I have used Elliott’s first technique to draw a channel about minute wave c. Draw the first trend line from the highs of minuette waves (i) to (iii), then place a parallel copy upon the low of minuette wave (ii). When this small channel is very clearly breached by downwards movement we shall have our first indication that minor wave B may be over. I would expect it to end tomorrow.
Bearish Alternate Wave Count.
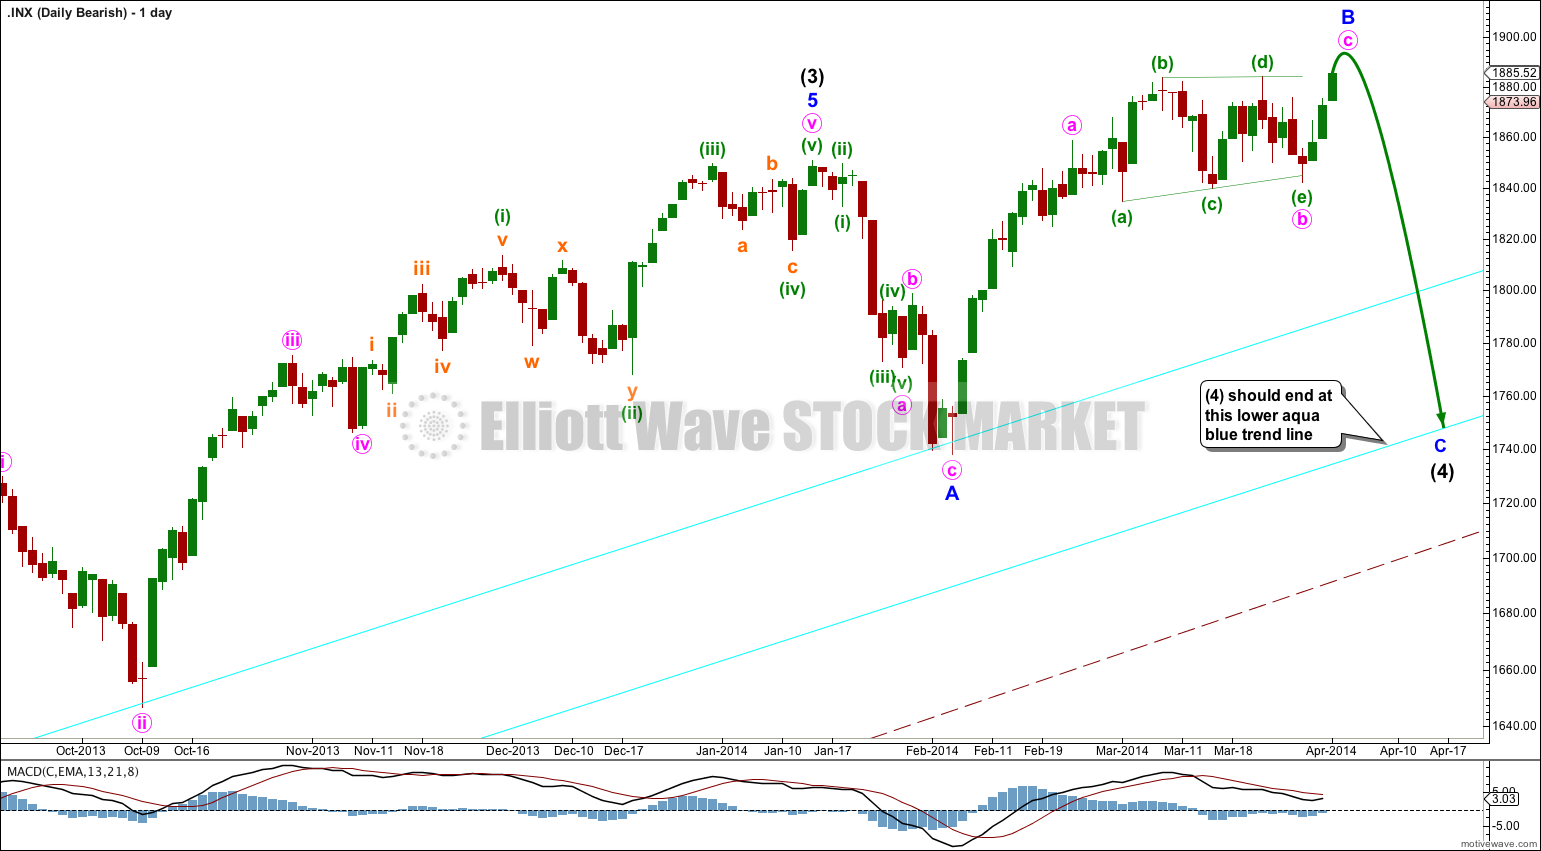
This bearish wave count expects that the correction was not over at 666.79, and that may have been just cycle wave a of a huge expanded flat for a super cycle wave II. Cycle wave b upwards is a close to complete zigzag.
Within flat corrections the maximum common length of B waves in relation to A waves is 138%. So far cycle wave b is a 141% correction of cycle wave a. For this reason only this wave count is an alternate.
Within primary wave C of the zigzag intermediate wave (4) would be incomplete.
The subdivisions for intermediate wave (4) would be the same as the main wave count for intermediate wave (2). I would expect it to end at the lower aqua blue trend line.
At 2,190 primary wave C would reach 1.618 the length of primary wave A. When intermediate wave (4) is complete I would recalculate this target at intermediate degree. I have found Fibonacci ratios between actionary waves (1, 3 and 5) of impulses are more reliable than between A and C waves within zigzags for the S&P500.
If intermediate wave (5) lasts about five to six months it may end about October this year.
Hi Lara,
Is this wave count invalidated above 1894? If not, how much higher can it go before wave B ends?
There is no maximum length for a B wave within a flat correction, and I have seen plenty which are longer than the common length of 138% (as given by Frost and Prechter). Once the B wave is twice the length of the A wave the idea of a flat unfolding should be discarded, but it is not technically invalidated.
Unfortunately this is one of those situations where EW cannot provide a black and white answer.
I expect that you are right. The last 6 weeks have been painful.
I’ll watch developments tomorrow. These erratic markets shake confidence. Thanks for the diligent and persistent effort.