
Downwards movement was as expected. The short term target was at 1,856. Price reached down to 1,854.38.
There is now a clear channel breach of the pink channel containing minor wave B upwards. This is confirmation that there has been a trend change at minor degree.
The wave count remains the same.
Summary: I expect more downwards movement tomorrow with some increase in downwards momentum. If tomorrow produces a candlestick below the pink channel on the daily chart we shall have confirmation that the minor degree trend is down.
This analysis is published about 4:45 p.m. EST. Click on charts to enlarge.
Bullish Wave Count.
The aqua blue trend lines are critical for all wave counts. Draw the first trend line from the low of 1,158.66 on 25th November, 2011 to the next swing low at 1,266.74 on 4th June, 2012. Create a parallel copy and place it on the low at 1,560.33 on 24th June, 2013. While price remains above the lower of these two aqua blue trend lines we must assume the trend remains upwards. This is the main reason for the bullish wave count being my main wave count.
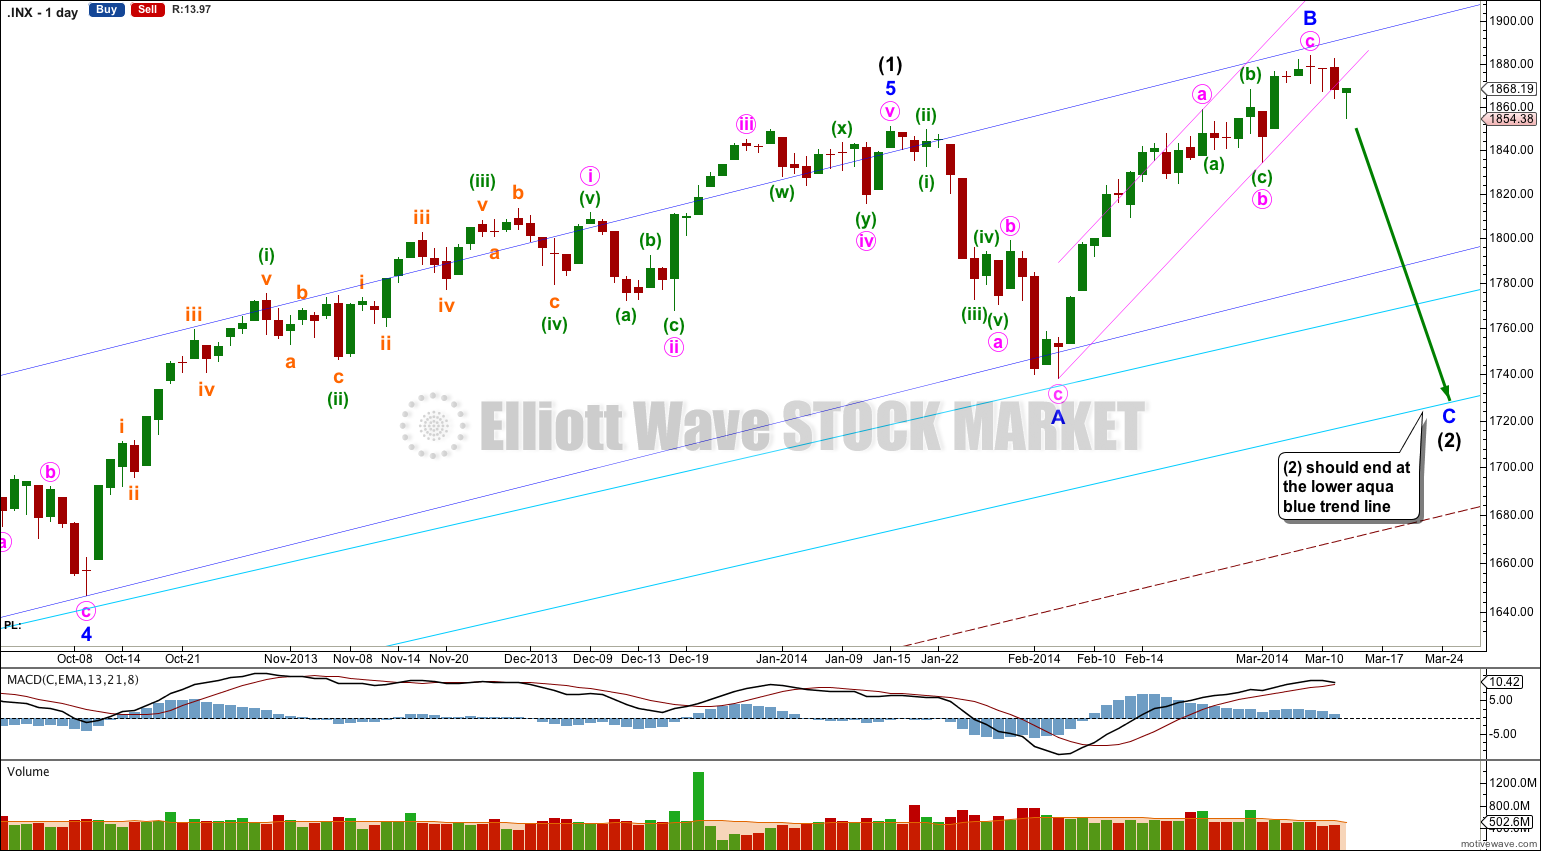
This bullish wave count expects a new bull market began at 666.79 for a cycle wave V. Within cycle wave V primary waves 1 and 2 are complete. Within primary wave 3 intermediate wave (1) is complete at 1,850.84. Intermediate wave (2) is continuing as an expanded flat correction.
Intermediate wave (2) should find strong support at the lower of the two aqua blue trend lines. Minor wave A lasted 14 days and minor wave B lasted a Fibonacci 21 days. I would expect minor wave C to be of a similar duration and to last about three to four weeks in total.
For this bullish wave count when intermediate wave (2) is complete then very strong sustained upwards movement would be expected as an intermediate degree third wave within a primary degree third wave upwards unfolds.
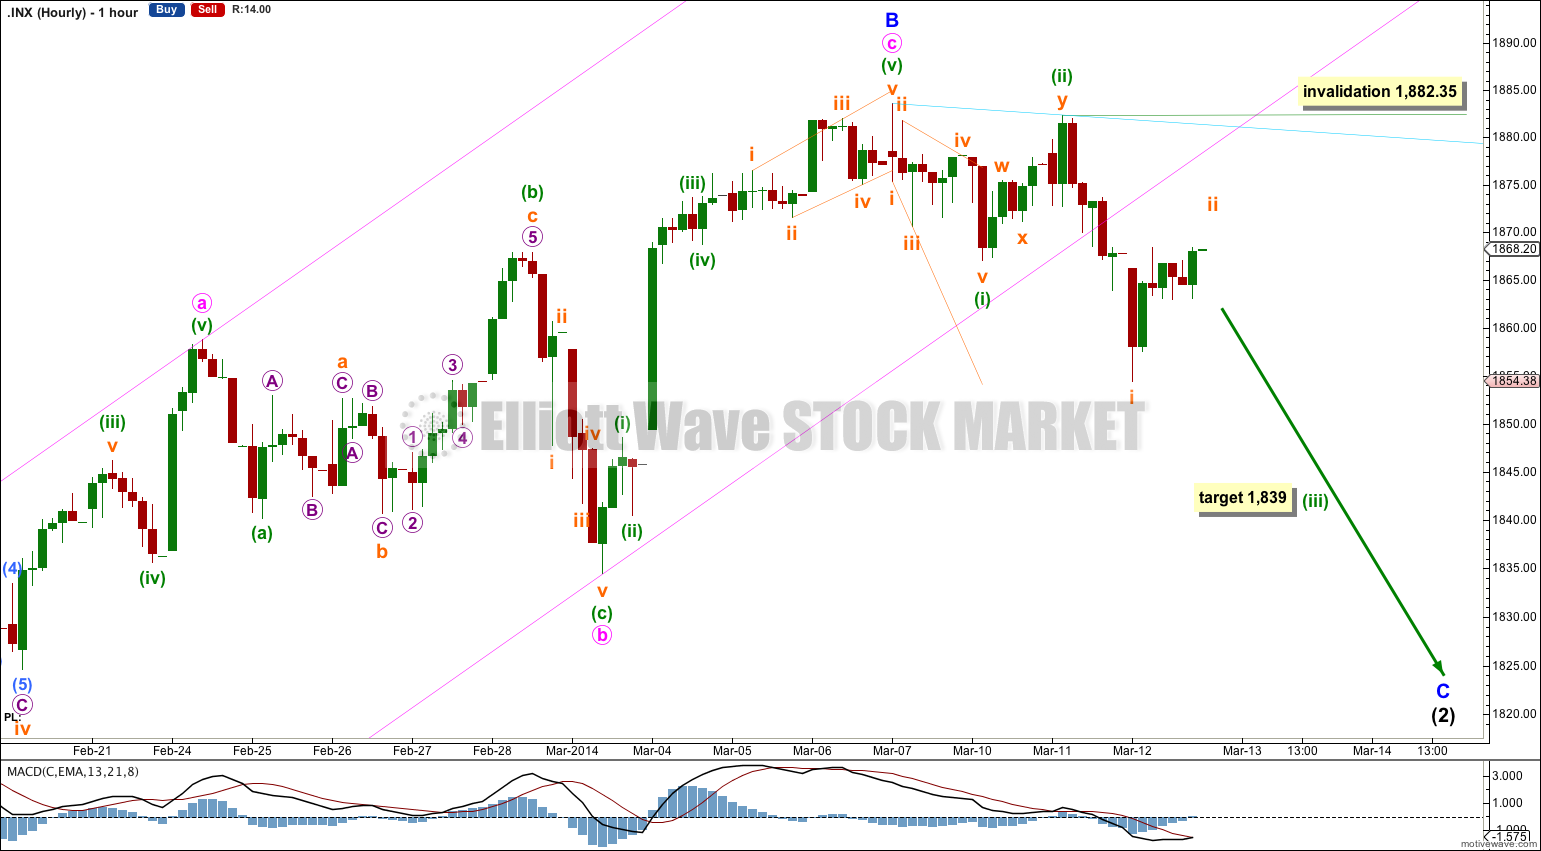
Although the target for minuette wave (iii) at 1,856 was met that was not the end of minuette wave (iii). Subsequent upwards movement has moved back into minuette wave (i) price territory and so cannot be minuette wave (iv).
A new target for minuette wave (iii) is calculated. At 1,839 minuette wave (iii) would reach 2.618 the length of minuettte wave (i). When subminuette waves iii and iv within minuette wave (iii) are complete then I will add to this target calculation at a second wave degree, so it may widen to a small zone or it may change.
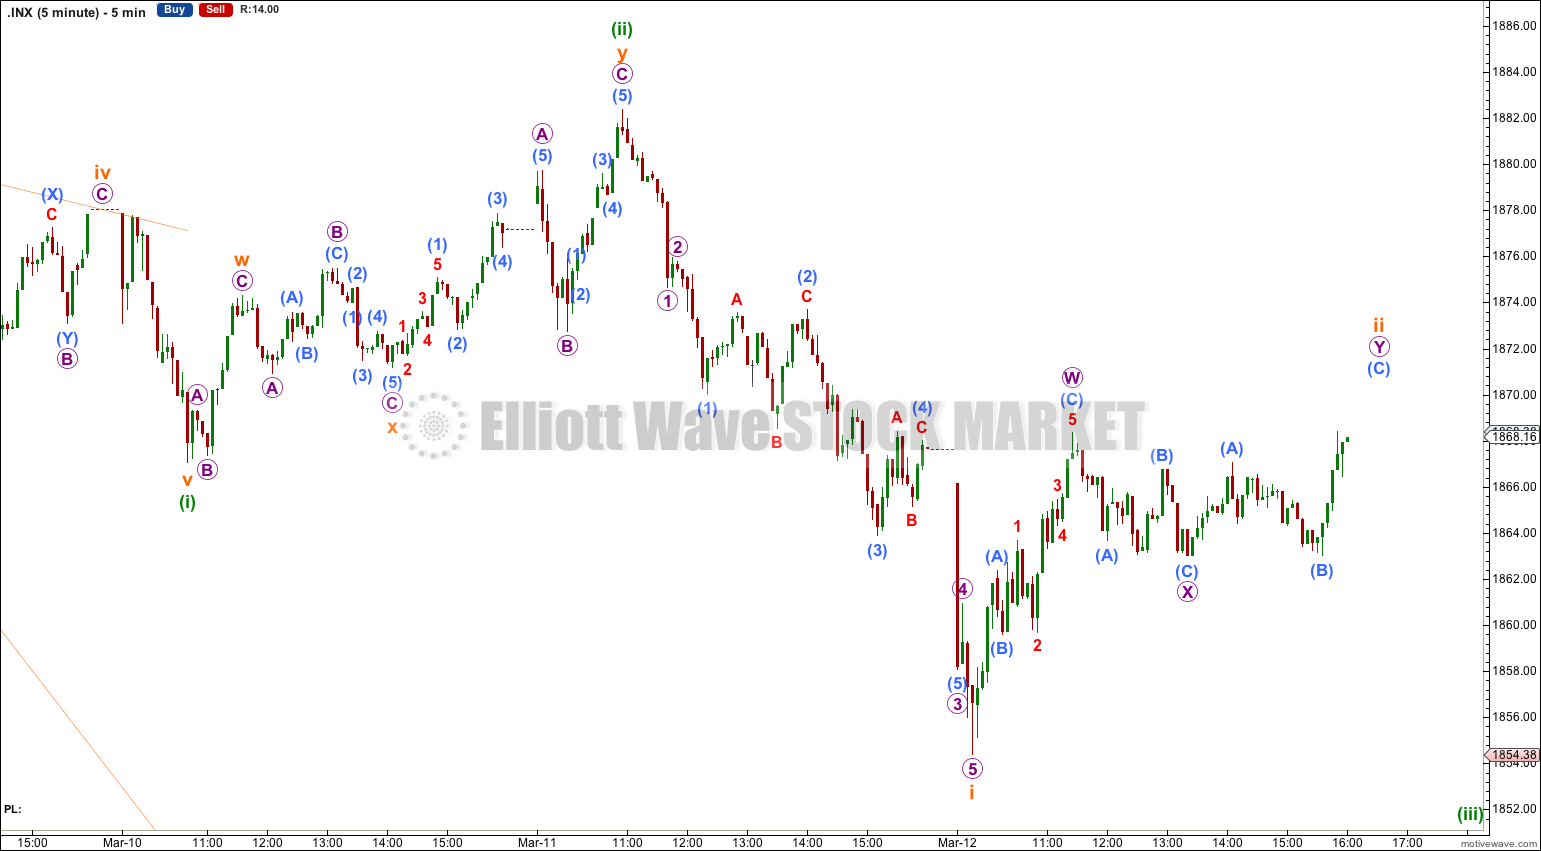
Within minuette wave (iii) it looks most likely that subminuette wave i is complete. Subminuette wave ii looks incomplete on the five minute chart and I would expect it to move a little higher. Subminuette wave ii may not move beyond the start of subminuette wave i. This wave count is invalidated with movement above 1,882.35.
When subminuette wave iii is complete then we can draw a channel about this downwards movement. For now I would expect upwards corrections to find resistance at the upper aqua blue trend line (if they get up that far).
This wave count expects to see an increase in downwards momentum over the next couple of days or so.
Bearish Alternate Wave Count.
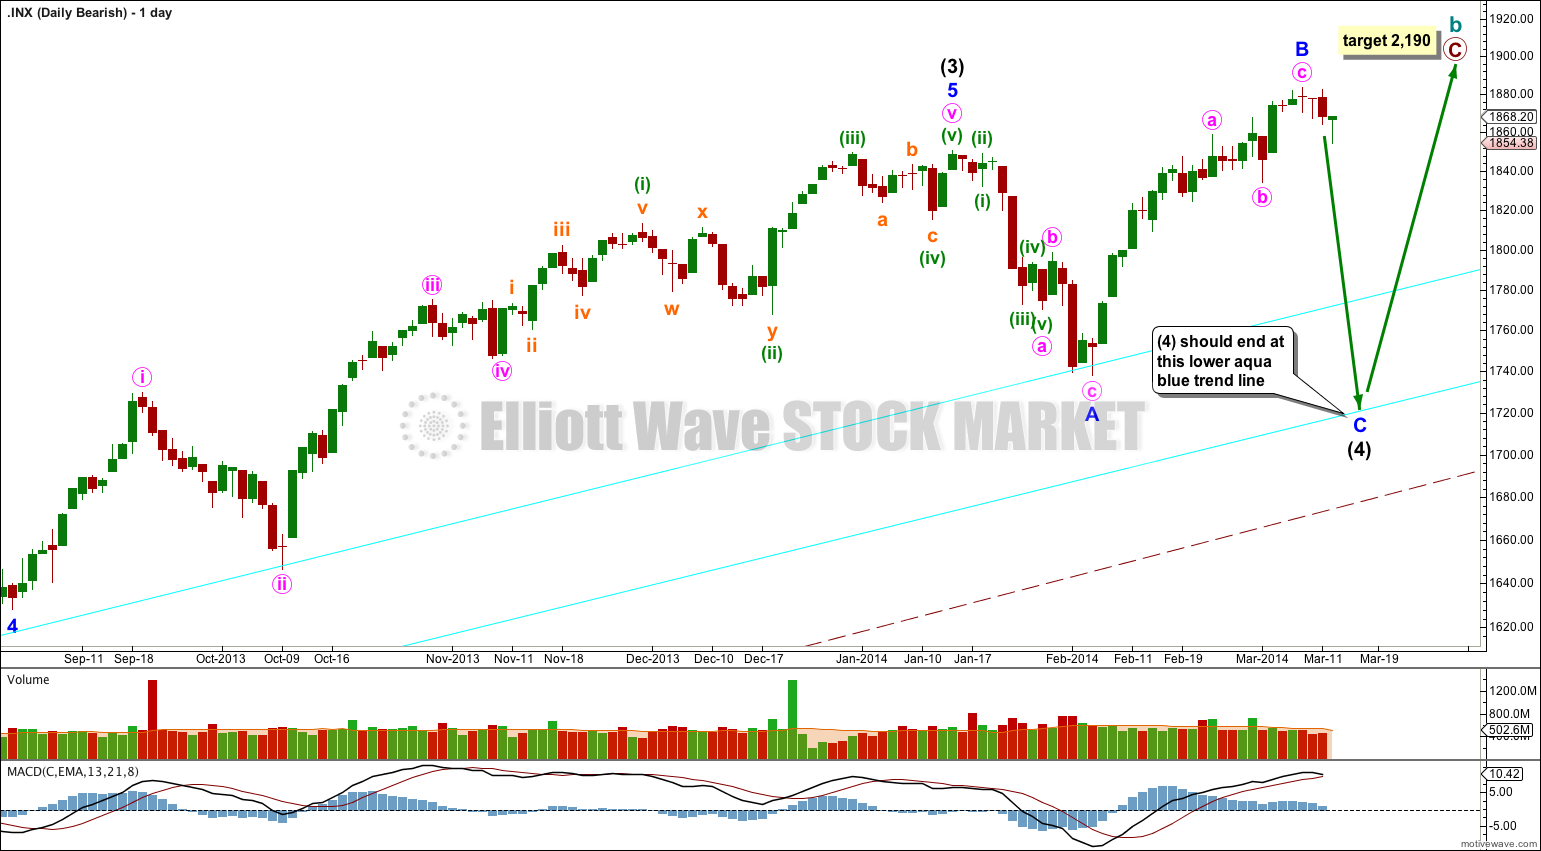
This bearish wave count expects that the correction was not over at 666.79, and that may have been just cycle wave a of a huge expanded flat for a super cycle wave II. Cycle wave b upwards is a close to complete zigzag.
Within flat corrections the maximum common length of B waves in relation to A waves is 138%. So far cycle wave b is a 141% correction of cycle wave a. For this reason only this wave count is an alternate.
Within primary wave C of the zigzag intermediate wave (4) would be incomplete.
The subdivisions for intermediate wave (4) would be the same as the main wave count for intermediate wave (2). I would expect it to end at the lower aqua blue trend line.
At 2,190 primary wave C would reach 1.618 the length of primary wave A. When intermediate wave (4) is complete I would recalculate this target at intermediate degree. I have found Fibonacci ratios between actionary waves (1, 3 and 5) of impulses are more reliable than between A and C waves within zigzags for the S&P500.
If intermediate wave (5) lasts about five to six months it may end about October this year.
I’m sorry, it really makes no sense to me. You have a minor degree third wave ending at the low of 1,834.44?? That makes no sense. I really would need to see a chart of that idea. Sorry.
comments need a chart, but i am sailing, only nautical charts here
here is my chart >>>>Feb 3 low 1834.44 end of minor wave 3<<<<>>>>March 12 1854.38 end of minute [ii]
with that chart, do you think this could be a good alternative count?
thanks