
A new high invalidated the main wave count and confirmed the second alternate. I am swapping over the bearish and bullish wave counts at the monthly chart level.
Summary: I still expect another five wave structure downwards to complete this correction at intermediate degree for wave (2). It should last about two to three weeks. The target is 1,676. Downwards movement may find support at the lower aqua blue trend line, if this line is breached then the bearish wave count would again be possible.
Click on the charts below to enlarge.
Main Bullish Wave Count.
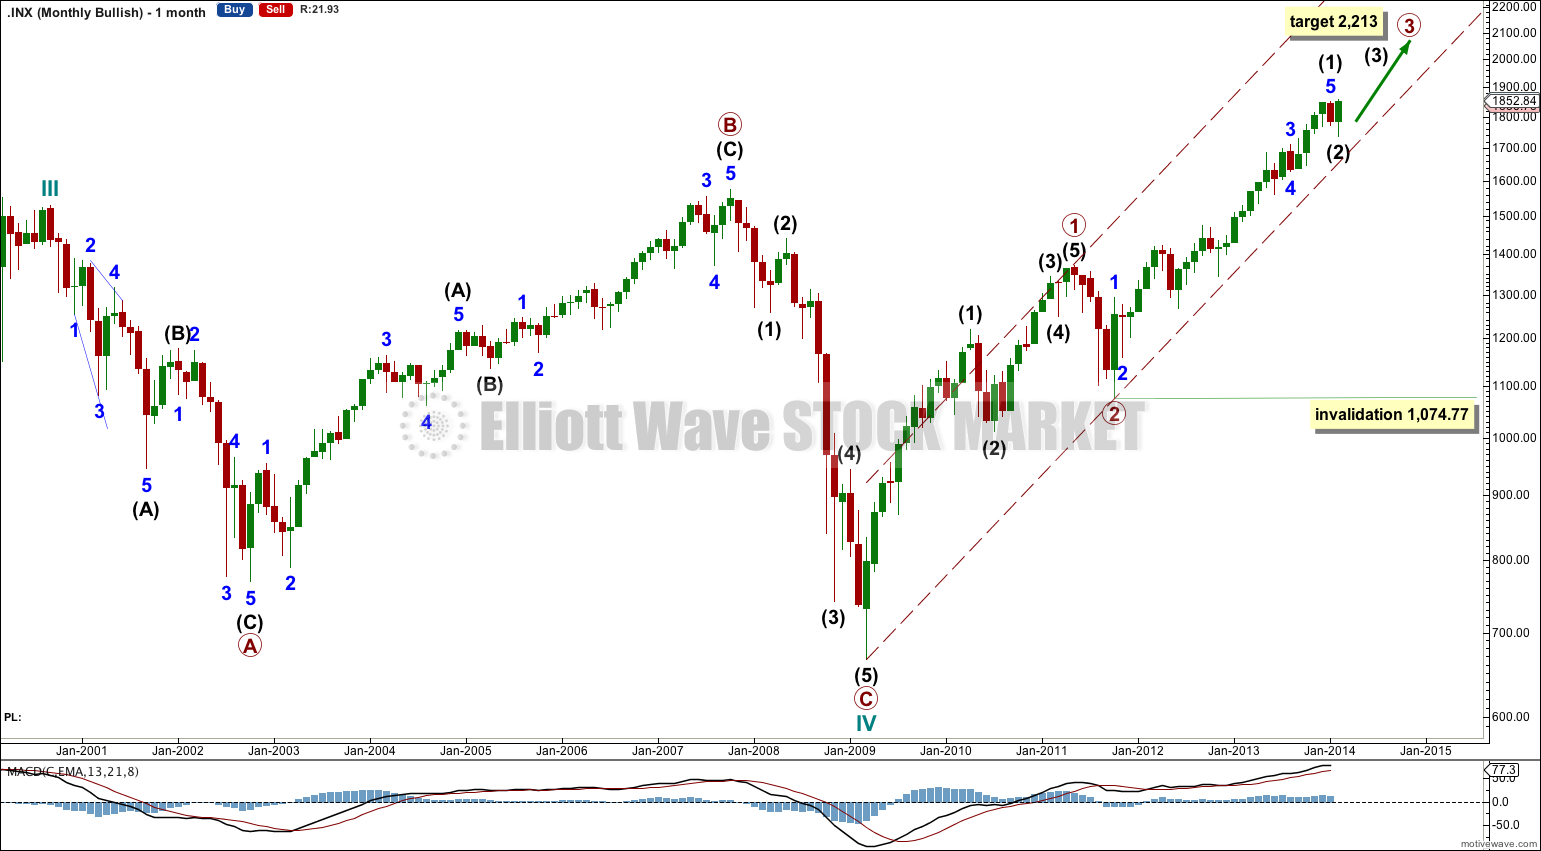
This wave count expects that the correction was over as a cycle wave IV at 666.79 and a cycle wave V began at that point.
Within cycle wave V primary waves 1 and 2 are complete. Within primary wave 3 intermediate wave (1) is most likely complete. Intermediate wave (2) is most likely incomplete.
The big maroon — channel is an acceleration channel. Intermediate wave (2) should not breach the lower edge of this channel. If this channel is breached then I would discard this wave count in favour of the bearish wave count.
Intermediate wave (2) may not move beyond the start of intermediate wave (1) below 1,074.77.
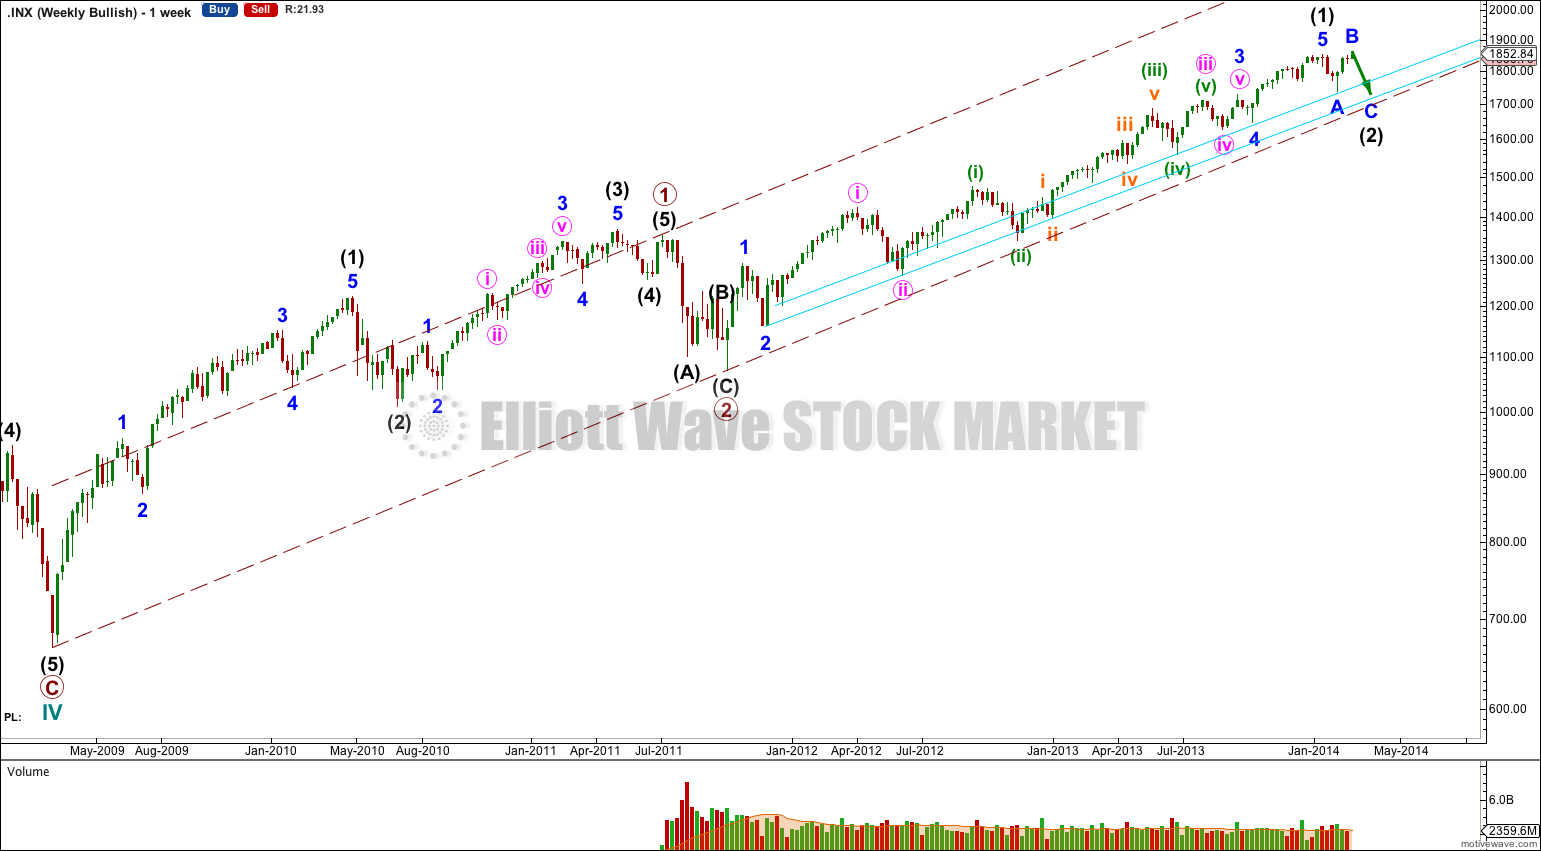
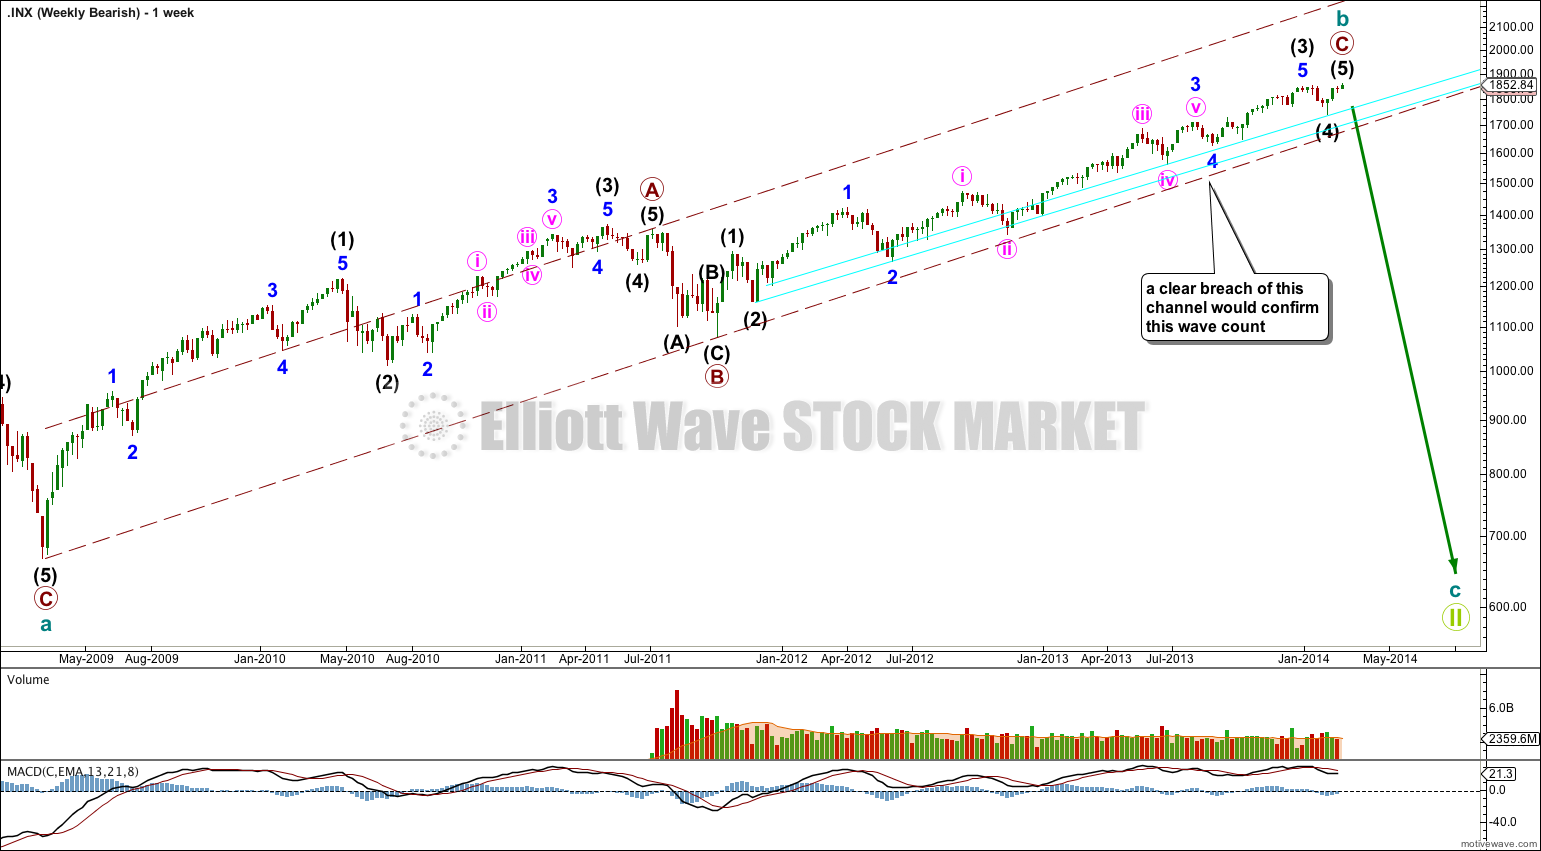
This weekly chart shows the whole of the start of this possible new bull market. Within intermediate wave (1) downwards corrections are finding strong support at the two aqua blue trend lines. I would expect intermediate wave (2) to find support at the lower of these two trend lines. It should not move below the larger maroon — channel.
Primary wave 3 should clearly and strongly breach the upper edge of the maroon — acceleration channel. Because this channel has not been breached it is unlikely that primary wave 3 is over.
Overall on the weekly and daily chart levels it looks likely that intermediate wave (2) is incomplete and should take up more time. Although it could be over at the low labeled minor wave A, as a brief zigzag, that looks too brief for an intermediate degree wave and it looks extremely shallow in relation to intermediate wave (1).
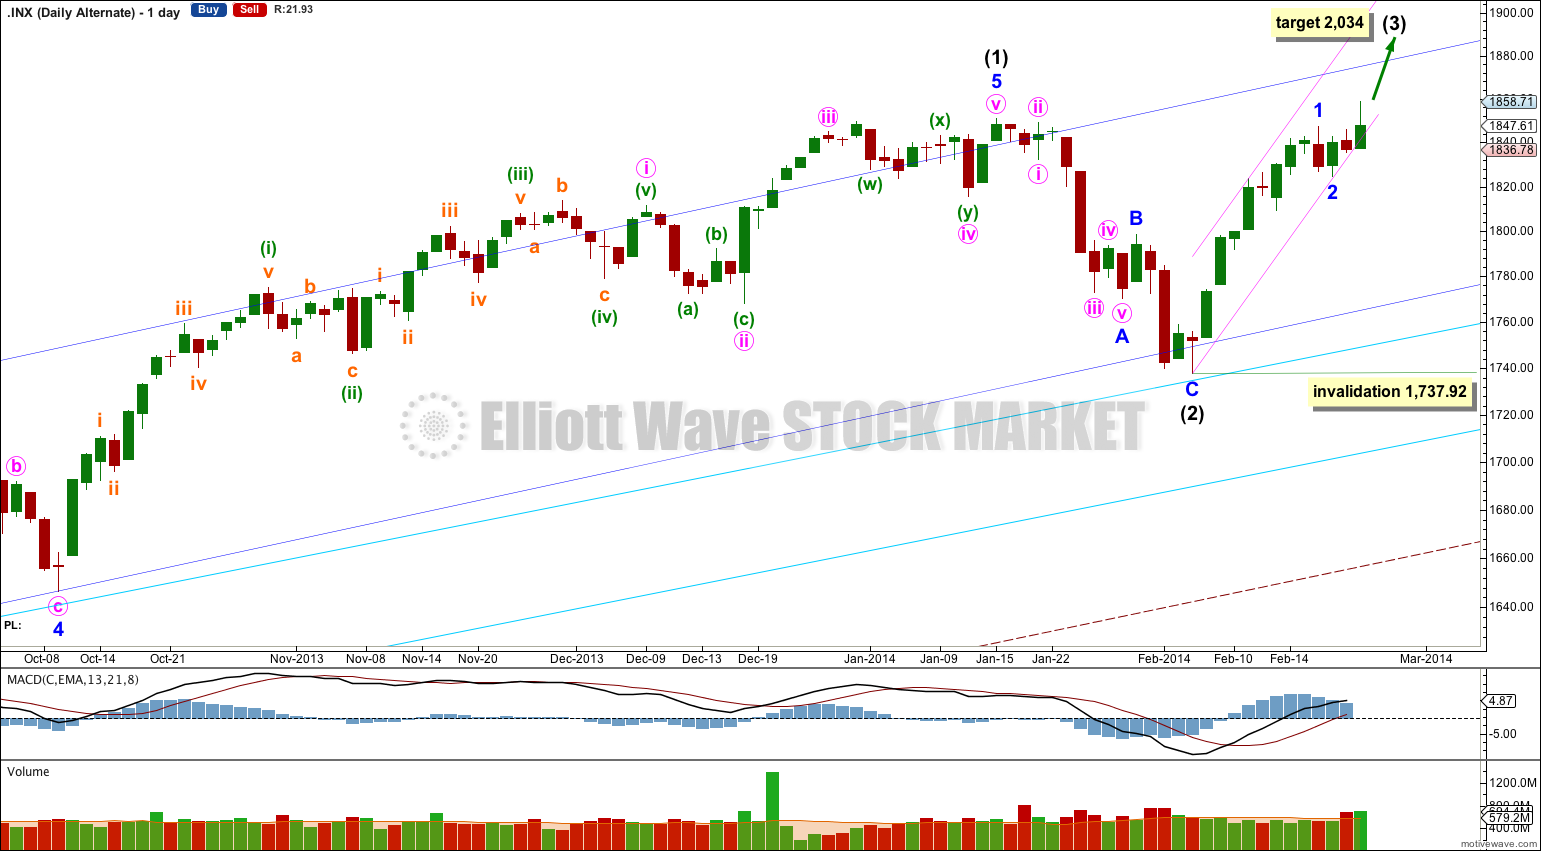
Movement above 1,850.84 invalidated the bearish wave count as it was labeled and confirmed this bullish alternate. I expect that intermediate wave (2) is unfolding as an expanded flat correction. Intermediate wave (2) should breach the channel containing intermediate wave (1), not just overshoot it.
Within intermediate wave (2) minor wave A found support at the upper aqua blue trend line. Minor wave C may find support at the lower aqua blue trend line. At 1,676 minor wave C would reach 1.618 the length of minor wave A.
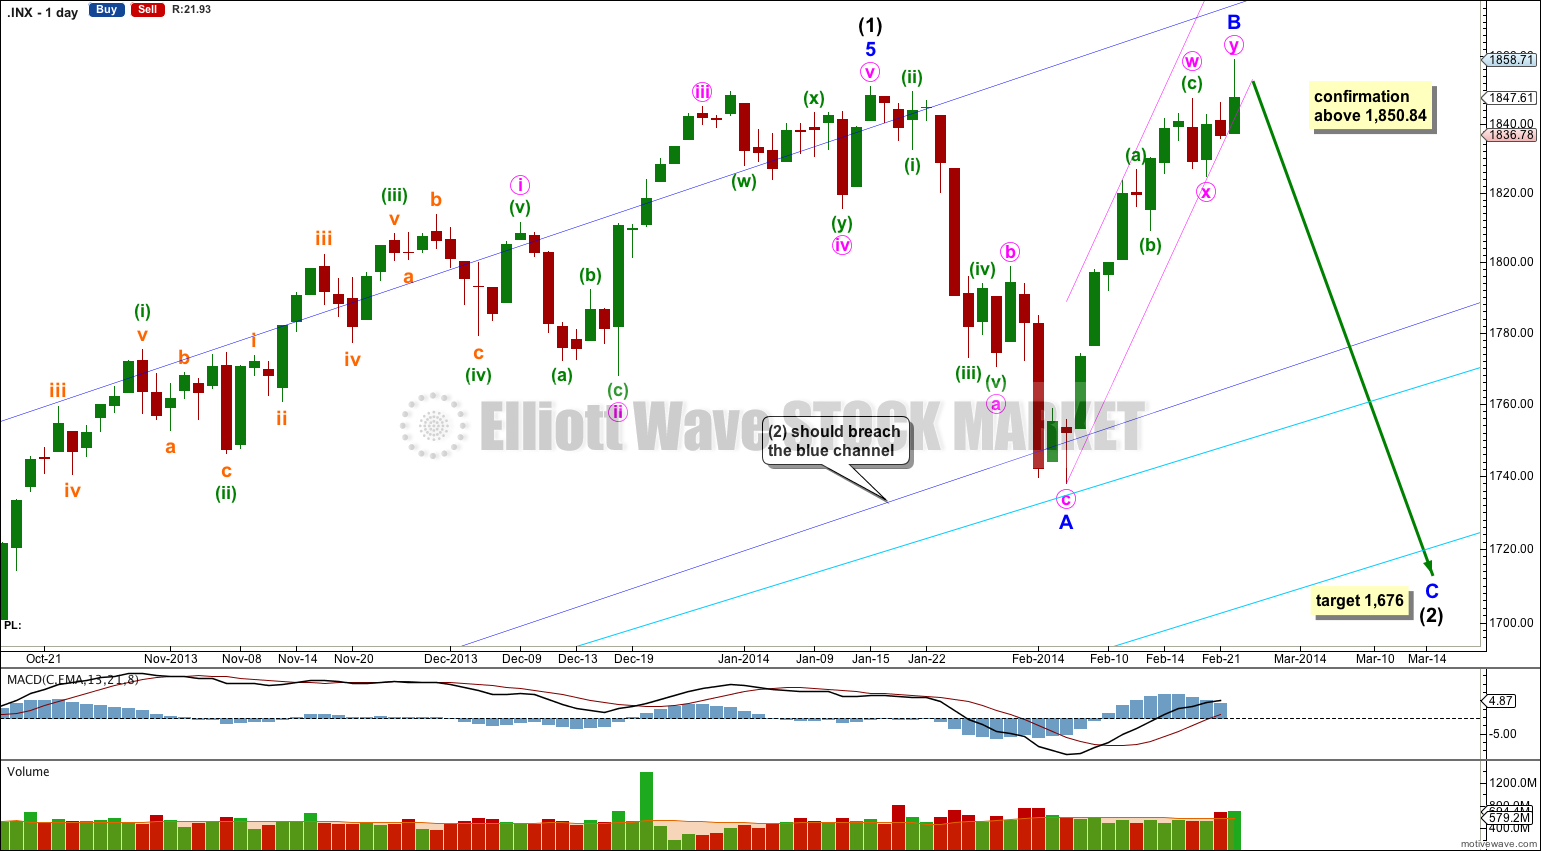
I want to see the small pink channel about minor wave B clearly breached to have any confidence in this minor degree trend change. When there is a full daily candlestick below this pink channel and not touching the lower pink trend line then I would have confidence in the target for minor wave C.
Minor wave B is a 106% correction of minor wave A so this flat is an expanded flat. Expanded flats normally have C waves which move substantially beyond the end of their A waves. At 1,676 minor wave C would reach 1.618 the length of minor wave A.
Movement to a new low below 1,737.92 would be highly likely for this wave count as minor wave C is likely to move below the end of minor wave A to avoid a truncation and a rare running flat.
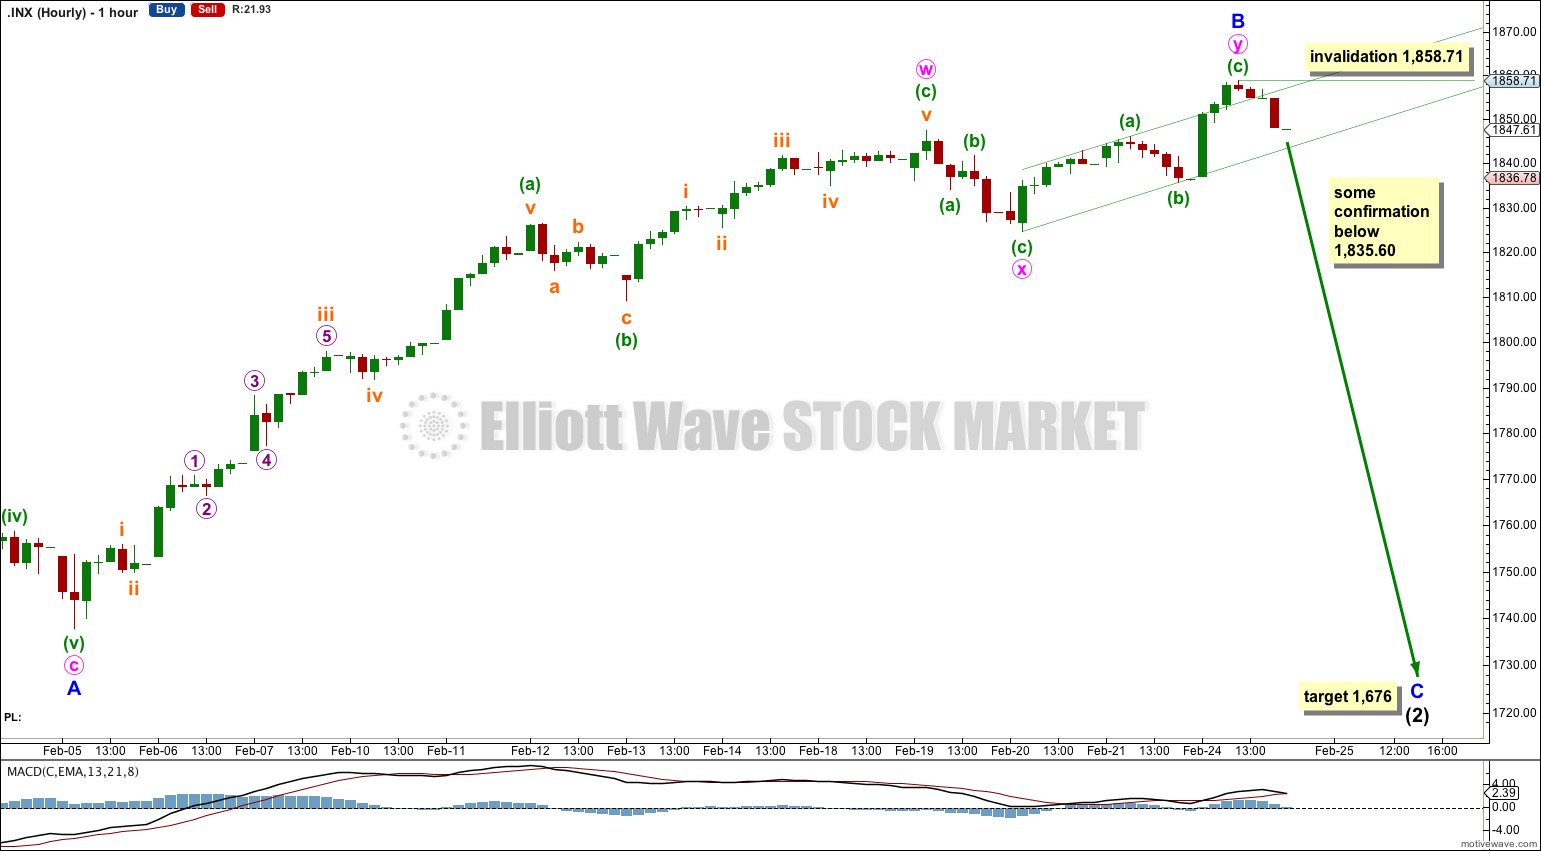
Within minor wave C no second wave correction may move beyond the start of it’s first wave. This main wave count is invalidated with movement above 1,858.71. If that happens within the next few days then the alternate below should be used.
Alternate Bullish Wave Count.
It is possible that intermediate wave (2) is over as a remarkably brief shallow zigzag which did not breach the channel containing intermediate wave (1). But this wave count has a low probability.
If upwards movement continues from here then a third wave would be forming and upwards momentum should increase significantly.
This wave count is extremely bullish in the short and long term. At 2,034 intermediate wave (3) would reach 0.382 the length of intermediate wave (1). If intermediate wave (3) passes this target, or price gets there and the structure is incomplete, then a higher target would be calculated for both intermediate wave (3) and primary wave 3.
The target for primary wave 3 would be the same; at 2,213 primary wave 3 would reach 1.618 the length of primary wave 1.
Within intermediate wave (3) minor wave 2 may not move beyond the start of minor wave 1 below 1,737.92.
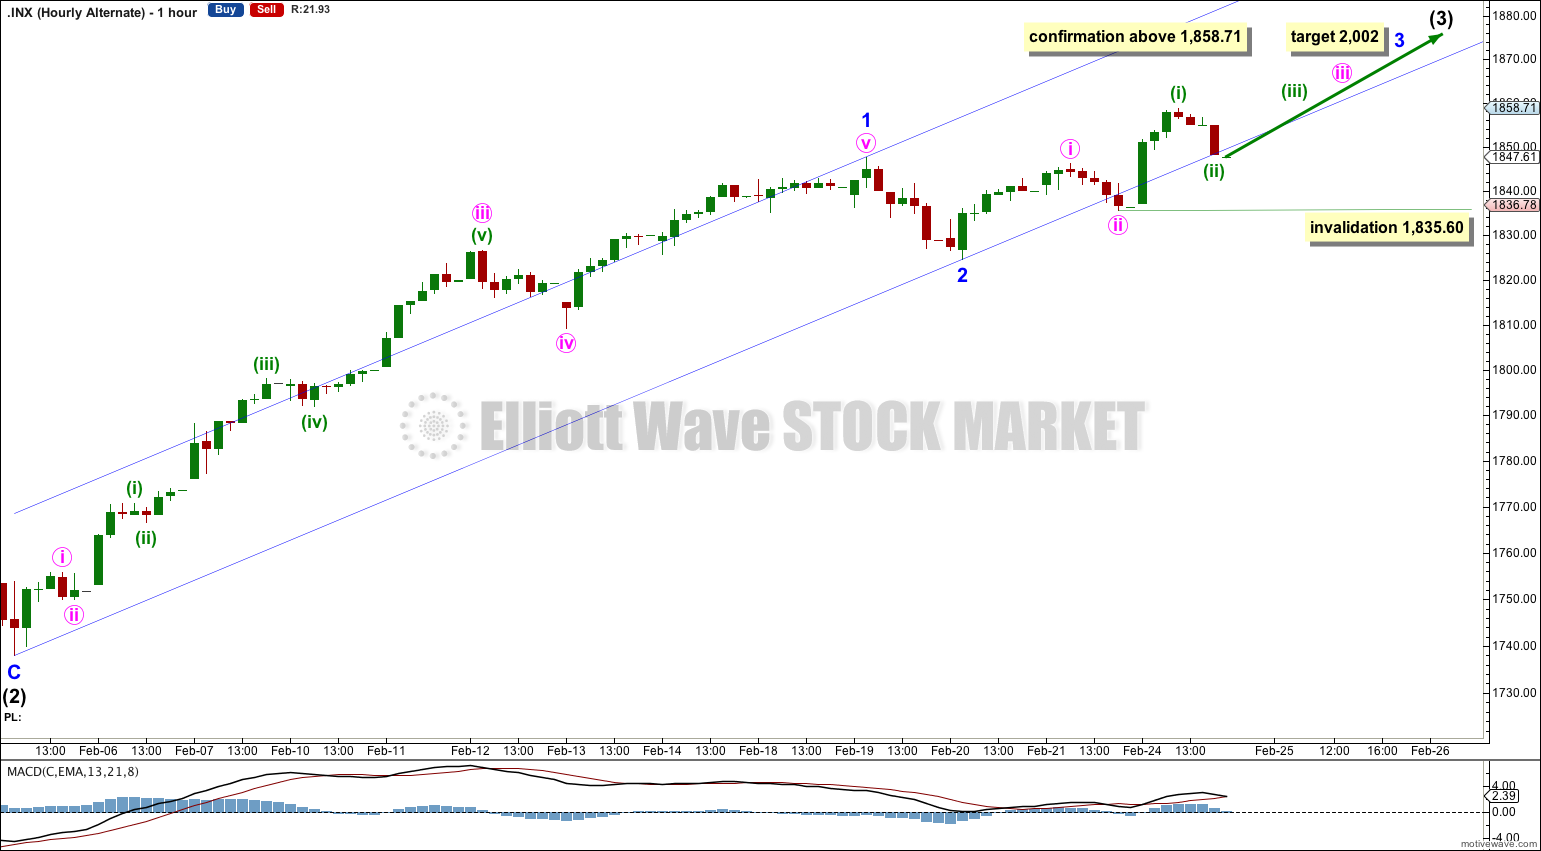
If the correction is over and a new upwards trend is unfolding then it is entering a third wave.
The upwards wave ending at 1,847.50 is ambiguous; it may be seen as either a three or a five.
The upwards movement from the low labeled minor wave 2 is not ambiguous, it can only be seen as a three. This may be a series of overlapping first and second waves.
This wave count requires an imminent strong increase in upwards momentum.
Within minute wave iii minuette wave (ii) may not move beyond the start of minuette wave (i). This wave count is invalidated with movement below 1,835.60.
Bearish Alternate Wave Count.
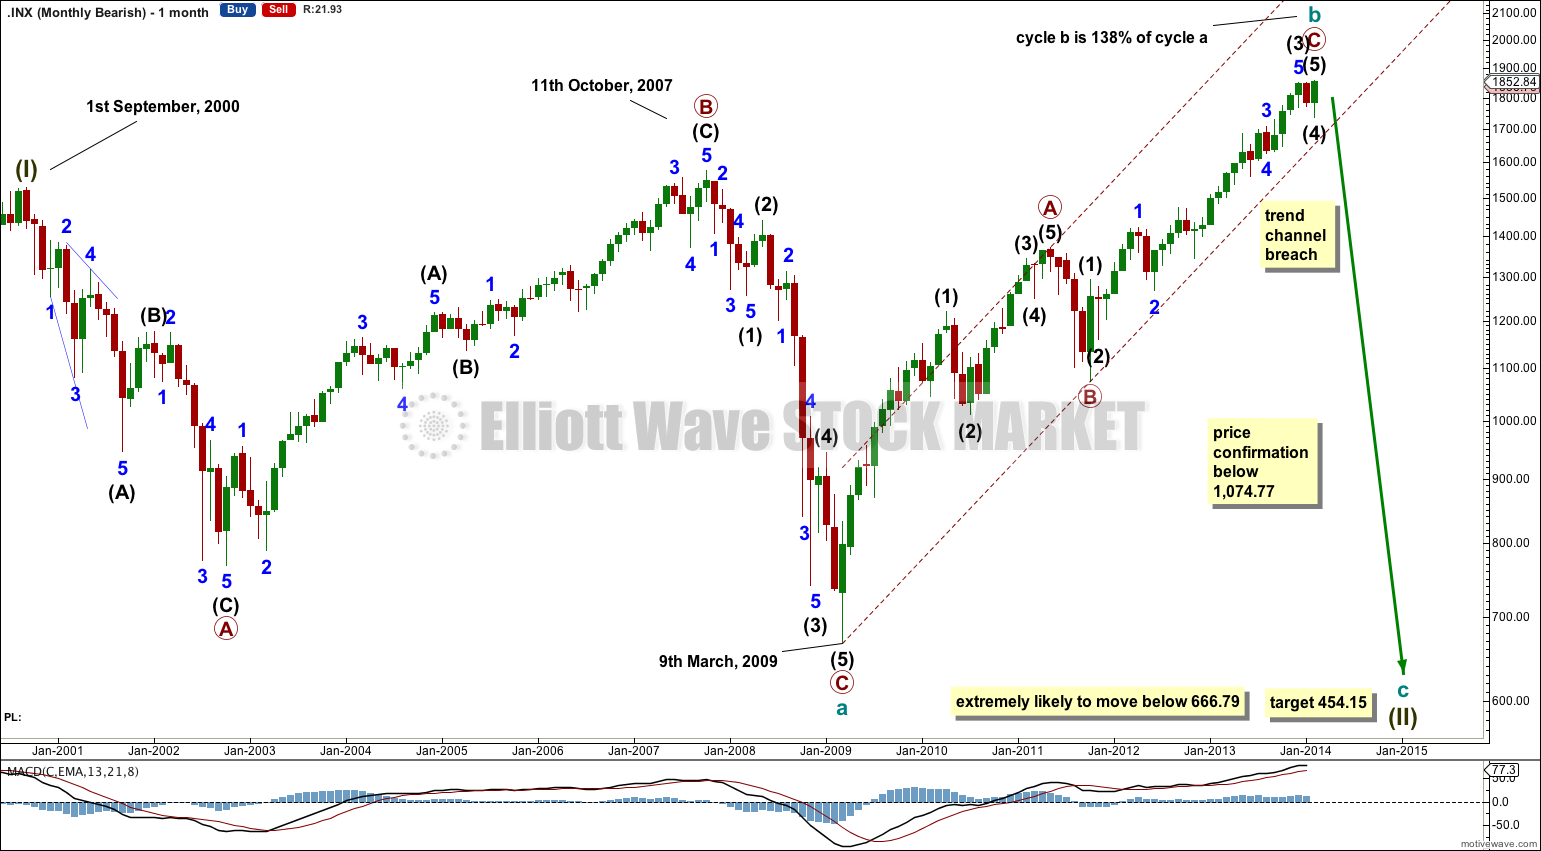
This wave count is still possible, but it now must technically be relegated to an alternate. As upwards movement continues this wave count reduces in probability. At 1,858 cycle wave b has reached the maximum common length of 138% the length of cycle wave a. Above this price point this alternate wave count further reduces in probability. Unfortunately there is no maximim limit to a B wave within a flat correction and so there is no price point beyond which this wave count is invalid. When cycle wave b is twice the length of cycle wave a then the probability of this wave count would be so low it should be discarded completely. That point is at 2,393.23.
So far upwards movement subdivides as an almost complete zigzag; 5-3-5. Primary wave C may be ending midway within the channel about the zigzag which is typical.
While price remains above the two aqua blue trend lines this wave count will now remain an alternate. Only if the lower aqua blue trend line is clearly breached would I again consider this bearish wave count seriously.
Intermediate wave (4) is either continuing as an expanded flat (the same idea for intermediate wave (2) as in the main wave count) or it is over and the final fifth wave upwards for intermediate wave (5) is unfolding (the same idea as for the alternate daily wave count above).
Hi Lara,
For your main hourly count, minute y looks very brief in comparison to minute w – is it not possible or even likely that minor B could continue to make new highs as an expanded flat? I will be watching whether we see a drop below your trendchannel for minute y.
Yes it does, but that’s okay. I would not expect W and Y to have a ratio of equality, and sometimes within double zigzags one of them is shorter than the other.
Yes it is possible that minor wave B could continue to new highs. And that is pretty much why I want to see that channel on the hourly chart breached, and movement below 1,835.60 before I have confidence in the trend change at minor degree and the target.
Hi Lara,
With the kind of bullish trend , IMHO there will be retracement for 2nd wave. However that’ll be a pullback making higher highs only.
So isn’t it better to follow extremely bullish wave count , at least trader community can position for bears with decent stop loss and go bullish in 3rd wave up, which also excellent like bearish C down!!!
Thx
the main wave count is bullish.
if your analysis is better in line with the second (alternate) bullish wave count which is immediately bullish then you would want to follow that one.
Hi,
I’m actually taking all counts from your projections. Just asking if I should start with more conservative count and move towards the one that’s working.
That gives me at-least better comfort level to position trades with tight stop losses and move them as count is working.
Please comment if it makes sense.
Thx
Yes, your comment makes sense.
What I’m trying to say (badly) is that when the situation regarding Elliott wave is unclear then use your own technical analysis to decide which of the wave counts you prefer.
If your own analysis is in line with a specific wave count, then use that one.
At the end of the day the most important thing on the charts at the moment is those two aqua blue trend lines. While price is above the lower of those two lines we should assume the trend remains upwards.
JA,JA Bullish but still short. And now that we broke out to new highs we are going lower to below 1,700. I doubt it. I´m not letting this Elliott nonsense hurt my trading anymore. The trend is up, no matter the wave count. If we are going to sell off big, it is most likely going to happen in the summer, April, May, not now. I´m staying long despite the wave count.
You are welcome to cancel your membership if you think Elliott wave is nonsense.
Good luck finding an analysis service which never makes mistakes and is always right.
What exactly have you found that is nonsense? In the two years I have followed Lara, her work has been outstanding. If you are looking for someone to pick the absolute hi and lo of price moves, you are going to be looking for a very long time.
Her analysis have been expecting the market to drop for the last 13 days, 2 and 1/2 weeks. At 1,790 it was suppose to go down because it was a falt and b wave was coming, again at 1820, 1845 and now that we make a new high, it is still expecting lower prices. It has missed and went against the last 70 points of bullish activity. It may have been more accurate in the past, but very inaccurate in the last 3 weeks. I´m kind of a new subscriber. Maybe I was expecting too much.
The first time she said this minor wave was over was last Thursday I believe.