
Last analysis expected a little more downwards movement to just below 453.70. Price has moved slightly lower to 450.48 so far, but has not convincingly turned upwards yet since the low.
The wave count remains the same. I still expect it is highly likely price will move above 469.95 before we see a trend change and a new wave down.
Click on the charts below to enlarge.
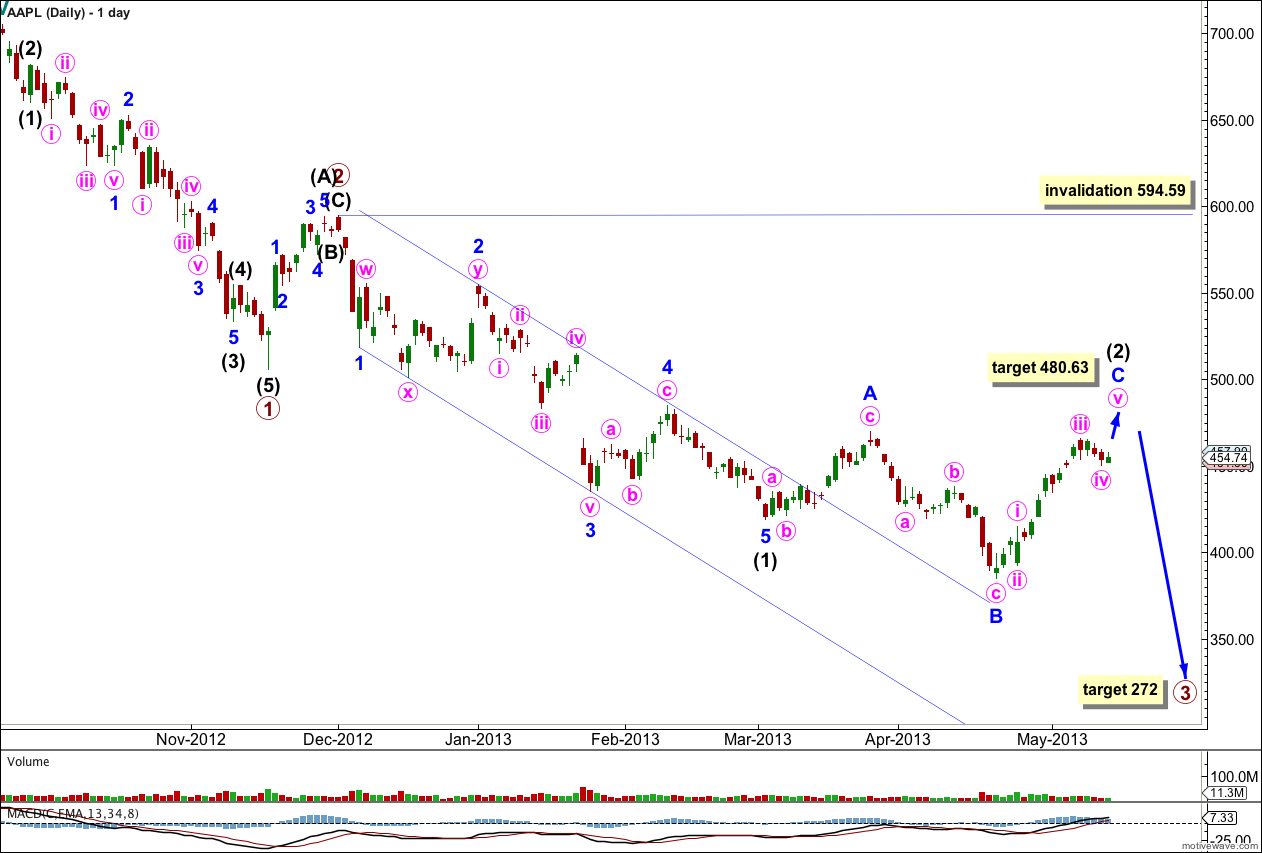
This wave count expects a five wave impulse for a cycle degree wave a is unfolding to the downside. Within the impulse primary waves 1 and 2 are complete. Primary wave 3 is extending. Within primary wave 3 intermediate wave (1) is complete, and intermediate wave (2) is an incomplete flat correction. It is extremely likely that minor wave C within intermediate wave (2) will move above the high of minor wave A at 469.95 to avoid a truncation and a rare running flat.
Within minor wave C within intermediate wave (2), at 480.63 minute wave v would reach equality in length with minute wave i.
At 272 primary wave 3 would reach 1.618 the length of primary wave 1. This long term target is still months away.
Intermediate wave (2) may not move beyond the start of intermediate wave (1). This wave count is invalidated with movement above 594.59.
I have considered various possibilities for this downwards movement from the high labeled primary wave 2. What is most clear is that the middle of primary wave 3 has not yet passed because we have not seen momentum increase beyond that seen for primary wave 1. Primary wave 3 cannot be complete.
A channel drawn about intermediate wave (1) using Elliott’s channeling technique has been clearly breached. This indicates that this impulse is over and the correction to follow it has begun.
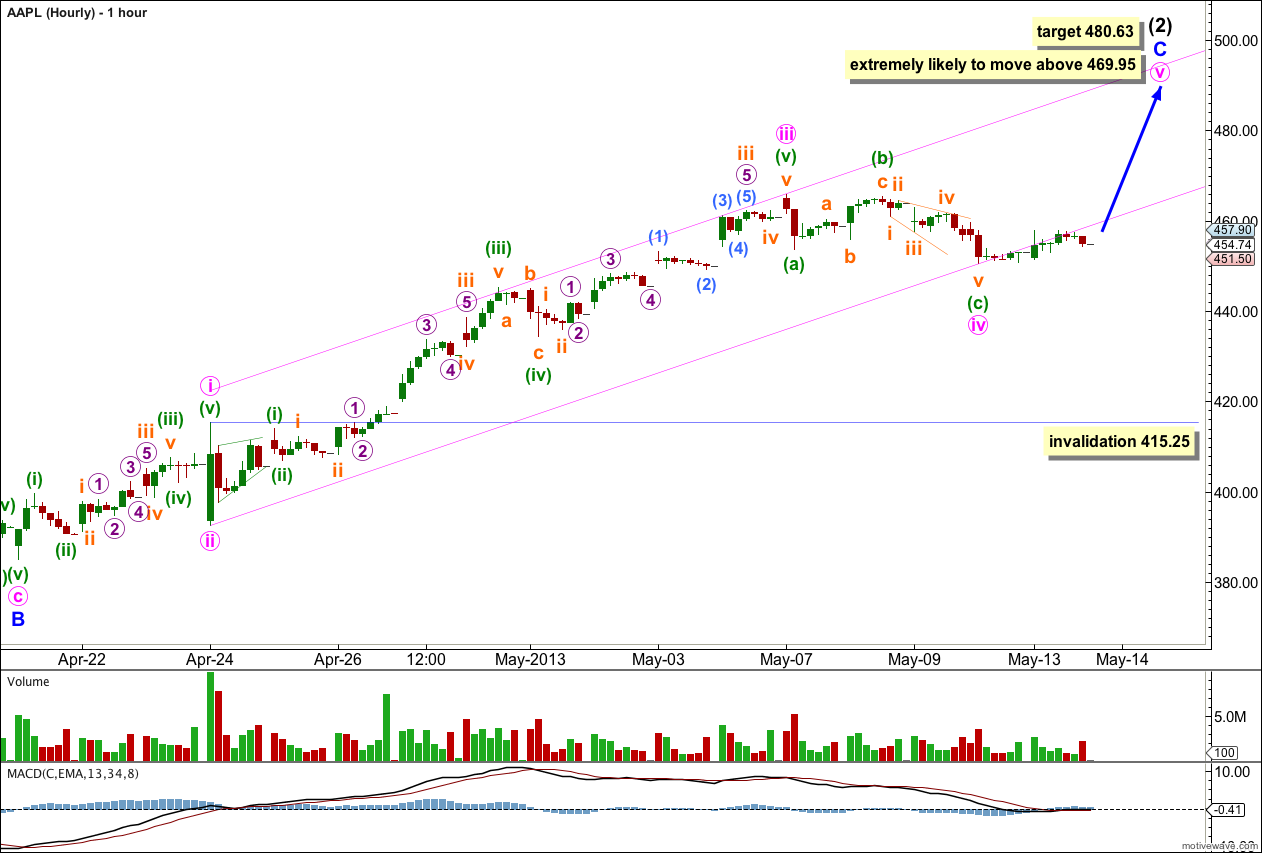
The structure for minute wave iv may now be complete. It would be possible, but very unlikely, that this fourth wave could continue further as if it did it would become too out of proportion to minute wave ii.
There is perfect alternation between minute wave iv as a shallow (19.5%) regular flat correction, and minute wave ii as a deep (74.6%) zigzag.
On the five minute chart upwards movement since 450.48 subdivides into a five wave impulse, so far.
The channel drawn here using Elliott’s second technique has broken down and is not longer showing where price is finding support. I would expect price to move back into the channel and for upwards movement to end mid way within it, but it may not.
I also would expect this upwards trend to continue for most if not all this week. It may end next week.
If minute wave iv continues further sideways and lower as a double flat or combination then it may not move into minute wave i price territory. This wave count is invalidated with movement below 415.25.
If this wave count is invalidated with downwards movement then there is an outlying possibility that intermediate wave (2) may be over as a rare running flat and a third wave down may have begun.