
Last analysis of AAPL expected price to move higher, but required a channel breach to have confidence in this prediction. Price remained firmly within the channel and moved lower, remaining just above the invalidation point at 419. Thereafter, price turned higher and breached the channel.
I have more confidence in this analysis which now expects price to continue to rise for another one to four weeks.
Click on the charts below to enlarge.
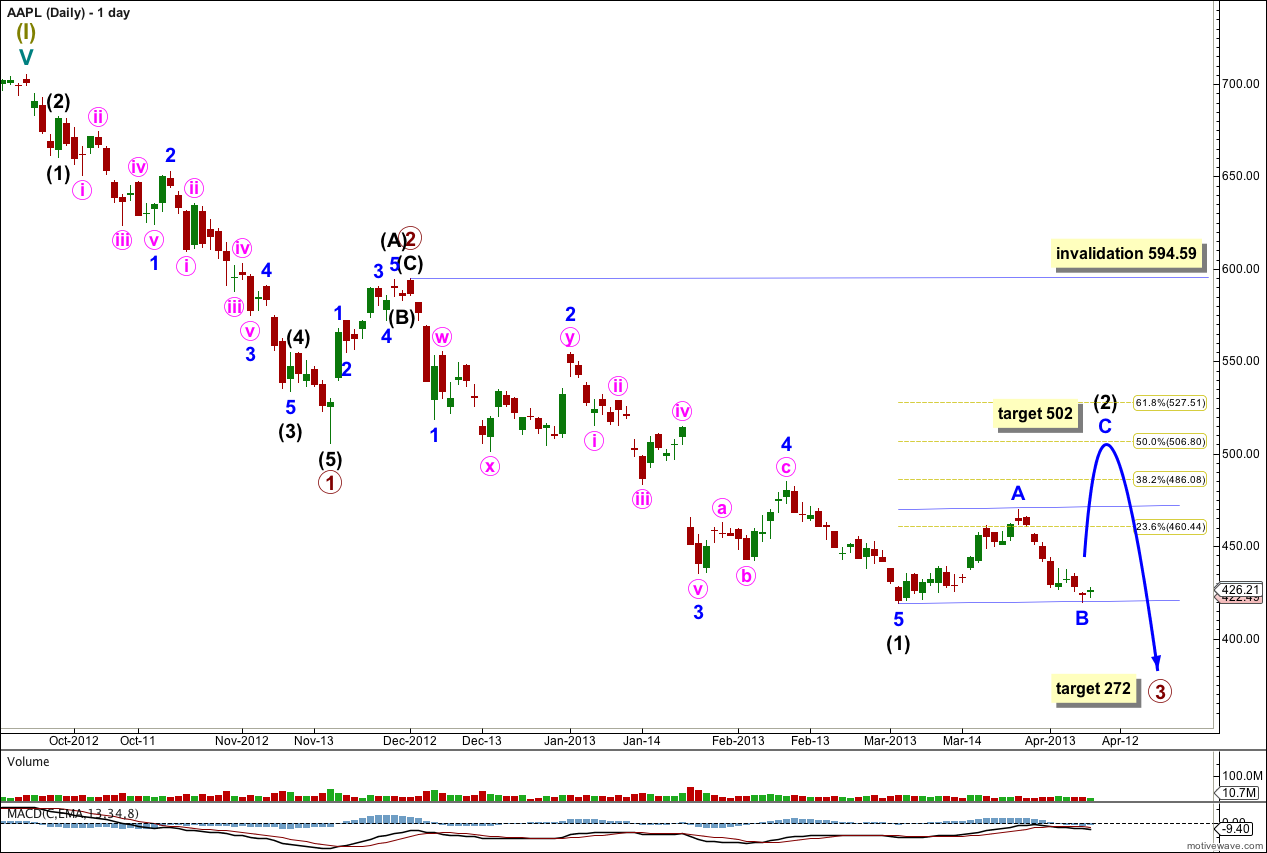
This main wave count expects a five wave impulse for a cycle degree wave a is unfolding to the downside. Within the impulse primary waves 1 and 2 are complete. Primary wave 3 may be extending. Within primary wave 3 intermediate wave (1) is a complete five wave structure and intermediate wave (2) is unfolding.
Within intermediate wave (2) minor waves A and B are now most likely complete. At 502 minor wave C would reach 1.618 the length of minor wave A and intermediate wave (2) would end close to the 50% mark of intermediate wave (1).
Intermediate wave (2) may not move beyond the start of intermediate wave (1). This main daily wave count is invalidated with movement above 594.59. If price moves above this point then we may use the alternate wave count below.
At 272 primary wave 3 would reach 1.618 the length of primary wave 1. This long term target is months away.
We can now draw a parallel channel about intermediate wave (2). Draw the first trend line from the start of minor wave A to the end of minor wave B, then place a parallel copy upon the high of minor wave A. Minor wave C may find some resistance about the upper edge of this channel on the way up, if the target is reached this resistance should be broken and the channel may be overshot. When the zigzag for intermediate wave (2) may be seen as complete then subsequent movement below the channel would confirm that the next wave, intermediate wave (3), would be underway.
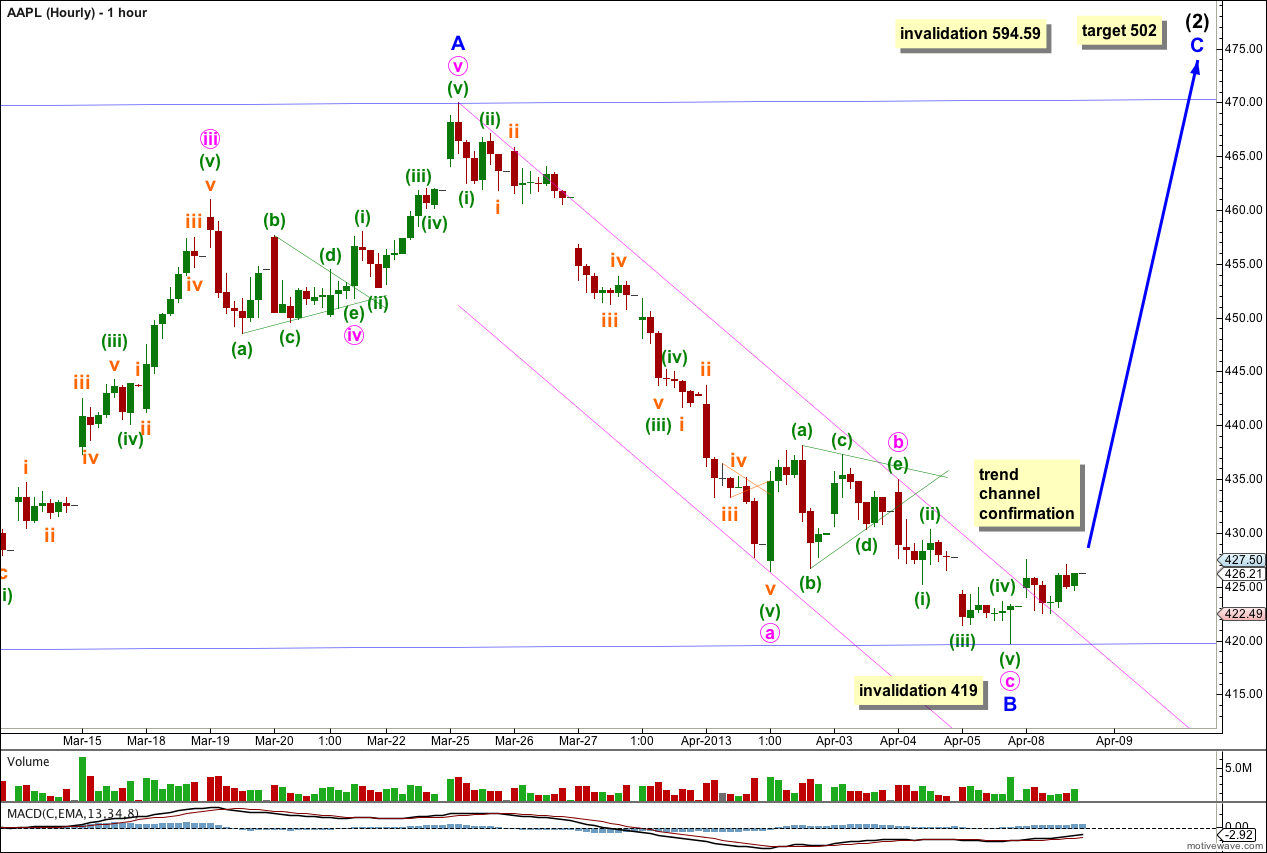
With minor wave B moving a little lower minute wave c now has a more common ratio to minute wave a. Minute wave c is 1.32 short of 0.382 the length of minute wave a.
Ratios within minute wave c are: minuette wave (iii) is 0.75 short of equality with minuette wave (i), and minuette wave (v) is 0.25 short of 0.382 the length of minuette wave (i).
We now have a clear breach of the channel containing minor wave B downwards. This indicates that the downwards zigzag for minor wave B is over and a new upwards wave for minor wave C has begun.
Minor wave A lasted 15 days and does not have a Fibonacci time relationship. Minor wave B lasted a Fibonacci 8 days. We may expect minor wave C to last about 15 sessions, or three weeks.
If we see any further downwards movement minor wave B may not move beyond the start of minor wave A below 419. If this wave count is invalidated with downwards movement that would be a strong indication that intermediate wave (2) is complete and intermediate wave (3) downwards has begun.
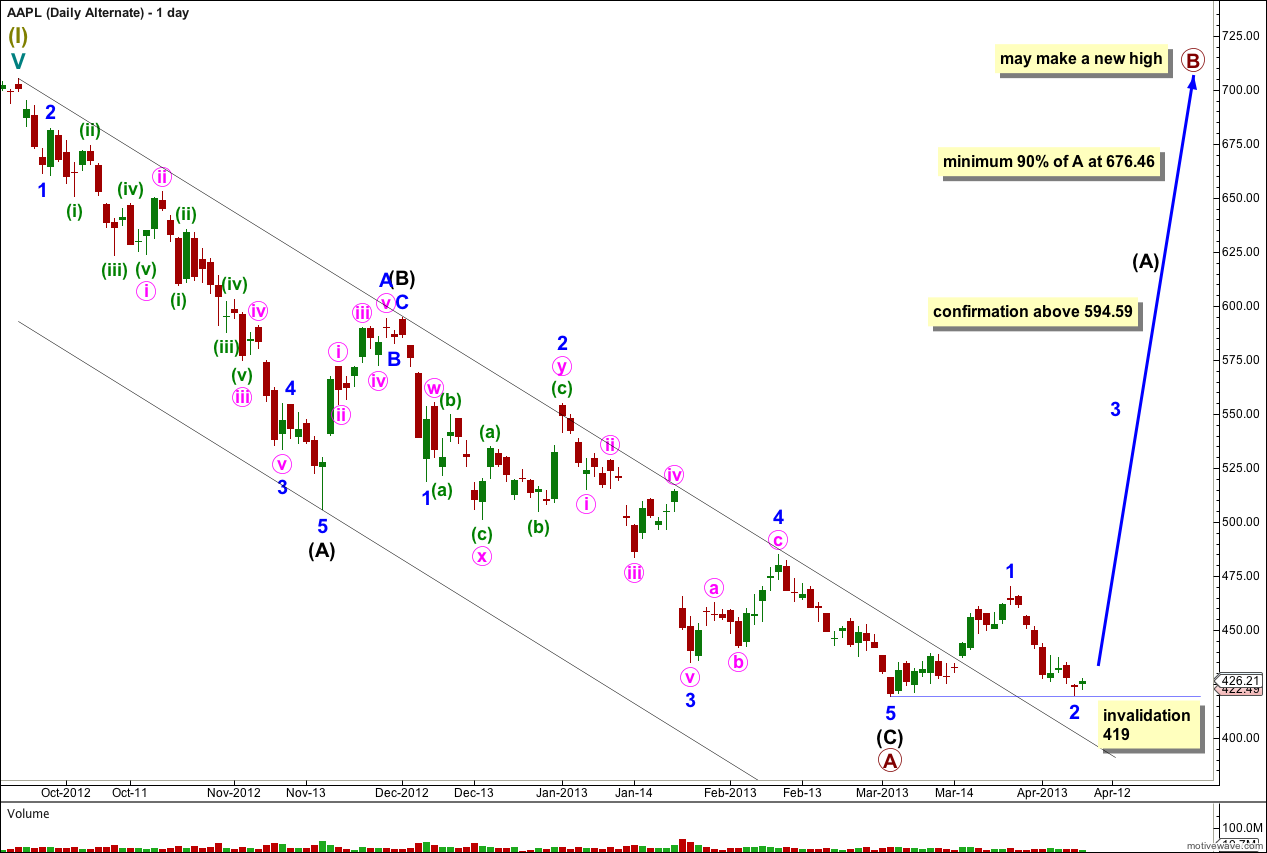
Alternate Daily Wave Count.
If the main daily wave count is invalidated with upwards movement above 594.59 then this alternate would be confirmed.
If cycle wave a is subdividing into a three wave structure then within it primary wave A may be a complete zigzag. Cycle wave a may be unfolding as a flat correction.
Within primary wave A intermediate waves (A) and (C) have no Fibonacci ratio to each other.
The parallel channel drawn here using Elliott’s technique about a correction is clearly breached by upwards movement. The downwards zigzag is over and an upwards trend has begun.
Within primary wave B minor wave 2 may not move beyond the start of minor wave 1. This wave count is firmly invalidated with movement below 419.
Primary wave B must subdivide into a three wave structure, most likely a zigzag.
If cycle wave a is a flat correction then primary wave B must reach at least 90% the length of primary wave A at 676.46.
Primary wave B may make a new high above 705.07. Primary wave B should last about six months.