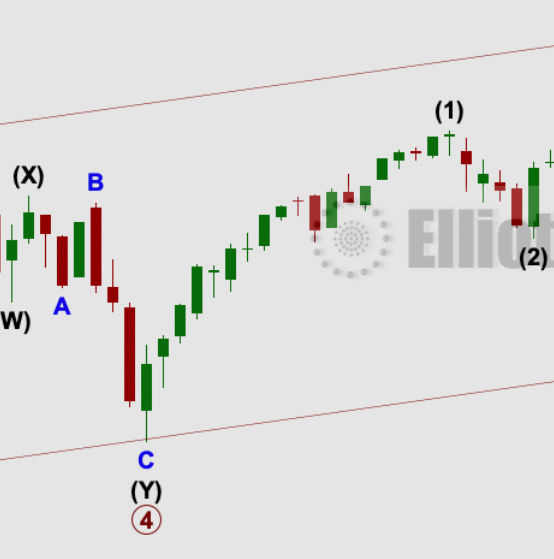
by Lara | Aug 13, 2020 | S&P 500, S&P 500 + DJIA
S&P 500: Elliott Wave and Technical Analysis | Charts – August 13, 2020 A very small range inside day completes as a doji. All four Elliott wave counts remain the same. Summary: The trend remains upwards. A trend change may come before 3,432.15. Prior to this...
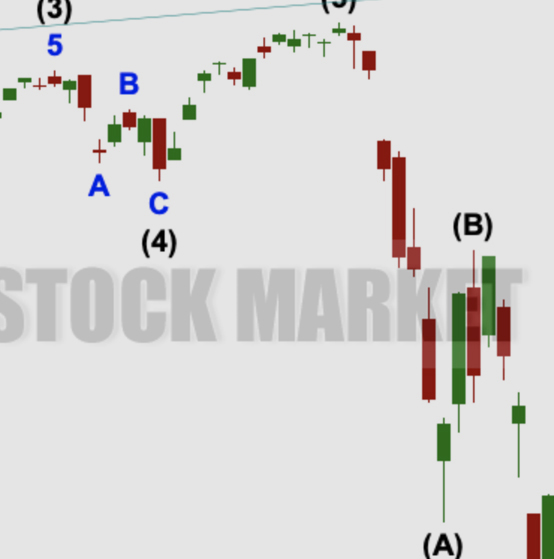
by Lara | Jul 29, 2020 | S&P 500, S&P 500 + DJIA
S&P 500: Elliott Wave and Technical Analysis | Charts – July 29, 2020 Upwards movement today remains below the short-term invalidation point on the hourly chart. Summary: With the best fit channel breached, it is possible that the bounce is over and the bear...
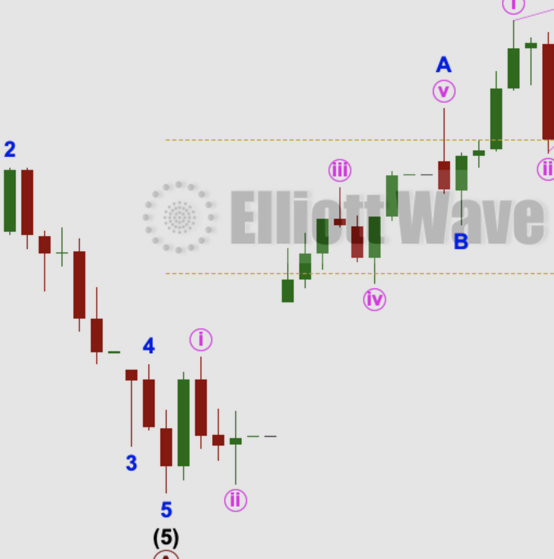
by Lara | Jul 23, 2020 | S&P 500, S&P 500 + DJIA
S&P 500: Elliott Wave and Technical Analysis | Charts – July 23, 2020 Two short-term Elliott wave counts are provided for members. Invalidation of one would provide confidence in the other. Summary: While price remains within the best fit channel on the main...

by Lara | Jul 21, 2020 | S&P 500, S&P 500 + DJIA
S&P 500: Elliott Wave and Technical Analysis | Charts – July 21, 2020 Another upwards day continues as expected. Summary: A short-lived upwards breakout may continue for another one to few days, before a trend change. The upwards breakout may not make a new all...
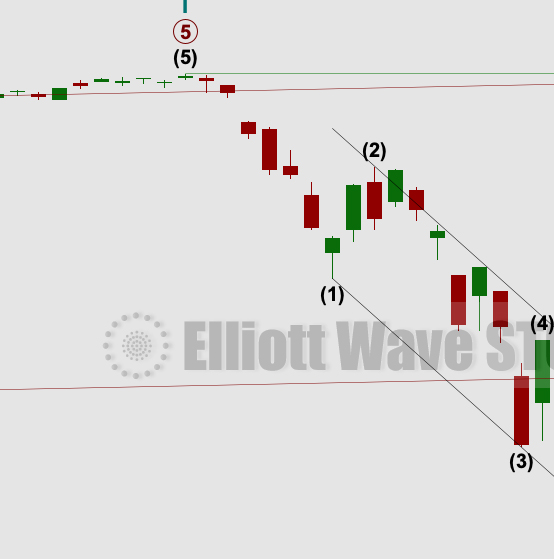
by Lara | Jul 6, 2020 | S&P 500, S&P 500 + DJIA
S&P 500: Elliott Wave and Technical Analysis | Charts – July 6, 2020 The Island Reversal pattern is negated with the second gap closed. Both bullish and bearish Elliott wave counts remain valid. Volume and breadth of this last session is analysed to indicate...
by Lara | Jun 29, 2020 | S&P 500, S&P 500 + DJIA
S&P 500: Elliott Wave and Technical Analysis | Charts – June 29, 2020 Another downwards day was expected. Upwards movement at the end of the session remains below the short-term invalidation point. Summary: The bounce may be over. Downwards movement may resume. A...
by Lara | Jun 24, 2020 | S&P 500, S&P 500 + DJIA
S&P 500: Elliott Wave and Technical Analysis | Charts – June 25, 2020 A lower low and a lower high today saw price move lower, although the session ended with strong upwards movement to close the session green. A downwards day was expected. Summary: The bounce...

by Lara | Jun 10, 2020 | S&P 500, S&P 500 + DJIA
S&P 500: Elliott Wave and Technical Analysis | Charts – June 10, 2020 For the very short term, a small pullback was expected to end about 3,182. The low for the session at 3,181.49 was just 0.51 points below the short-term target. Summary: The next target is at...

by Lara | Jun 4, 2020 | S&P 500, S&P 500 + DJIA
S&P 500: Elliott Wave and Technical Analysis | Charts – June 4, 2020 A sideways day sees small caps lead with new highs, but large caps lag. Summary: The next target is at 3,238. Use the lower edge of the Elliott channel to indicate where support may be found on...


