by Lara | Aug 21, 2020 | S&P 500, S&P 500 + DJIA
S&P 500: Elliott Wave and Technical Analysis | Charts – August 21, 2020 Upwards movement continues. A new alternate Elliott wave count is published this week. Summary: Upwards movement may still complete prior to 3,432.15. However, if price passes 3,432.15, then...
by Lara | Aug 20, 2020 | S&P 500, S&P 500 + DJIA
S&P 500: Elliott Wave and Technical Analysis | Charts – August 20, 2020 Downwards movement overall continued for this session with a lower low and a lower high. Both remaining Elliott wave counts remain valid. Summary: It is possible that a mid or long-term high...
by Lara | Aug 18, 2020 | S&P 500, S&P 500 + DJIA
S&P 500: Elliott Wave and Technical Analysis | Charts – August 18, 2020 A new all time high invalidates the third and fourth wave counts, leaving only two Elliott wave counts. Summary: The trend remains upwards. A trend change may come before 3,432.15. Prior to...
by Lara | Aug 14, 2020 | S&P 500, S&P 500 + DJIA
S&P 500: Elliott Wave and Technical Analysis | Charts – August 14, 2020 Another small range day closes as an inside day. At the end of the week, all four Elliott wave counts remain the same. Summary: The trend remains upwards. A trend change may come before...
by Lara | Aug 10, 2020 | S&P 500, S&P 500 + DJIA
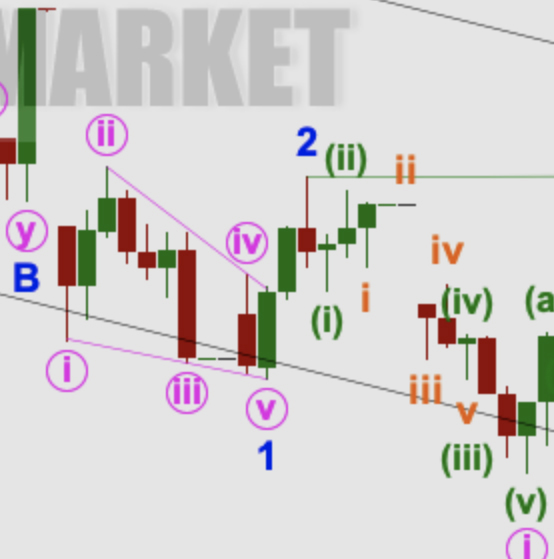
S&P 500: Elliott Wave and Technical Analysis | Charts – August 10, 2020 Upwards movement continues as the first two of four Elliott wave counts have expected. Summary: There is an upwards trend in place. The final target is either for it to end prior to 3,432.15...

by Lara | Aug 4, 2020 | S&P 500, S&P 500 + DJIA
S&P 500: Elliott Wave and Technical Analysis | Charts – August 4, 2020 Price continues to move higher towards the classic analysis target calculated from a small bull flag pattern. The short-term alternate Elliott wave count is now the main Elliott wave count....

by Lara | Aug 3, 2020 | S&P 500, S&P 500 + DJIA
S&P 500: Elliott Wave and Technical Analysis | Charts – August 3, 2020 Another very small range upwards session lacks range, breadth and support from volume. Summary: It is possible that the bounce is over and the bear market has resumed. Slight divergence...
by Lara | Jul 30, 2020 | S&P 500, S&P 500 + DJIA
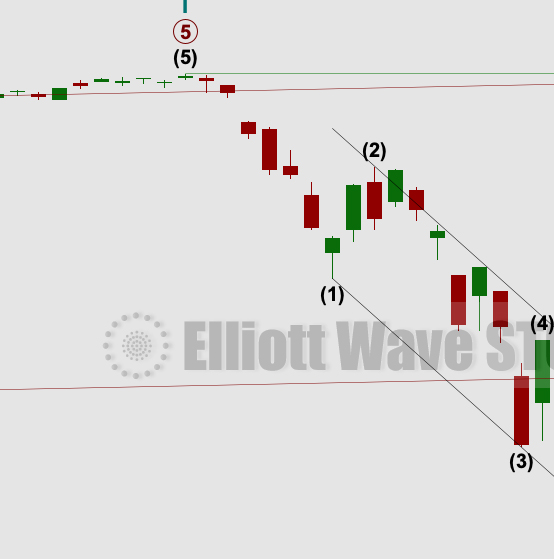
S&P 500: Elliott Wave and Technical Analysis | Charts – July 30, 2020 Price remains range bound with support about 3,200 and resistance about 3,280. Summary: It is possible that the bounce is over and the bear market has resumed. A new low below 3,127.66 would...

by Lara | Jul 29, 2020 | S&P 500, S&P 500 + DJIA
S&P 500: Elliott Wave and Technical Analysis | Charts – July 29, 2020 Upwards movement today remains below the short-term invalidation point on the hourly chart. Summary: With the best fit channel breached, it is possible that the bounce is over and the bear...


