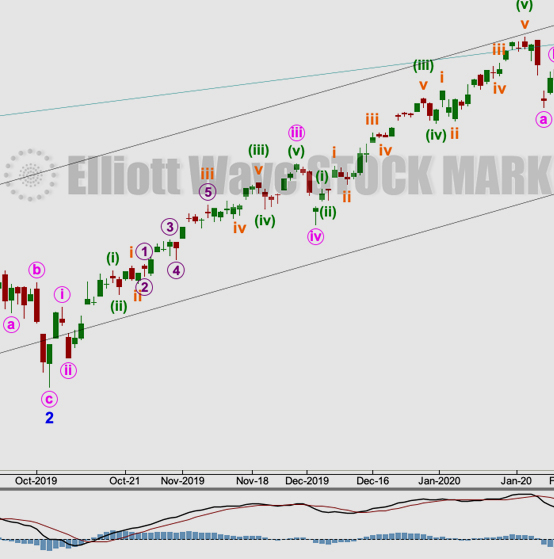
by Lara | Jan 14, 2021 | S&P 500, S&P 500 + DJIA
S&P 500: Elliott Wave and Technical Analysis | Charts – January 14, 2021 Price remains above support after an upwards breakout. Today a signal from the AD line supports the main Elliott wave count. Summary: The wave count expects the low of the 30th of October to...
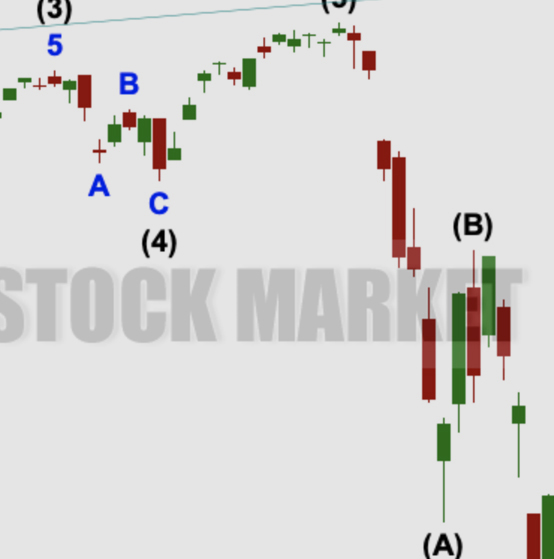
by Lara | Dec 18, 2020 | S&P 500, S&P 500 + DJIA
S&P 500: Elliott Wave and Technical Analysis | Charts – December 18, 2020 The week ended with new all time highs for both price and market breadth. Classic technical analysis supports the main Elliott wave count. Summary: The wave count expects the low of the...
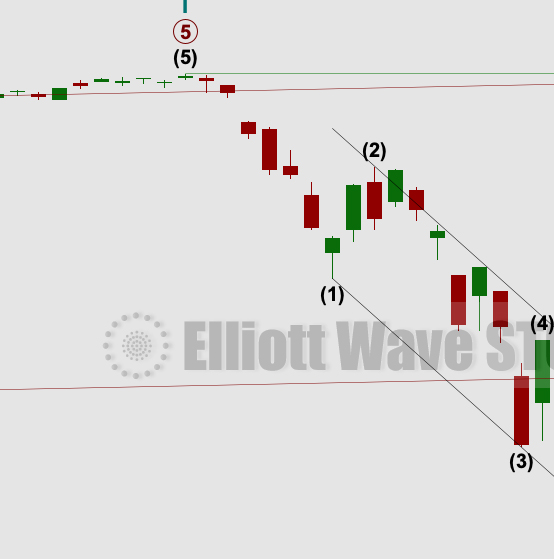
by Lara | Nov 25, 2020 | S&P 500, S&P 500 + DJIA
S&P 500: Elliott Wave and Technical Analysis | Charts – November 25, 2020 A small range inside day after the strength of the prior two sessions may be a pause within the ongoing trend. The main Elliott wave count has strong support from classic technical analysis...

by Lara | Nov 2, 2020 | S&P 500, S&P 500 + DJIA
S&P 500: Elliott Wave and Technical Analysis | Charts – November 2, 2020 Upwards movement remains within a narrow channel on the hourly charts. All three Elliott wave counts remain valid. Summary: The main wave count expects downwards movement to 3,171 and has a...

by Lara | Oct 8, 2020 | S&P 500, S&P 500 + DJIA
S&P 500: Elliott Wave and Technical Analysis | Charts – October 8, 2020 A new all time high from the AD line, a bullish signal from On Balance Volume, and now two back to back 80% up days sees the first two short-term Elliott wave counts discarded in favour of...
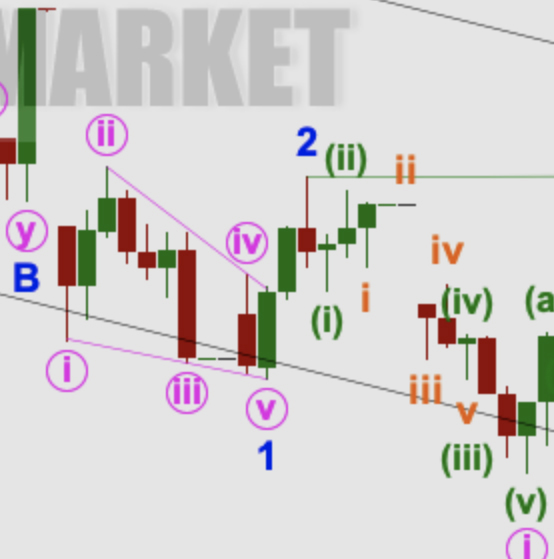
by Lara | Sep 15, 2020 | S&P 500, S&P 500 + DJIA
S&P 500: Elliott Wave and Technical Analysis | Charts – September 15, 2020 A triangle may be continuing sideways. The first hourly chart for both Elliott wave counts expects the breakout to be in the same direction. Summary: A triangle may continue sideways....
by Lara | Aug 20, 2020 | S&P 500, S&P 500 + DJIA
S&P 500: Elliott Wave and Technical Analysis | Charts – August 20, 2020 Downwards movement overall continued for this session with a lower low and a lower high. Both remaining Elliott wave counts remain valid. Summary: It is possible that a mid or long-term high...

by Lara | Jul 28, 2020 | S&P 500, S&P 500 + DJIA
S&P 500: Elliott Wave and Technical Analysis | Charts – July 28, 2020 The very short-term expectation was for a very little more upwards movement to about 3,249.45 before a reversal. Today price reached up to 3,243.72 before sharply reversing at the end of the...
by Lara | Jul 2, 2020 | S&P 500, S&P 500 + DJIA
S&P 500: Elliott Wave and Technical Analysis | Charts – July 2, 2020 Upwards movement for the session breached the short-term invalidation point but remains below identified strong resistance at the Island Reversal. Summary: Downwards movement may resume. For the...


