by Lara | Jul 14, 2020 | S&P 500, S&P 500 + DJIA
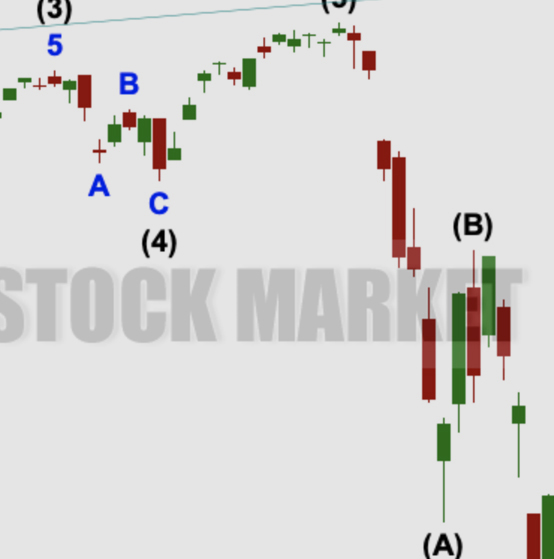
S&P 500: Elliott Wave and Technical Analysis | Charts – July 14, 2020 Downwards movement was expected and a lower low and lower high fit this definition. However, upwards movement dominated the session to end close to a very short-term target given in...
by Lara | Jul 13, 2020 | S&P 500, S&P 500 + DJIA
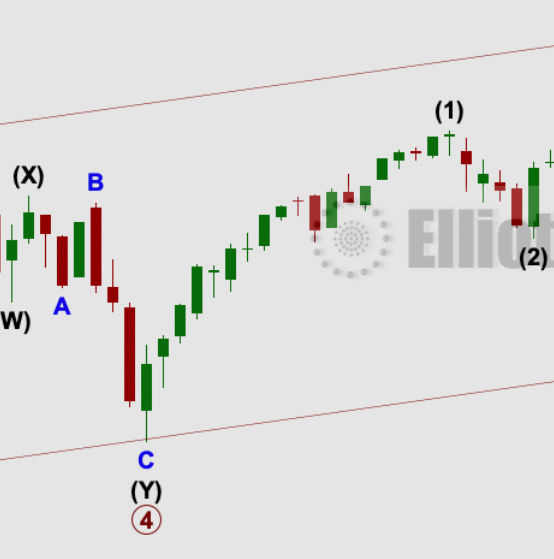
S&P 500: Elliott Wave and Technical Analysis | Charts – July 13, 2020 The main daily wave count was invalidated by 2.19 points. The next alternate wave count is now the main wave count. Summary: This analysis still leans bearish. A sustainable high may be in...
by Lara | Jul 10, 2020 | Gold, Lara's Weekly, S&P 500, US Oil
Lara’s Weekly: Elliott Wave and Technical Analysis of S&P500 and Gold and US Oil | Charts – July 10, 2020 Commentary and charts of Lara’s Weekly, an end of week Elliott Wave and Technical Analysis of the S&P 500 and GOLD and USOIL, for week...
by Lara | Jul 10, 2020 | S&P 500, S&P 500 + DJIA
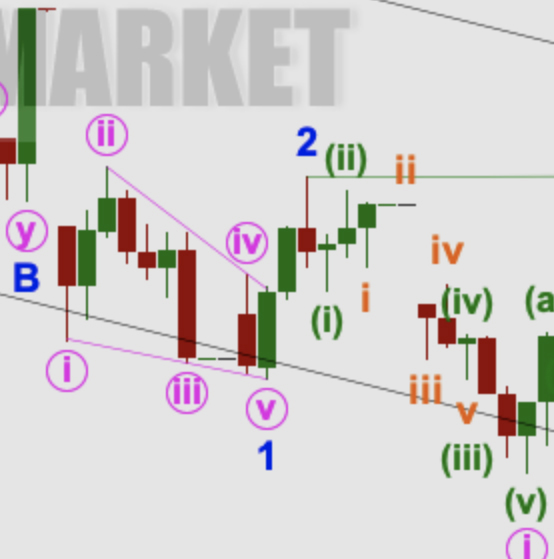
S&P 500: Elliott Wave and Technical Analysis | Charts – July 10, 2020 Upwards movement has breached the short-term invalidation point on the hourly chart but remains below the mid-term invalidation point on the daily chart. Summary: This analysis still leans...
by Lara | Jul 9, 2020 | S&P 500, S&P 500 + DJIA
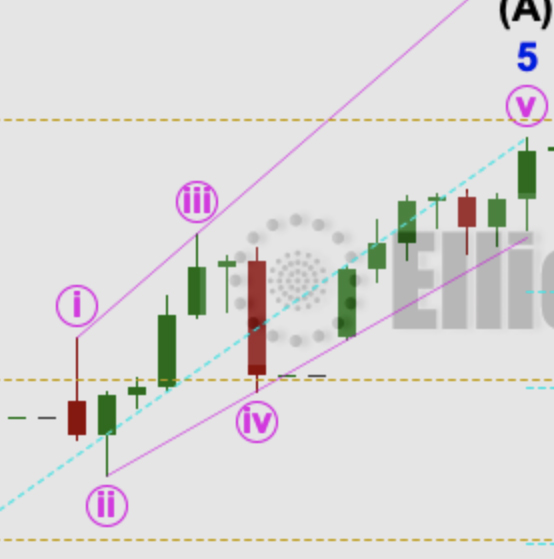
S&P 500: Elliott Wave and Technical Analysis | Charts – July 9, 2020 Again, downwards movement was expected and overall this is what has happened for this session. Summary: This analysis still leans bearish in expecting a sustainable high may be in place on June...
by Lara | Jul 8, 2020 | S&P 500, S&P 500 + DJIA
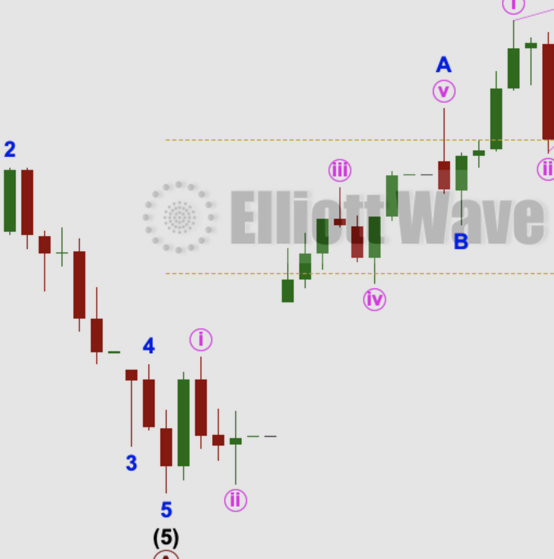
S&P 500: Elliott Wave and Technical Analysis | Charts – July 8, 2020 A lower low and a lower high fit the definition of downwards movement although today’s candlestick has closed green. Price remains below the short-term invalidation point. Summary: This...
by Lara | Jul 7, 2020 | S&P 500, S&P 500 + DJIA
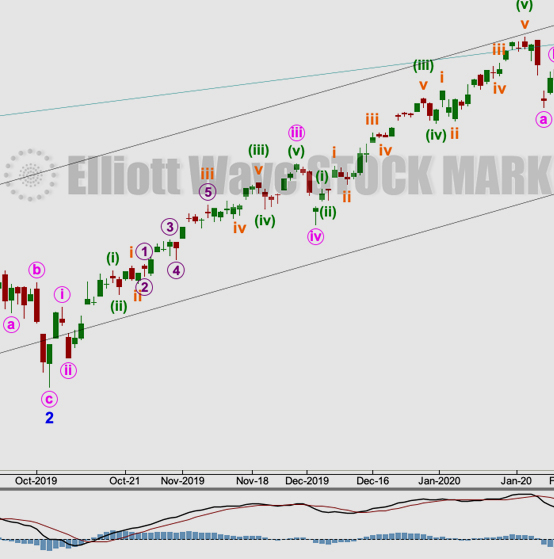
S&P 500: Elliott Wave and Technical Analysis | Charts – July 7, 2020 A short-term target for a little upwards movement was at 3,187. Price reached higher to 3,184.25, 2.85 points below the target, before turning to close lower. Summary: This analysis still leans...
by Lara | Jul 6, 2020 | S&P 500, S&P 500 + DJIA
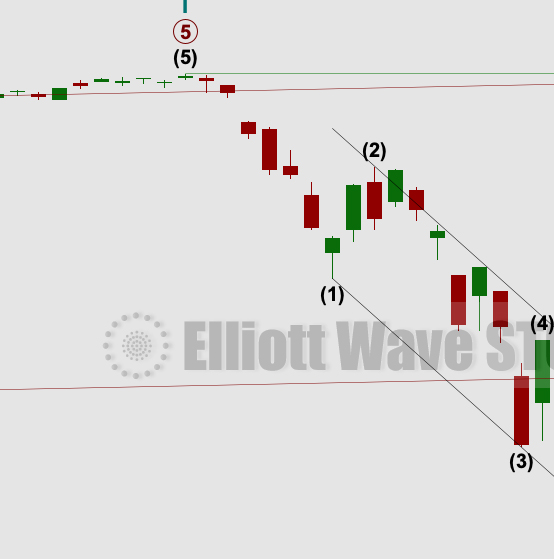
S&P 500: Elliott Wave and Technical Analysis | Charts – July 6, 2020 The Island Reversal pattern is negated with the second gap closed. Both bullish and bearish Elliott wave counts remain valid. Volume and breadth of this last session is analysed to indicate...

by Lara | Jul 4, 2020 | Gold, Lara's Weekly, S&P 500, US Oil
Lara’s Weekly: Elliott Wave and Technical Analysis of S&P500 and Gold and US Oil | Charts – July 3, 2020 Commentary and charts of Lara’s Weekly, an end of week Elliott Wave and Technical Analysis of the S&P 500 and GOLD and USOIL, for week ending...


