by Lara | Jan 6, 2021 | S&P 500, S&P 500 + DJIA
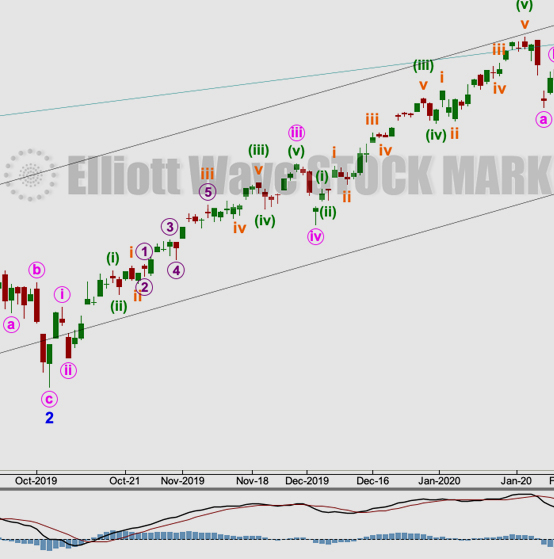
S&P 500: Elliott Wave and Technical Analysis | Charts – January 6, 2021 The main wave count yesterday was judged to have the highest probability. It expected price to continue higher, which is what has happened. Summary: The wave count expects the low of the 30th...
by Lara | Jan 5, 2021 | S&P 500, S&P 500 + DJIA
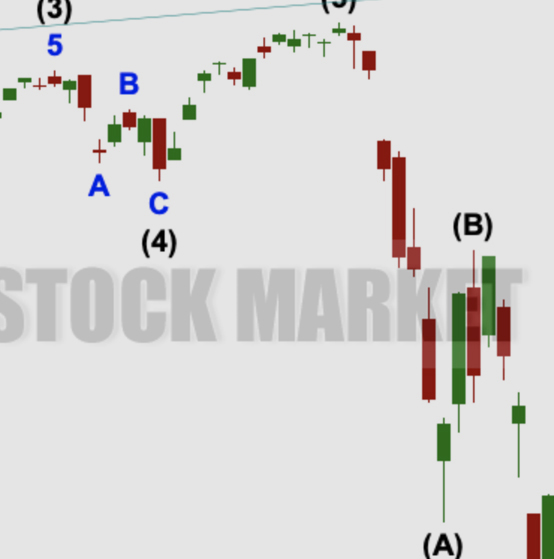
S&P 500: Elliott Wave and Technical Analysis | Charts – January 5, 2021 Four daily charts are presented today to consider various possibilities. They are ranked in order of probability. Summary: The wave count expects the low of the 30th of October to not be...
by Lara | Jan 4, 2021 | S&P 500, S&P 500 + DJIA
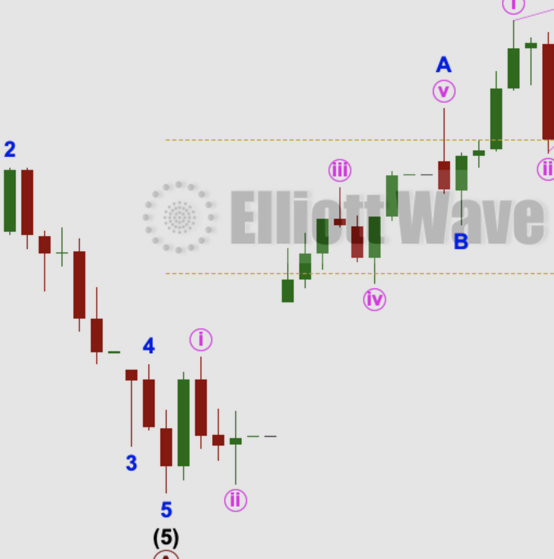
S&P 500: Elliott Wave and Technical Analysis | Charts – January 4, 2021 Downwards movement to begin the new trading year breached the short-term invalidation point on the hourly chart, but price remains within channels and above the invalidation point on the...
by Lara | Jan 1, 2021 | Gold, Lara's Weekly, S&P 500, US Oil
Lara’s Weekly: Elliott Wave and Technical Analysis of S&P500 and Gold and US Oil | Charts – December 31, 2020 Commentary and charts of Lara’s Weekly, an end of week Elliott Wave and Technical Analysis of the S&P 500 and GOLD and USOIL, for week...
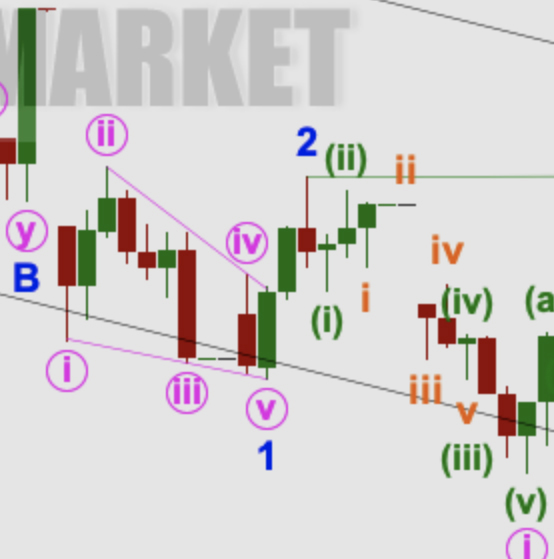
by Lara | Dec 31, 2020 | S&P 500, S&P 500 + DJIA
S&P 500: Elliott Wave and Technical Analysis | Charts – December 31, 2020 The year ends with new all time highs from both price and the AD line. This is exactly in line with the larger picture from the Elliott wave count. Summary: The wave count expects the low...
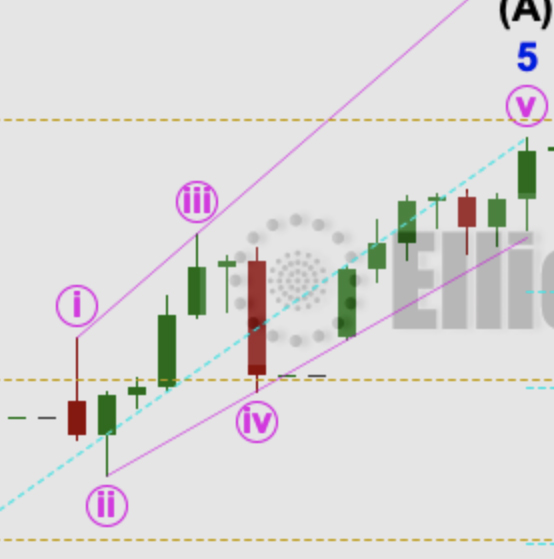
by Lara | Dec 30, 2020 | S&P 500, S&P 500 + DJIA
S&P 500: Elliott Wave and Technical Analysis | Charts – December 30, 2020 A small range inside day leaves the Elliott wave count unchanged. Today the AD line gives a signal suggesting the direction for tomorrow. Summary: The wave count expects the low of the 30th...
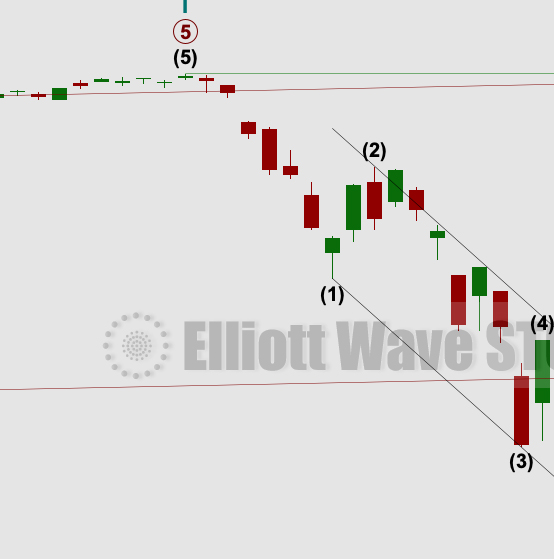
by Lara | Dec 29, 2020 | S&P 500, S&P 500 + DJIA
S&P 500: Elliott Wave and Technical Analysis | Charts – December 29, 2020 A higher high and a higher low complete another upwards session. However, a strong close lower completes a bearish candlestick pattern. Summary: The wave count expects the low of the 30th...

by Lara | Dec 28, 2020 | S&P 500, S&P 500 + DJIA
S&P 500: Elliott Wave and Technical Analysis | Charts – December 28, 2020 New all time highs fits expectations from this analysis. Price continues to climb towards the next target. Summary: The wave count expects the low of the 30th of October to not be breached...

by Lara | Dec 25, 2020 | Gold, Lara's Weekly, S&P 500, US Oil
Lara’s Weekly: Elliott Wave and Technical Analysis of S&P500 and Gold and US Oil | Charts – December 24, 2020 Commentary and charts of Lara’s Weekly, an end of week Elliott Wave and Technical Analysis of the S&P 500 and GOLD and USOIL, for week...


