Downwards movement was expected for Wednesday, but it did not happen.
Summary: The Elliott wave count expects more upwards movement from here to show an increase in upwards momentum and be supported by volume. Some increase in volume today supports this idea. The short term target remains at 2,180 and the final target at 2,240. However, hidden bearish divergence between price and On Balance Volume, RSI, inverted VIX and the AD line gives some cause for concern over this prediction.
Last monthly chart for the main wave count is here.
New updates to this analysis are in bold.
MAIN WAVE COUNT
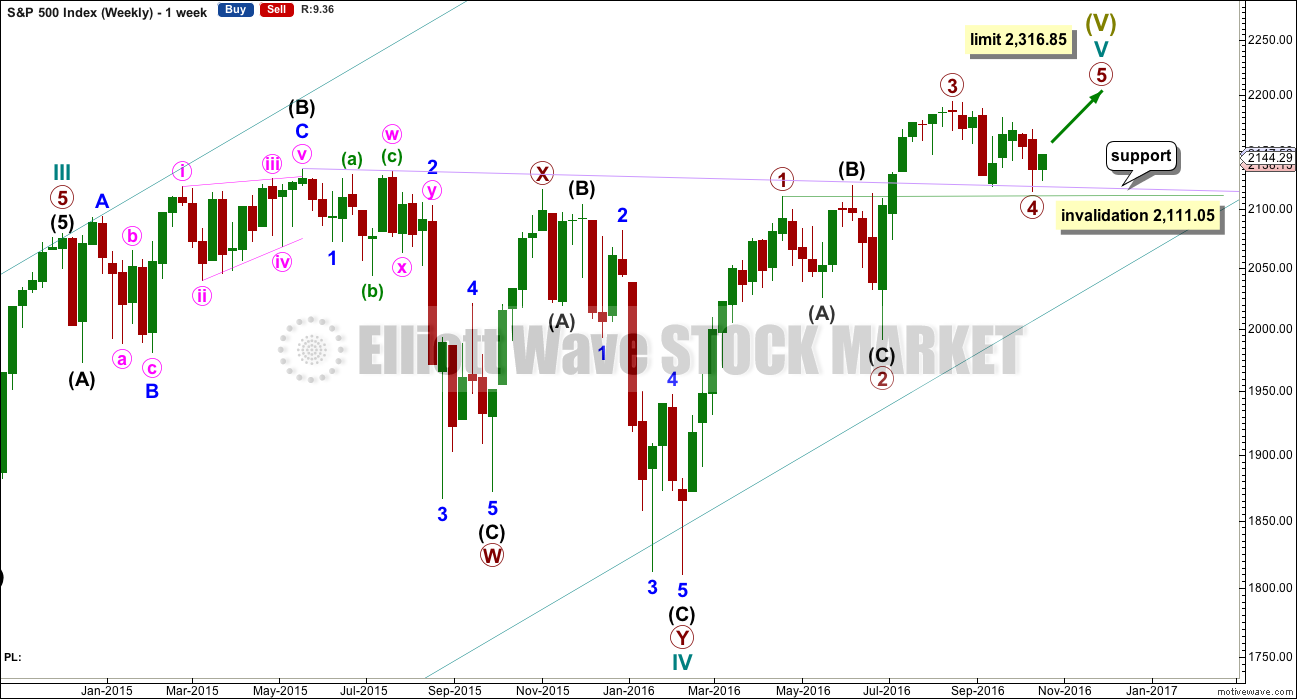
WEEKLY CHART
Cycle wave V must subdivide as a five wave structure. I have two wave counts for upwards movement of cycle wave V. This main wave count is presented first only because we should assume the trend remains the same until proven otherwise. Assume that downwards movement is a correction within the upwards trend, until proven it is not.
Primary wave 3 is shorter than primary wave 1, but shows stronger momentum and volume as a third wave normally does. Because primary wave 3 is shorter than primary wave 1 this will limit primary wave 5 to no longer than equality in length with primary wave 3, so that the core Elliott wave rule stating a third wave may not be the shortest is met. Primary wave 5 has a limit at 2,316.85.
Primary wave 2 was a shallow 0.40 expanded flat correction. Primary wave 4 may have ended as a shallow 0.39 double zigzag. There is no alternation in depth, but there is good alternation in structure.
Primary wave 4 may not move into primary wave 1 price territory below 2,111.05.
It is also possible to move the degree of labelling within cycle wave V all down one degree. It may be only primary wave 1 unfolding. The invalidation point for this idea is at 1,810.10. That chart will not be published at this time in order to keep the number of charts manageable. The probability that this upwards impulse is only primary wave 1 is even with the probability that it is cycle wave V in its entirety.
When the five wave structure upwards labelled primary wave 5 is complete, then my main wave count will move the labelling within cycle wave V all down one degree and expect that only primary wave 1 may be complete. The labelling as it is here will become an alternate wave count. This is because we should always assume the trend remains the same until proven otherwise. We should always assume that a counter trend movement is a correction, until price tells us it’s not.
DAILY CHART
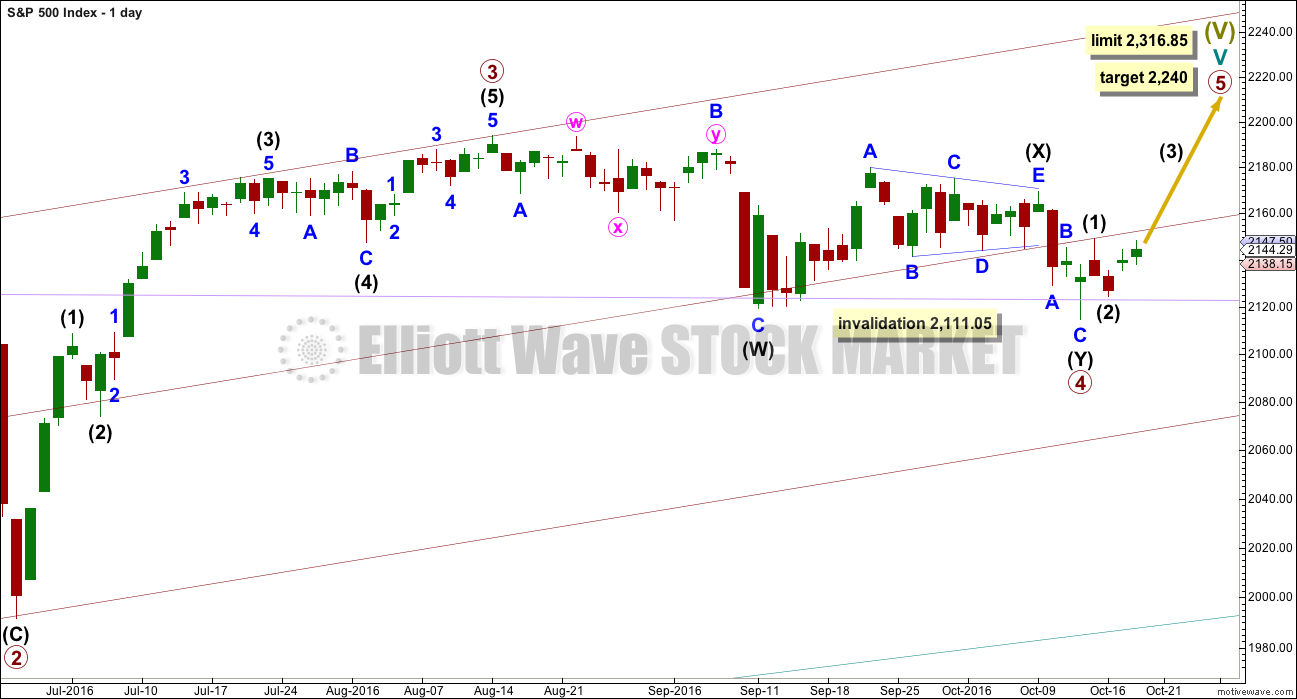
Primary wave 3 is moved to the last all time high. If it ended there, then this is where primary wave 4 has begun.
Primary wave 3 is 16.14 points longer than 0.618 the length of primary wave 1. This is a reasonable difference. But as it is less than 10% the length of primary wave 3, it is my judgement that it is close enough to say these waves exhibit a Fibonacci ratio to each other.
If this pattern continues, then about 2,240 primary wave 5 would reach 0.618 the length of primary wave 3. If this target is wrong, it may be too high. When intermediate waves (1) through to (4) are complete, then the target may be changed as it may be calculated at a second degree.
There is good proportion for this wave count. Primary wave 1 lasted 46 days, primary wave 2 lasted 47 days, primary wave 3 lasted a Fibonacci 34 days, and primary wave 4 lasted 42 days. So far primary wave 5 has lasted four days. If it exhibits a Fibonacci duration, it is likely to be more brief than primary wave 3. A Fibonacci 13 days may be reasonably likely at this stage. That would see primary wave 5 end on 1st of November. It does not look like primary wave 5 may manage to end now within October, because it is moving too slowly so far to complete in a Fibonacci 8 days on the 25th of October.
Primary wave 4 fits perfectly as a double zigzag. The second zigzag in the double should have ended with a small overshoot of the lilac trend line. This line should provide very strong support. There is almost no room left for primary wave 4 to move into.
If primary wave 4 continues any further, it may not move into primary wave 1 price territory below 2,111.05.
Primary wave 5 must be a five wave structure, so it is most likely to be a simple impulse. It may be relatively quick, and would be very likely to make at least a slight new high above the end of primary wave 3 at 2,193.81 to avoid a truncation.
Because primary wave 5 must be shorter in length than primary wave 3, each of its sub-waves should be shorter in length and duration. For this reason intermediate waves (1) and (2) are labelled as complete within primary wave 5. Intermediate wave (2) may today have ended when price came to almost again touch the lilac trend line.
HOURLY CHART
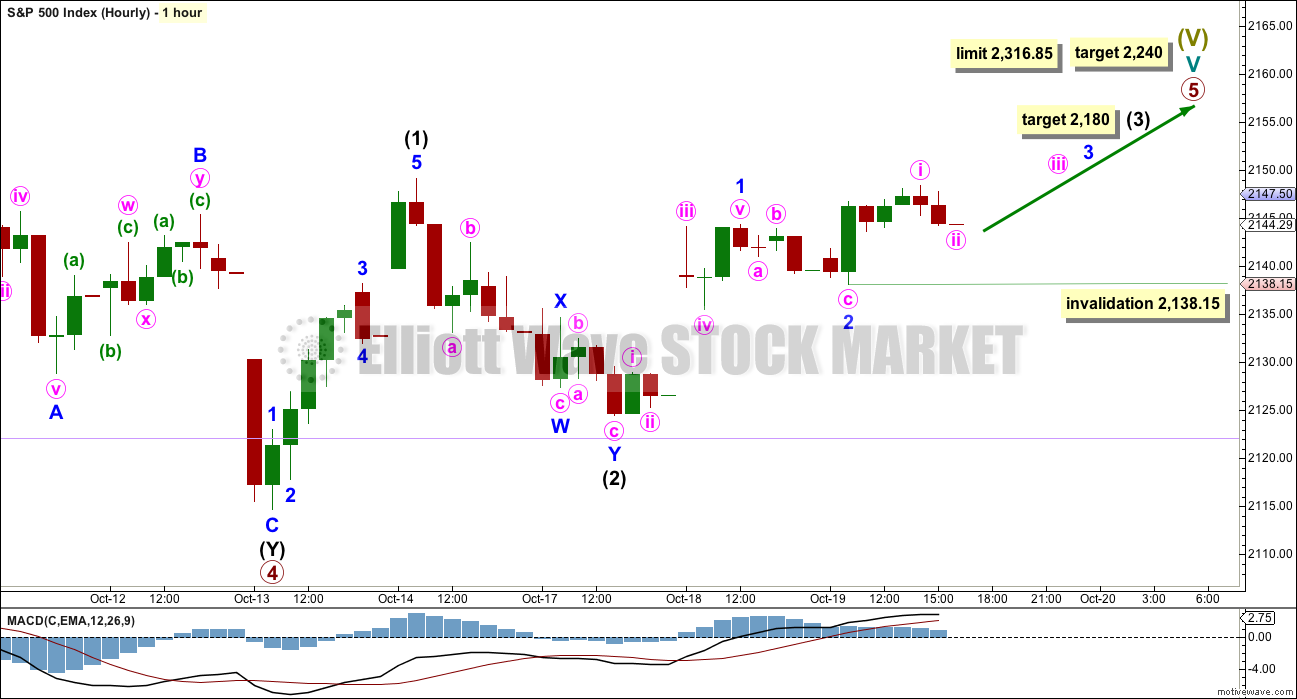
Downwards movement for intermediate wave (2) fits well as a double zigzag. This downwards wave fits better as a three than it does as a five.
Upwards movement to today’s high fits well as a five wave impulse. This may be minor wave 1 within intermediate wave (3).
Intermediate wave (3) must move beyond the end of intermediate wave (1) above 2,149.19. It must move far enough above this point to allow room for a subsequent fourth wave to unfold and remain above first wave price territory.
Intermediate wave (3) may only subdivide as an impulse.
Intermediate wave (3) should show an increase in upwards momentum beyond that seen for intermediate wave (1). So far it has done that. It should also show support from volume. So far it has still not done that.
At 2,180 intermediate wave (3) would reach 1.618 the length of intermediate wave (1).
Minor wave 2 now looks like it was over as a brief shallow zigzag. Minor wave 3 may have begun. Within minor wave 3, minute wave ii may not move beyond the start of minute wave i below 2,138.15.
This wave count expects to see an increase in strength with more upwards movement tomorrow and the following few days.
ALTERNATE WAVE COUNT
WEEKLY CHART
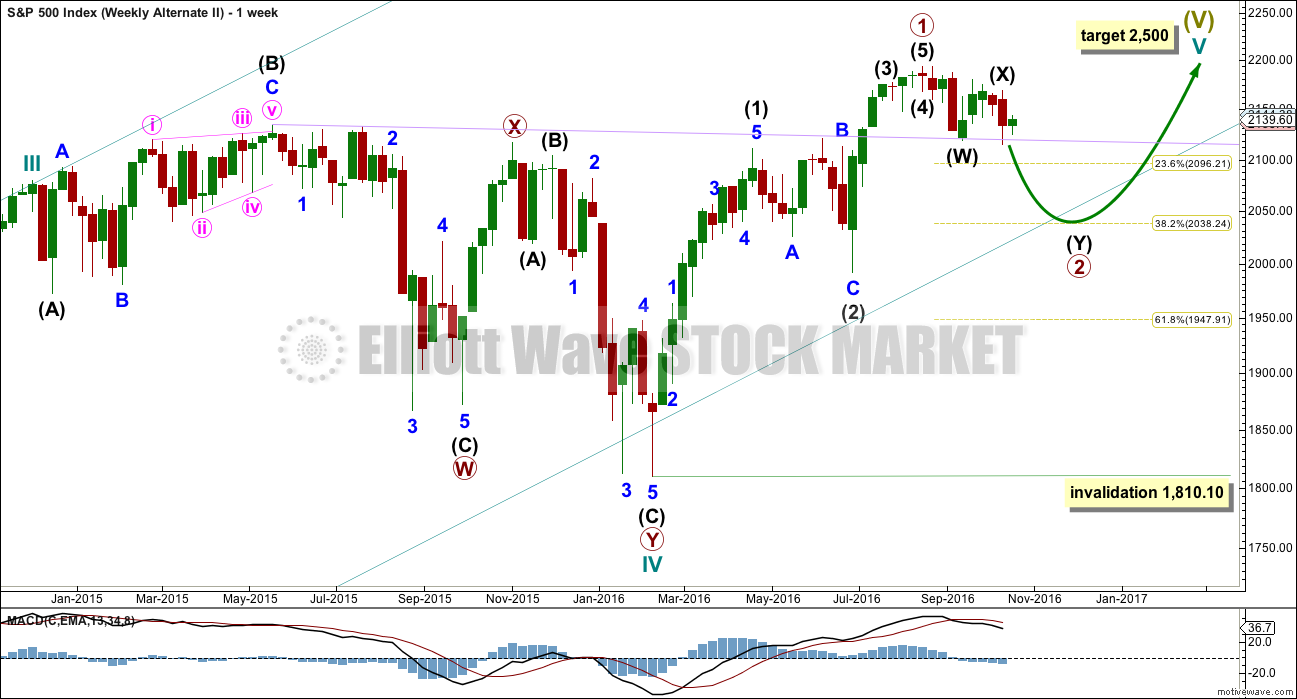
What if an impulse upwards is complete? The implications are important. If this is possible, then primary wave 1 within cycle wave V may be complete.
With downwards movement from the high of primary wave 1 now clearly a three and not a five, the possibility that cycle wave V and Super Cycle wave (V) are over has substantially reduced. This possibility would be eliminated if price can make a new all time high above 2,193.81.
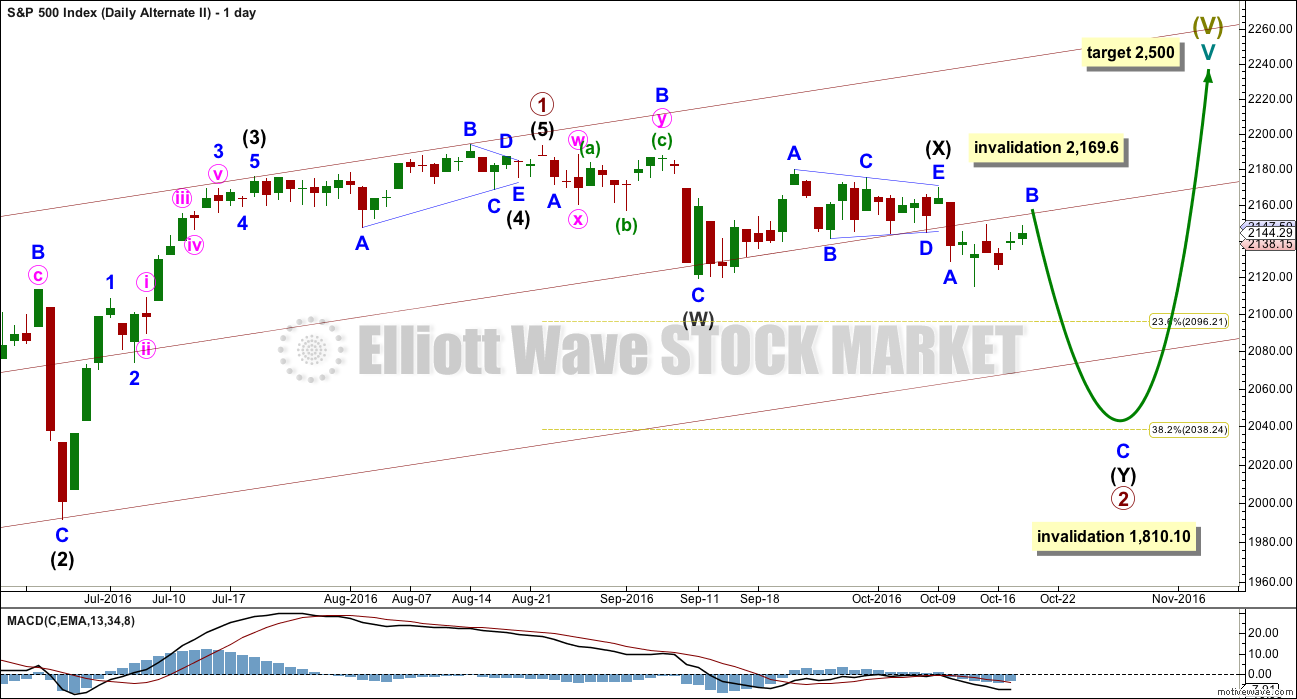
If an impulse upwards is complete, then a second wave correction may be unfolding for primary wave 2. Expectations on how deep primary wave 2 is likely to be are now adjusted. It may be expected now to more likely only reach the 0.382 Fibonacci ratio about 2,038.
At this stage, it looks like price has found strong support at the lilac trend line.
Primary wave 2 may not move beyond the start of primary wave 1 below 1,810.10.
DAILY CHART
If an impulse upwards is complete, then how may it subdivide and are proportions good?
Intermediate wave (1) was an impulse lasting 47 days. Intermediate wave (2) was an expanded flat lasting 47 days. Intermediate wave (3) fits as an impulse lasting 16 days, and it is 2.04 points short of 0.618 the length of intermediate wave (1). So far this alternate wave count is identical to the main wave count (with the exception of the degree of labelling, but here it may also be moved up one degree).
Intermediate wave (4) may have been a running contracting triangle lasting 22 days and very shallow at only 0.0027 the depth of intermediate wave (3). At its end it effected only a 0.5 point retracement. There is perfect alternation between the deeper expanded flat of intermediate wave (2) and the very shallow triangle of intermediate wave (4). All subdivisions fit and the proportion is good.
Intermediate wave (5) would be very brief at only 18.29 points. Intermediate wave (5) is 1.43 points longer than 0.056 the length of intermediate wave (1).
At this stage, primary wave 2 now has a completed zigzag downwards that did not reach the 0.236 Fibonacci ratio. It is very unlikely for this wave count that primary wave 2 is over there; the correction is too brief and shallow. Upwards movement labelled intermediate wave (X) is so far less than 0.9 the length of the prior wave down labelled intermediate wave (W). The minimum for a flat correction has not been met. Primary wave 2 may continue lower as a double zigzag. A second zigzag in the double may be required to deepen the correction closer to the 0.382 Fibonacci ratio.
Intermediate wave (W) lasted a Fibonacci 13 sessions. Intermediate wave (X) is a complete triangle. X waves may subdivide as any corrective structure (including multiples), and a triangle is possible here.
If minor wave B within the second zigzag of intermediate wave (Y) moves any higher, it may not move beyond the start of minor wave A above 2,169.60.
Primary wave 2 may not move beyond the start of primary wave 1 below 1,810.10. A new low below this point would see the degree of labelling within cycle wave V moved up one degree. At that stage, a trend change at Super Cycle degree would be expected and a new bear market to span several years would be confirmed.
HOURLY CHART
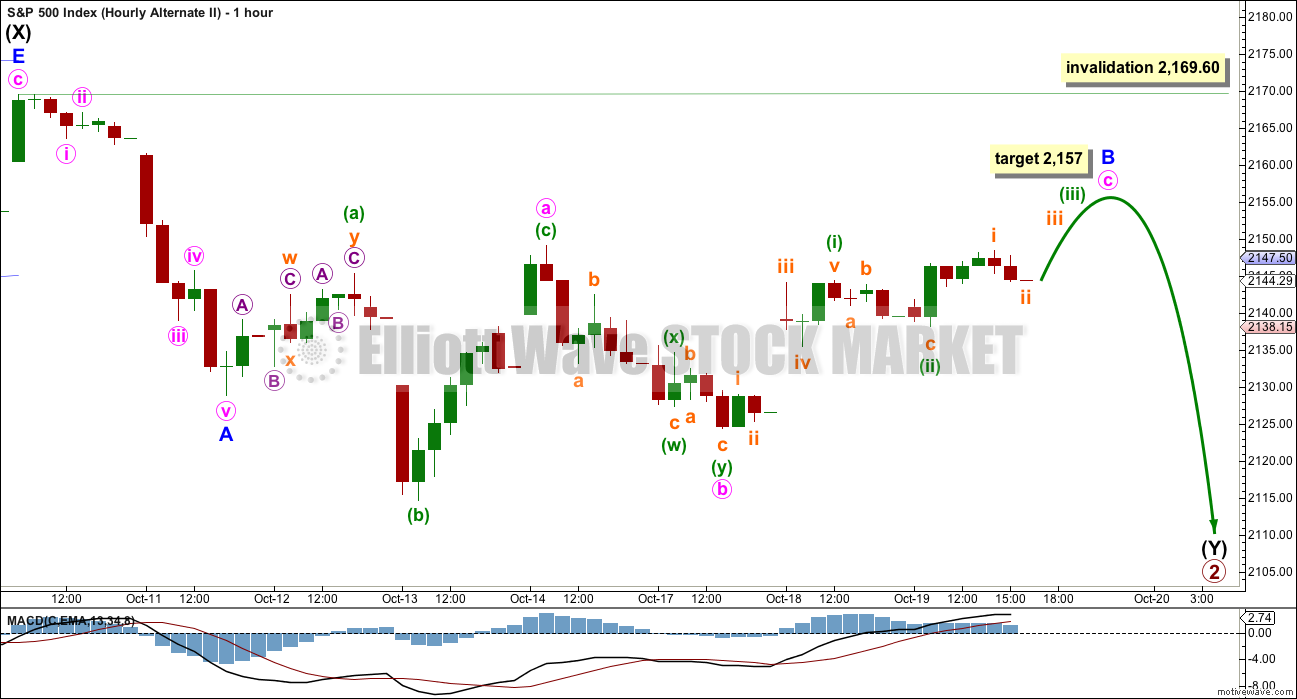
Intermediate wave (Y) should subdivide as a zigzag to deepen the correction.
This wave count is adjusted today to see minor wave B incomplete because this has a better fit with subdivisions of recent movement.
Minor wave B may be an incomplete expanded flat correction. Minute wave a is a three, itself a flat. Minute wave b is a three, a double zigzag. Minute wave b is a 1.22 length of minute wave a.
At 2,157 minute wave c would reach 1.618 the length of minute wave a. Minute wave c must subdivide as a five wave structure.
This wave count requires confirmation with a new low below 2,111.05 before it should be used.
TECHNICAL ANALYSIS
WEEKLY CHART
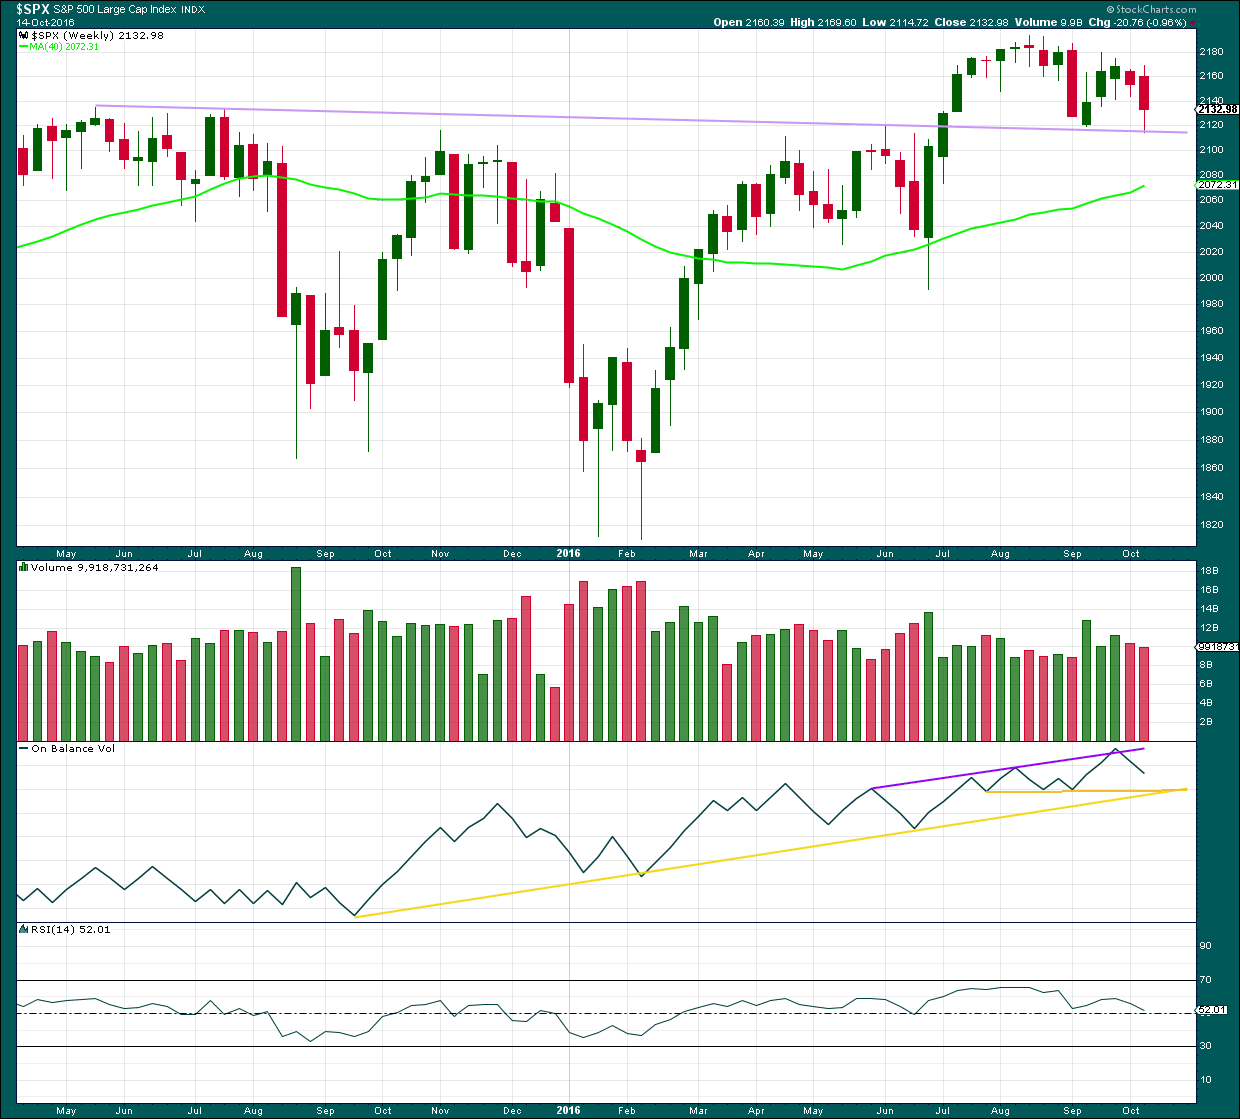
Click chart to enlarge. Chart courtesy of StockCharts.com.
The lilac trend line has strong technical significance. Price broke through resistance, turned down to test support for the first time, and then moved up and away from this line. It was reasonable to conclude that a new all time high is a likely consequence of this typical behaviour.
Now price has come back down for a second test of the lilac trend line. This line is expected to continue to provide support because support at this line is so strong. A break below this line would be a highly significant bearish signal.
Volume for a second downwards week is slightly lighter than the prior upwards week. The fall in price has less support from volume but not by much.
Volume for the two downwards weeks is lighter than two out of three of the prior upwards weeks. Mid term, at the weekly chart level, it still looks like price has more support for upwards movement than downwards from volume.
On Balance Volume has some distance to go before it finds support at either of the yellow lines.
RSI is close to neutral. There is plenty of room for price to rise or fall. There is no mid term divergence between price and RSI to indicate weakness.
DAILY CHART
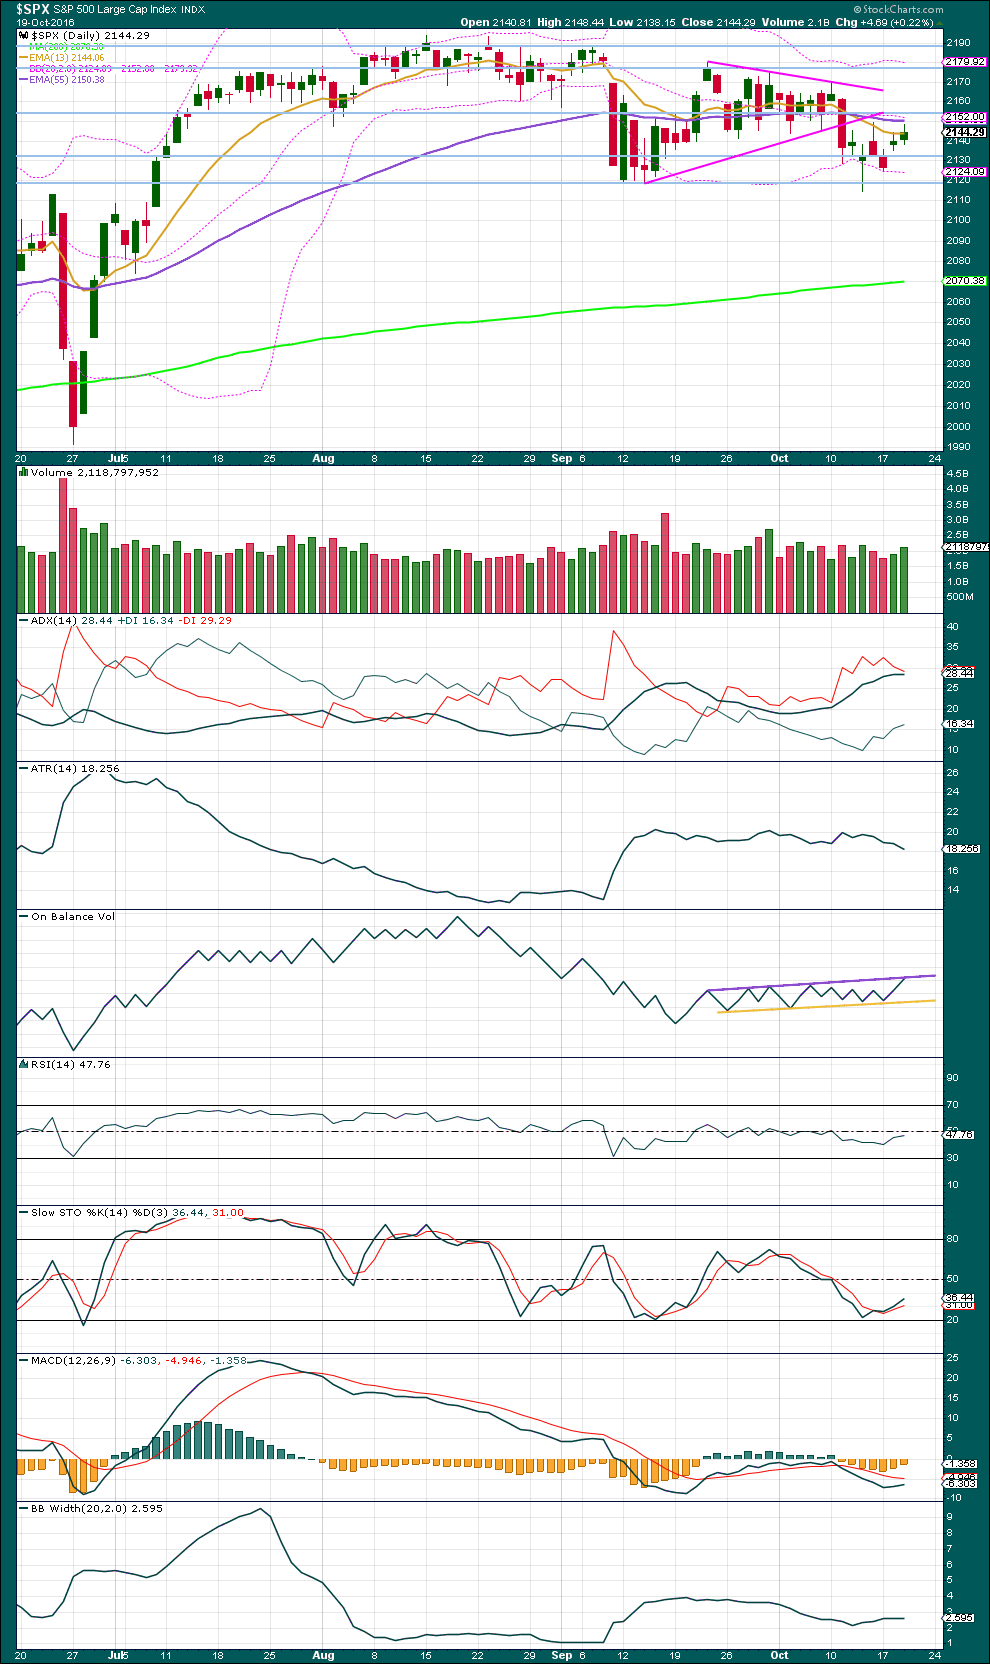
Click chart to enlarge. Chart courtesy of StockCharts.com.
Another small range upwards day comes with some increase in volume. There was some support today for upwards movement from volume, so it is no longer suspicious.
Price may find resistance about 2,155, 2,180 and finally about 2,190.
ADX today is exactly flat at 28.44, the same as yesterday. It no longer indicates a downwards trend is in place. It does not yet indicate a trend change though: the -DX line remains above the +DX line.
ATR and Bollinger Bands agree that this market is not trending. ATR is declining and Bollinger Bands are steady.
The lower yellow support line on On Balance Volume is slightly adjusted today because OBV turned upwards. OBV is now at the upper purple line. If OBV breaks above the purple line tomorrow, that would be a strong bullish signal and should be taken seriously, OBV works well with trend lines more often than not. Some resistance may be expected here, and this resistance may force price to move lower tomorrow.
There is some short term divergence between price and OBV: OBV today made a new high above the prior high of the 14th of October, but price has made a slightly lower high. This is hidden bearish divergence (explained here in this cheat sheet courtesy of Baby Pips). Price is weak. This does not support the main Elliott wave count. However, OBV does not work very well with divergence.
There is also the same hidden bearish divergence today between price and RSI: RSI made a higher high above the prior high of the 14th of October, but price failed to make a corresponding higher high. This indicates weakness in price.
Stochastics is returning from just above oversold; price may be returning from support. It would be reasonable to expect overall a continuation of an upwards swing from price here to end only when it reaches resistance and Stochastics is close to overbought at the same time.
VOLATILITY – INVERTED VIX CHART
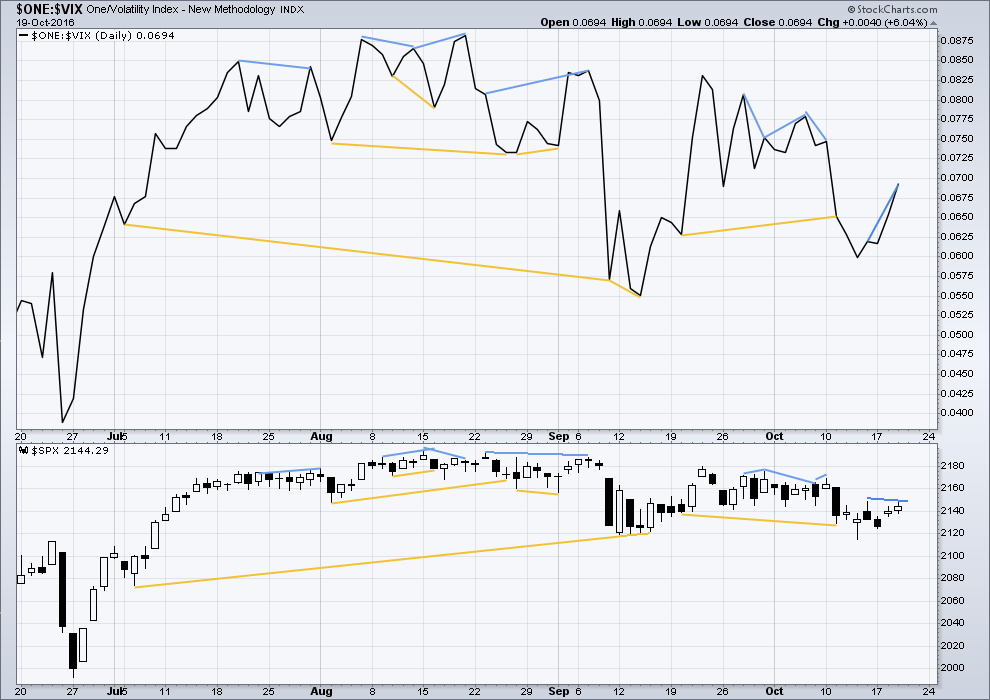
Click chart to enlarge. Chart courtesy of StockCharts.com.
There are a few instances of multi day divergence between price and inverted VIX noted here. Bearish divergence is blue. Bullish divergence is yellow. It appears so far that divergence between inverted VIX and price is again working to indicate short term movements spanning one or two days.
There is still short term divergence today between price and inverted VIX: VIX has made a new high above the prior high four sessions ago on the 14th of October, but price has made a slightly lower high. This divergence is bearish and indicates weakness in price. One or two days of downwards movement may be expected. At this stage, this does not support the Elliott wave count. This divergence often works but not always.
BREADTH – AD LINE
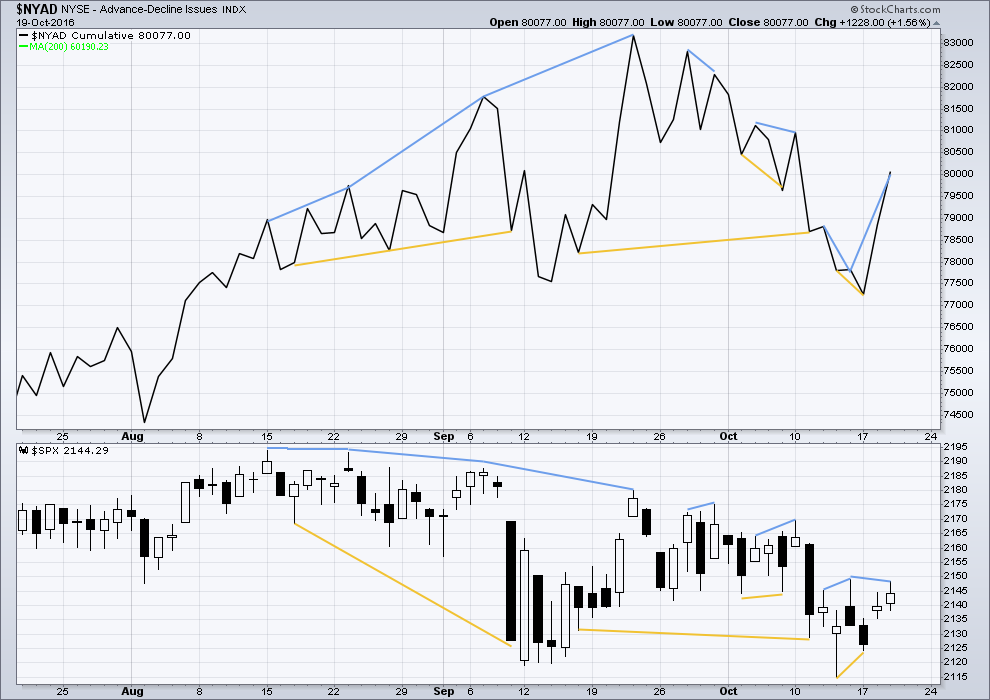
Click chart to enlarge. Chart courtesy of StockCharts.com.
Short term bullish and bearish divergence is again working between price and the AD line to show the direction for the following one or two days.
The AD line today made a higher high above the prior high four sessions ago on the 14th of October, but price has made a lower high. This is hidden bearish divergence and indicates weakness in price. One or two days of overall downwards movement may be expected. This does not support the main Elliott wave count. This divergence often works but not always.
If price makes a new high tomorrow above 2,149.19, the high of the 14th of October, then this hidden bearish divergence noted between price and OBV, RSI, inverted VIX and the AD line will no longer exist. At that stage, it will not be indicating any downwards movement, so price would have “caught up”.
DOW THEORY
Major lows within the old bull market:
DJIA: 15,855.12 (15th October, 2014) – closed below on 25th August, 2015.
DJT: 7,700.49 (12th October, 2014) – closed below on 24th August, 2015.
S&P500: 1,821.61 (15th October, 2014) – has not closed below this point yet.
Nasdaq: 4,117.84 (15th October, 2014) – has not closed below this point yet.
Major highs within the bear market from November 2014:
DJIA: 17,977.85 (4th November, 2015) – closed above on 18th April, 2016.
DJT: 8,358.20 (20th November, 2015) – has not closed above this point yet.
S&P500: 2,116.48 (3rd November, 2015) – closed above this point on 8th June, 2016.
Nasdaq: 5,176.77 (2nd December, 2015) – closed above this point on 1st August, 2016.
Dow Theory Conclusion: Original Dow Theory still sees price in a bear market because the transportations have failed to confirm an end to that bear market. Modified Dow Theory (adding S&P and Nasdaq) has failed still to confirm an end to the old bull market, modified Dow Theory sees price still in a bull market.
This analysis is published @ 09:21 p.m. EST.

Both UVXY and VXX made new 52 week lows today. It would be a most unusual event for a sustained rally of any sort to commence from these levels of complacency. Very bearish imo…
Re-buying VIX 14.50 calls for 0.55 per conract….
The context of price action the last few weeks makes this the most incredible level of complacency I have ever seen in the markets in all my years of trading. VIX trading under 14 in the month of October??!!
Absolutely amazing!! 🙂
That invalidation point was far too close, not allowing room for minor 2 to move lower and be deeper (more normal).
I expect today that is what happened.
This wave is really taking its time. I don’t think it can end in October now.
We are waiting for the US Presidential election to complete. If Secretary Clinton wins, I think we see a strong pop up past 2200. Just a guess.
If it’s true that Wall St favours Clinton, then yes. I’d expect that may be the case.
Lara if you have a moment would it be possible if you could do a update for the FTSE plz? I do have a count, but recent action has got me thinking.
Okay. Time permitting.
I completely appreciate that Lara, many thanks.
One has to wonder how long this kind of price action can go on. The markets continue to attempt to fall out of a series of bearish rising wedges and the banksters seem determined to arrest every attempt. Something’s gotta give….
IKR! It’s exhausting!
I’m over it. I wish this thing would hurry up and end already. This sideways chop is a nightmare to analyse and I’ve barely traded it at all. Despite spending hours and hours analysing the darn thing.
If I didn’t have to do it everyday for you all I’d probably only give it a cursory glance day to day, and focus on markets that are trending.
EURUSD is starting a downwards wave everybody. Go short there. Make some money somewhere.
Yep! It just broke an important support shelf and it should be smooth sailing to the downside. I rolled a few bearish call spreads today and added to my short position. Pay attention people… you just go a nice bonus trade! 🙂
Lara, I suggest you consider revising your publication schedule to allow for days like today that present no reason reason to update. I don’t mind. I also suggest you consider a vacation period where you can be away from post for more extended periods. All work and no play makes Jill or Jack, well ….a dull girl or boy, boring.
Life is too short to let it slip away easily.
Speaking of which, in a few days I am headed to the mountains for all of next week. It is one of my favorite times as the snow begins to fall in the mountains of the northern hemisphere. The mountains in snow are awesome. But right now all the animals are scrambling to finish preparations for winter. You only go around once in life. So, grab a little gusto while you can.
I manage to catch some waves when there’s surf, as long as I can do that I can work every day 🙂 I live to surf, and surf to live.
I will be having a holiday at Christmas / New Years. Two weeks. I’m looking forward to it very much. Once a year, that’s necessary for my sanity.
Not sure where we’ll go… maybe Gisborne. Great surf there, and my best girlfriend lives there too 🙂
Have a lovely time in the mountains Rodney. May it be uplifting for your soul. Come back and let us know if that bear is hibernating, or if he’s pissed off enough to go on a rampage down Wall St. LOL
Another role out of a bearish rising wedge; shockingly catching a bid as it breaches support.
One of these breaks is likely to eventually break some pivots. I fully expect that spigots will be opened to quickly buy the market back above them…or, at the
very least, give it the old college try…
Curioser and curioser. Fifth wave truncation in DJI on that impulse down; a clear five down in SPX.
Selling 500 VIX 14.50 strike calls October 26 expiration for 0.90 per contract.
Open order to sell remaining 500 @1.25…
Taking profits on IWM bear call spread and rolling profits into new spread with later expiration…
Bought to open 1000 VIX 14.50 strike calls expiring October 26 @ 0.65 per contract.
Lara… thanks for posting the link to the divergence cheat sheet yesterday.
I think the “hidden” divergences are much more esoteric and opaque than the normal ones and that the normal ones -to my mind- seem more reliable but even then only when combined with other indicators .
It also strikes me that the hidden ones are more subjective.
Personally I would look for bullish divergence at a low and then look to go long once there had been a break back above an RSI oversold line . Of course like all things this strategy needs some other inputs.
This ALWAYS works…… until it doesn’t. 🙂
Yes, I agree.
I see that hidden divergence interpreted in two ways. Commonly it is interpreted as “price must catch up”, as the indicator or oscillator are leading price.
And because no divergence will work all the time, when price does catch up that interpretation is deemed correct.
But I don’t think so. Because price is the ultimate determinator. The interpretation that price is weak (in either direction) puts the focus on what price is doing now, not on what an indicator says it should do. It puts price first. So to me that makes sense.
And I do agree with you that hidden divergence does seem to be less reliable than regular divergence. I’ll add too that neither seem to be overly reliable. More often than not they work, but fairly often they don’t.
This is just a gut judgement though, I’ve not done any quantitative analysis of it.
I like and appreciate the idea that price must be the primary and ultimate indicator. That is why when price first broke 2134 SPX in early July I became bullish with your EW count. It took two days to make that switch because it was a major about face from a long held bearish position.
We have basically gone sideways since. But I still think if we are going to have price as the primary and ultimate indicator, we must follow it and allow it to be even when we do not understand fully.
I agree. And it’s pointless trying to trade against price. That’s not going to work 🙂
woo hoo
Woo hoo
Three days in a row
You’re on a roll Doc 🙂