A red daily candlestick or doji was expected for Friday, but this did not happen.
Upwards movement slightly breached the invalidation point on the hourly chart.
Summary: Two days of downwards movement to 2,137 is expected. Divergence with price and the AD line and VIX supports the view that price is likely to move lower for one or two days. Thereafter, price should turn up to make a new high above 2,179.58.
Last monthly chart for the main wave count is here.
New updates to this analysis are in bold.
MAIN WAVE COUNT
WEEKLY CHART
Cycle wave V must subdivide as a five wave structure. I have two wave counts for upwards movement of cycle wave V. This main wave count is presented first only because we should assume the trend remains the same until proven otherwise. Assume that downwards movement is a correction within the upwards trend, until proven it is not.
Primary wave 3 is shorter than primary wave 1, but shows stronger momentum and volume as a third wave normally does. Because primary wave 3 is shorter than primary wave 1 this will limit primary wave 5 to no longer than equality in length with primary wave 3, so that the core Elliott wave rule stating a third wave may not be the shortest is met. Primary wave 5 has a limit at 2,302.47.
Primary wave 2 was a shallow 0.40 expanded flat correction. Primary wave 4 may be exhibiting alternation as a more shallow combination.
Primary wave 4 may not move into primary wave 1 price territory below 2,111.05.
It is also possible to move the degree of labelling within cycle wave V all down one degree. It may be only primary wave 1 unfolding. The invalidation point for this idea is at 1,810.10. That chart will not be published at this time in order to keep the number of charts manageable. The probability that this upwards impulse is only primary wave 1 is even with the probability that it is cycle wave V in its entirety.
DAILY CHART
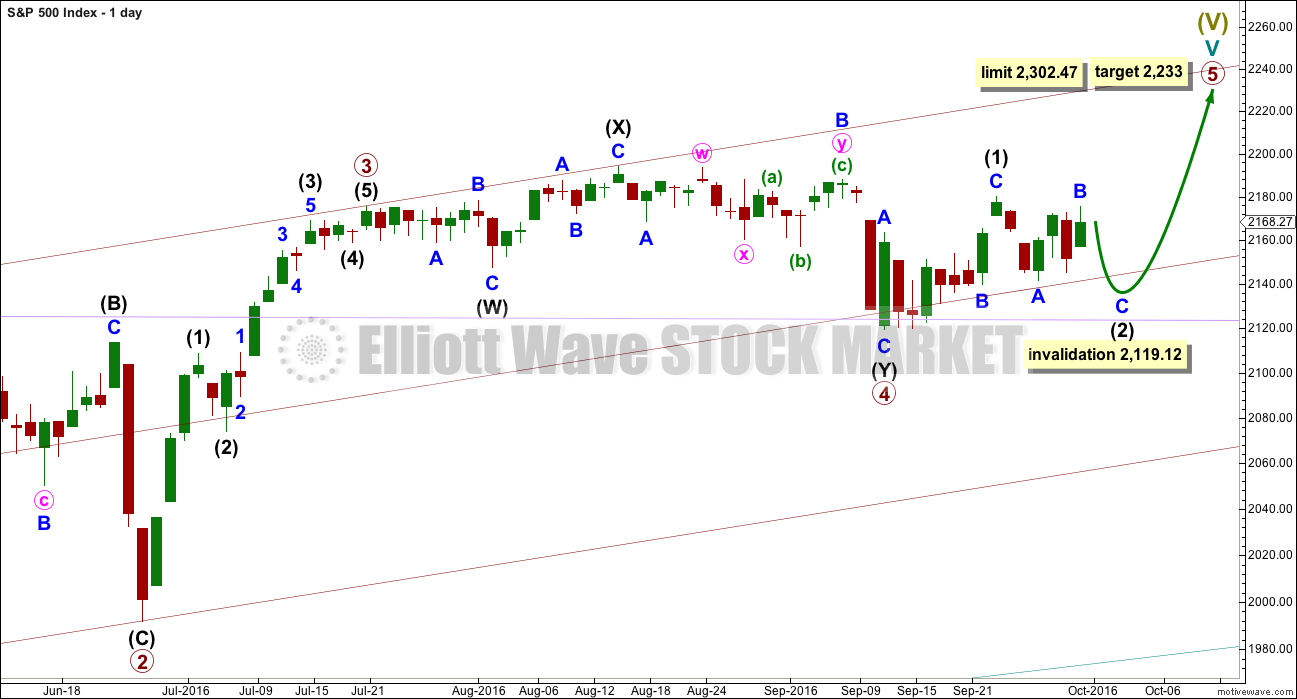
Primary wave 4 may be now complete as a double combination.
It is possible now that primary wave 4 could continue further as a triple, but because triples are very rare the probability of this is very low. If it is over here, then the proportion with primary wave 2 looks right. Within primary wave 5, no second wave correction may move beyond the start of its first wave below 2,119.12.
Primary wave 1 lasted 47 days, primary wave 2 was even in duration at 47 days, primary wave 3 lasted 16 days, and primary wave 4 has lasted 37 days. The proportions between these waves are acceptable.
If primary wave 5 has begun here, then at 2,233 it would reach 0.618 the length of primary wave 1.
At this stage, an impulse for primary wave 5 looks unlikely with invalidation of that idea at the hourly chart level. An ending diagonal now looks more likely for primary wave 5. Ending diagonals are choppy overlapping structures. The classic technical analysis equivalent is a rising wedge. They are terminal structures, doomed to full retracement at their end.
If primary wave 5 comes up to touch the upper edge of the maroon channel, it may end there.
HOURLY CHART
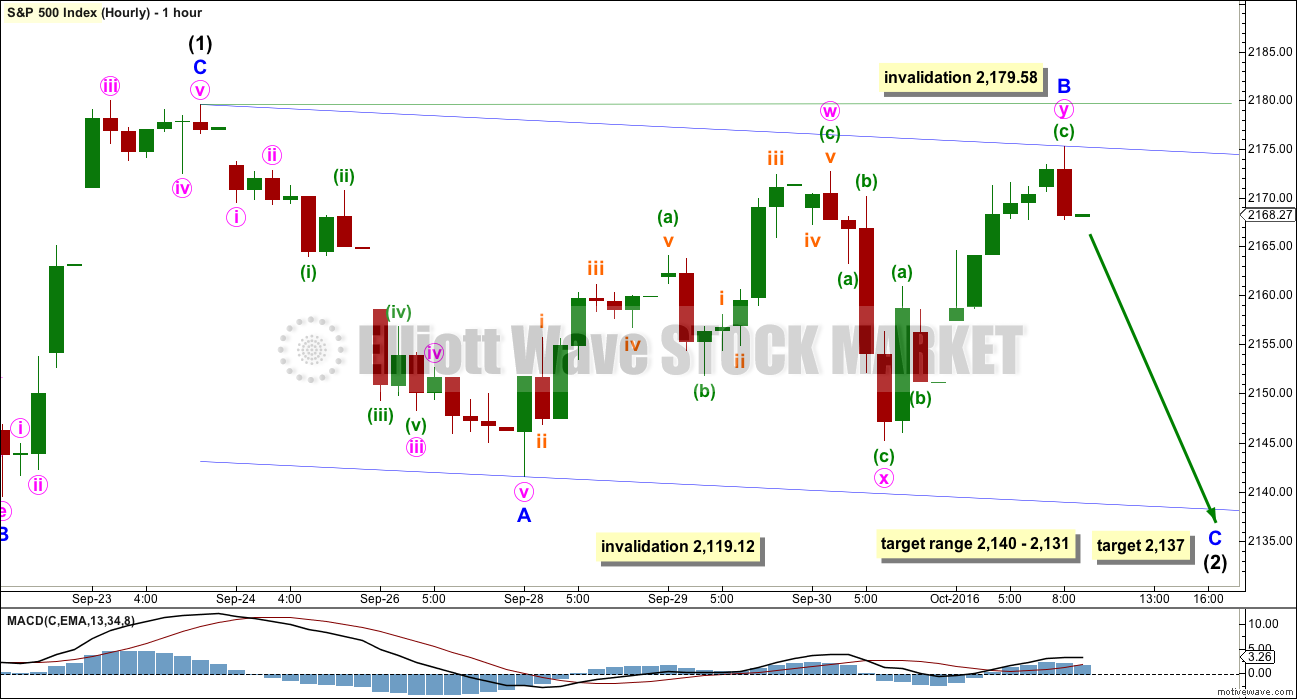
If primary wave 5 is subdividing as an ending diagonal, then all sub-waves must subdivide as zigzags. Intermediate wave (1) may be a completed zigzag.
Second and fourth waves within diagonals have a normal depth of from 0.66 to 0.81 the prior wave. This gives a target range for intermediate wave (2) from 2,140 to 2,131.
Intermediate wave (2) must subdivide as a zigzag. It may not move beyond the start of intermediate wave (1) below 2,119.12.
Intermediate wave (1) lasted a Fibonacci eight days.
If intermediate wave (2) ends in two more days, it too would last a Fibonacci eight days. At 2,137 minor wave C would reach equality in length with minor wave A. Price may find support about the lower edge of the blue channel drawn here about the zigzag of intermediate wave (2).
Minor wave B moved a little higher to complete as a double zigzag during Friday’s session. If it moves any higher when Monday’s session begins, then it may not move beyond the start of minor wave A above 2,179.58.
ALTERNATE WAVE COUNT
WEEKLY CHART
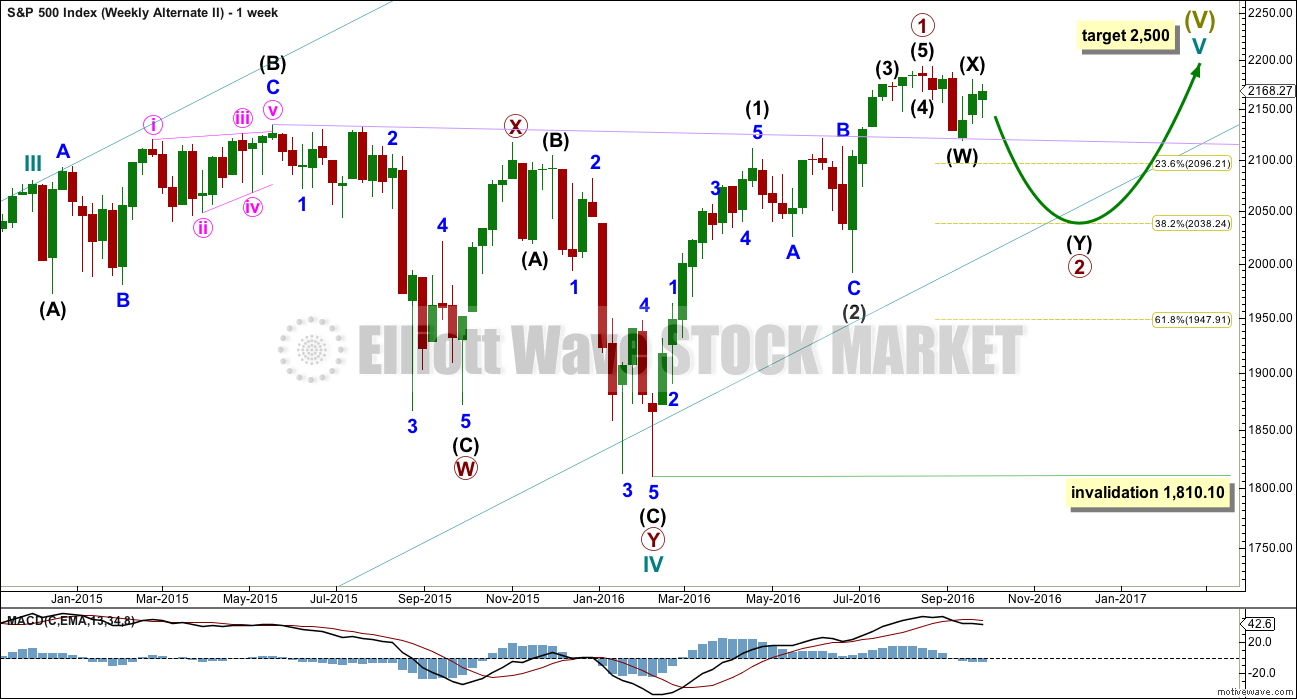
What if an impulse upwards is complete? The implications are important. If this is possible, then primary wave 1 within cycle wave V may be complete.
With downwards movement from the high of primary wave 1 now clearly a three and not a five, the possibility that cycle wave V and Super Cycle wave (V) are over has substantially reduced. This possibility would be eliminated if price can make a new all time high above 2,193.81.
If an impulse upwards is complete, then a second wave correction may be unfolding for primary wave 2. Expectations on how deep primary wave 2 is likely to be are now adjusted. It may be expected now to more likely only reach the 0.382 Fibonacci ratio about 2,038.
At this stage, it looks like price has found strong support at the lilac trend line.
Primary wave 2 may not move beyond the start of primary wave 1 below 1,810.10.
DAILY CHART
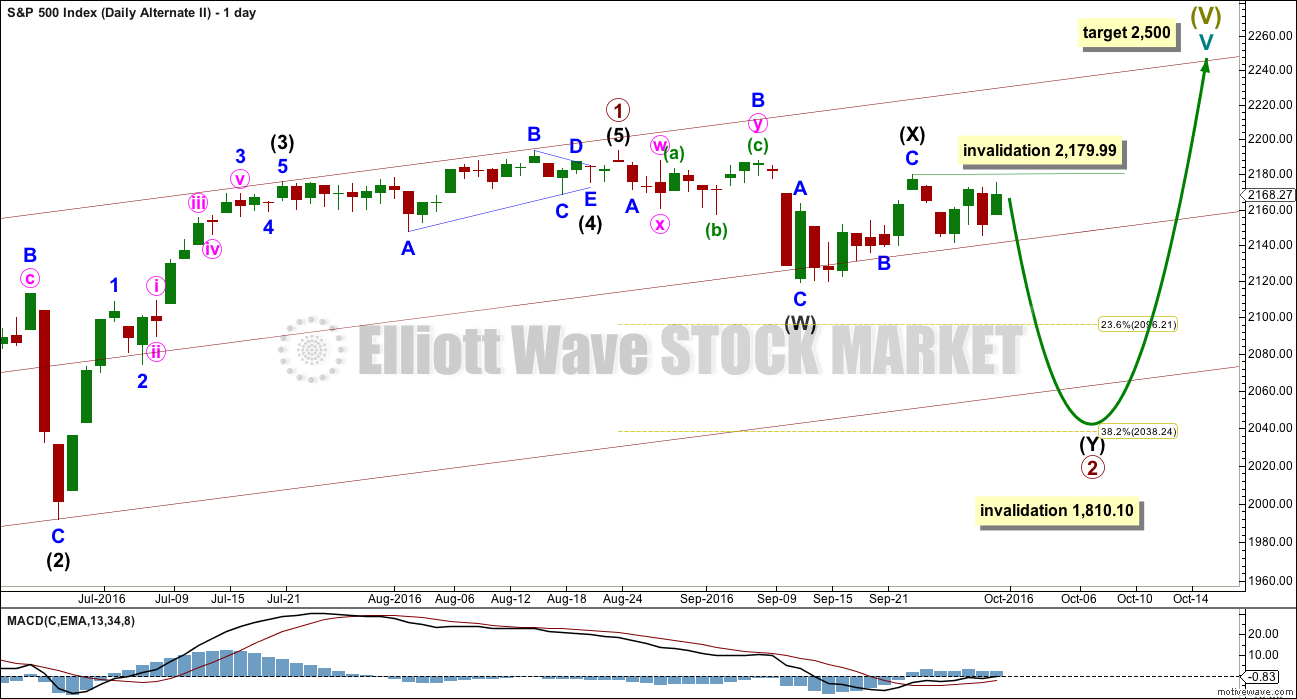
If an impulse upwards is complete, then how may it subdivide and are proportions good?
Intermediate wave (1) was an impulse lasting 47 days. Intermediate wave (2) was an expanded flat lasting 47 days. Intermediate wave (3) fits as an impulse lasting 16 days, and it is 2.04 points short of 0.618 the length of intermediate wave (1). So far this alternate wave count is identical to the main wave count (with the exception of the degree of labelling, but here it may also be moved up one degree).
Intermediate wave (4) may have been a running contracting triangle lasting 22 days and very shallow at only 0.0027 the depth of intermediate wave (3). At its end it effected only a 0.5 point retracement. There is perfect alternation between the deeper expanded flat of intermediate wave (2) and the very shallow triangle of intermediate wave (4). All subdivisions fit and the proportion is good.
Intermediate wave (5) would be very brief at only 18.29 points. Intermediate wave (5) is 1.43 points longer than 0.056 the length of intermediate wave (1).
At this stage, primary wave 2 now has a completed zigzag downwards that did not reach the 0.236 Fibonacci ratio. It is very unlikely for this wave count that primary wave 2 is over there; the correction is too brief and shallow. Upwards movement labelled intermediate wave (X) is so far less than 0.9 the length of the prior wave down labelled intermediate wave (W). The minimum for a flat correction has not been met. Primary wave 2 may continue lower as a double zigzag. A second zigzag in the double may be required to deepen the correction closer to the 0.382 Fibonacci ratio.
Intermediate wave (W) lasted a Fibonacci 13 sessions. Intermediate wave (X) has now lasted a Fibonacci eight sessions. If intermediate wave (Y) is equal in duration with intermediate wave (W), that would give the wave count a satisfying look.
Primary wave 2 may not move beyond the start of primary wave 1 below 1,810.10. A new low below this point would see the degree of labelling within cycle wave V moved up one degree. At that stage, a trend change at Super Cycle degree would be expected and a new bear market to span several years would be confirmed.
I will not publish an hourly chart for this alternate at the end of this week. The double zigzag of primary wave 2 is not looking right, so I do not have reasonable confidence in this wave count. Publication of an hourly chart for it would give it too much weight.
TECHNICAL ANALYSIS
WEEKLY CHART
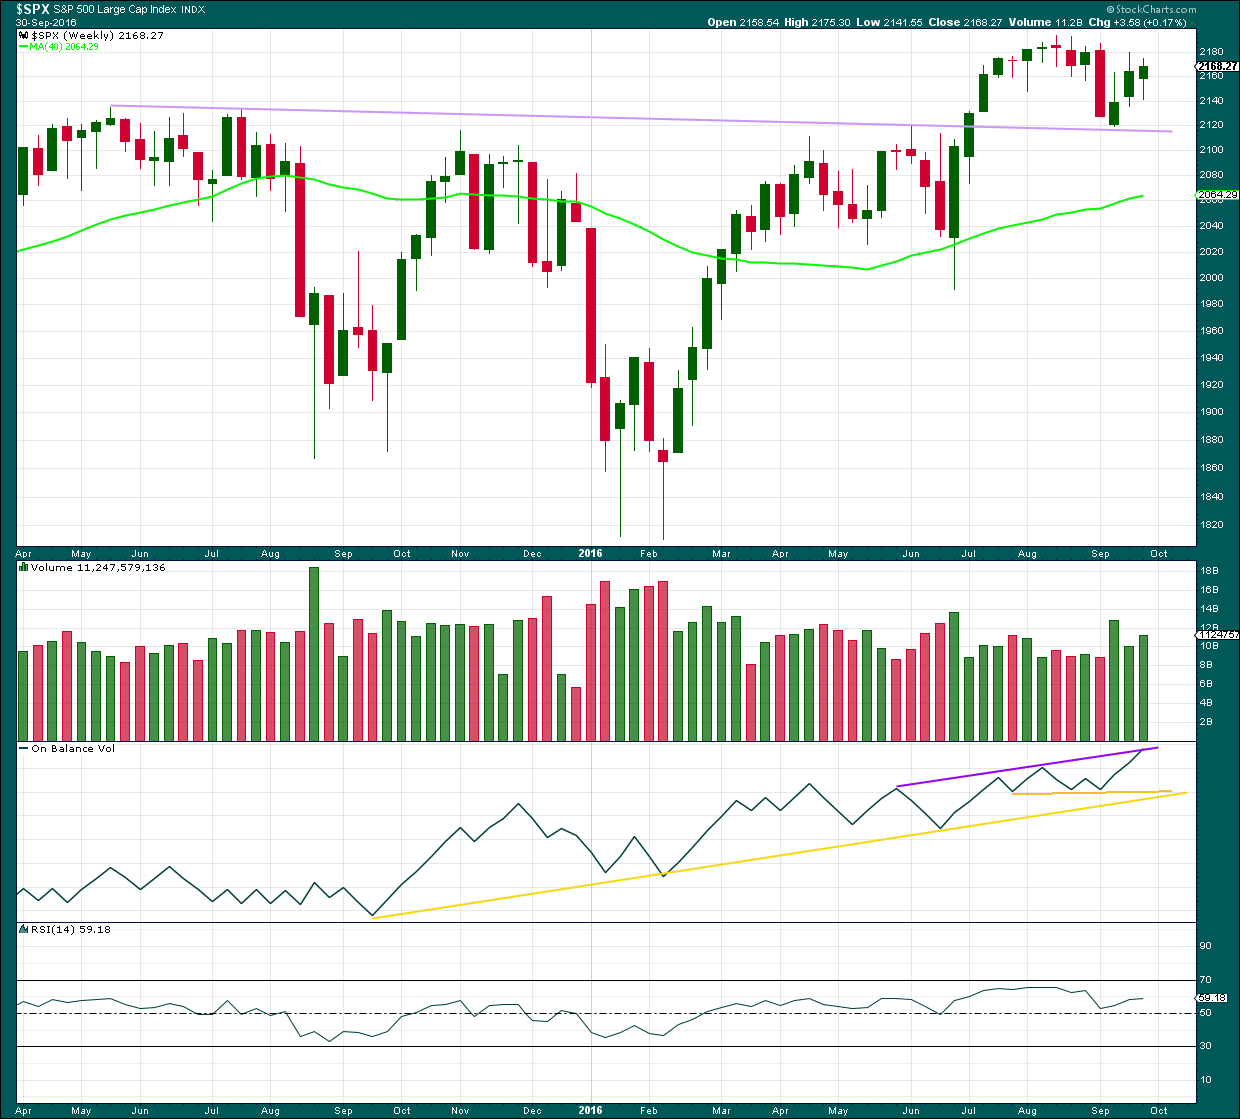
Click chart to enlarge. Chart courtesy of StockCharts.com.
The lilac trend line has strong technical significance. Price has broken through resistance, turned down to test support, and is now moving up and away from this line. It is reasonable to conclude that a new all time high is a likely consequence of this typical behaviour.
This week closes green and has some support from volume. A further rise in price overall would be expected to follow.
On Balance Volume has this week come up to touch the purple trend line. It may find some resistance there. A break above this line would be a weak bullish signal. There is divergence with the high this week and the prior high seven weeks ago: OBV has made a higher high but price has made a lower high. This divergence is bearish and indicates weakness in price. This old bull market continues to show internal weakness.
RSI is not extreme and exhibits no divergence at the weekly chart level to indicate weakness in price. There is room for price to rise further.
DAILY CHART
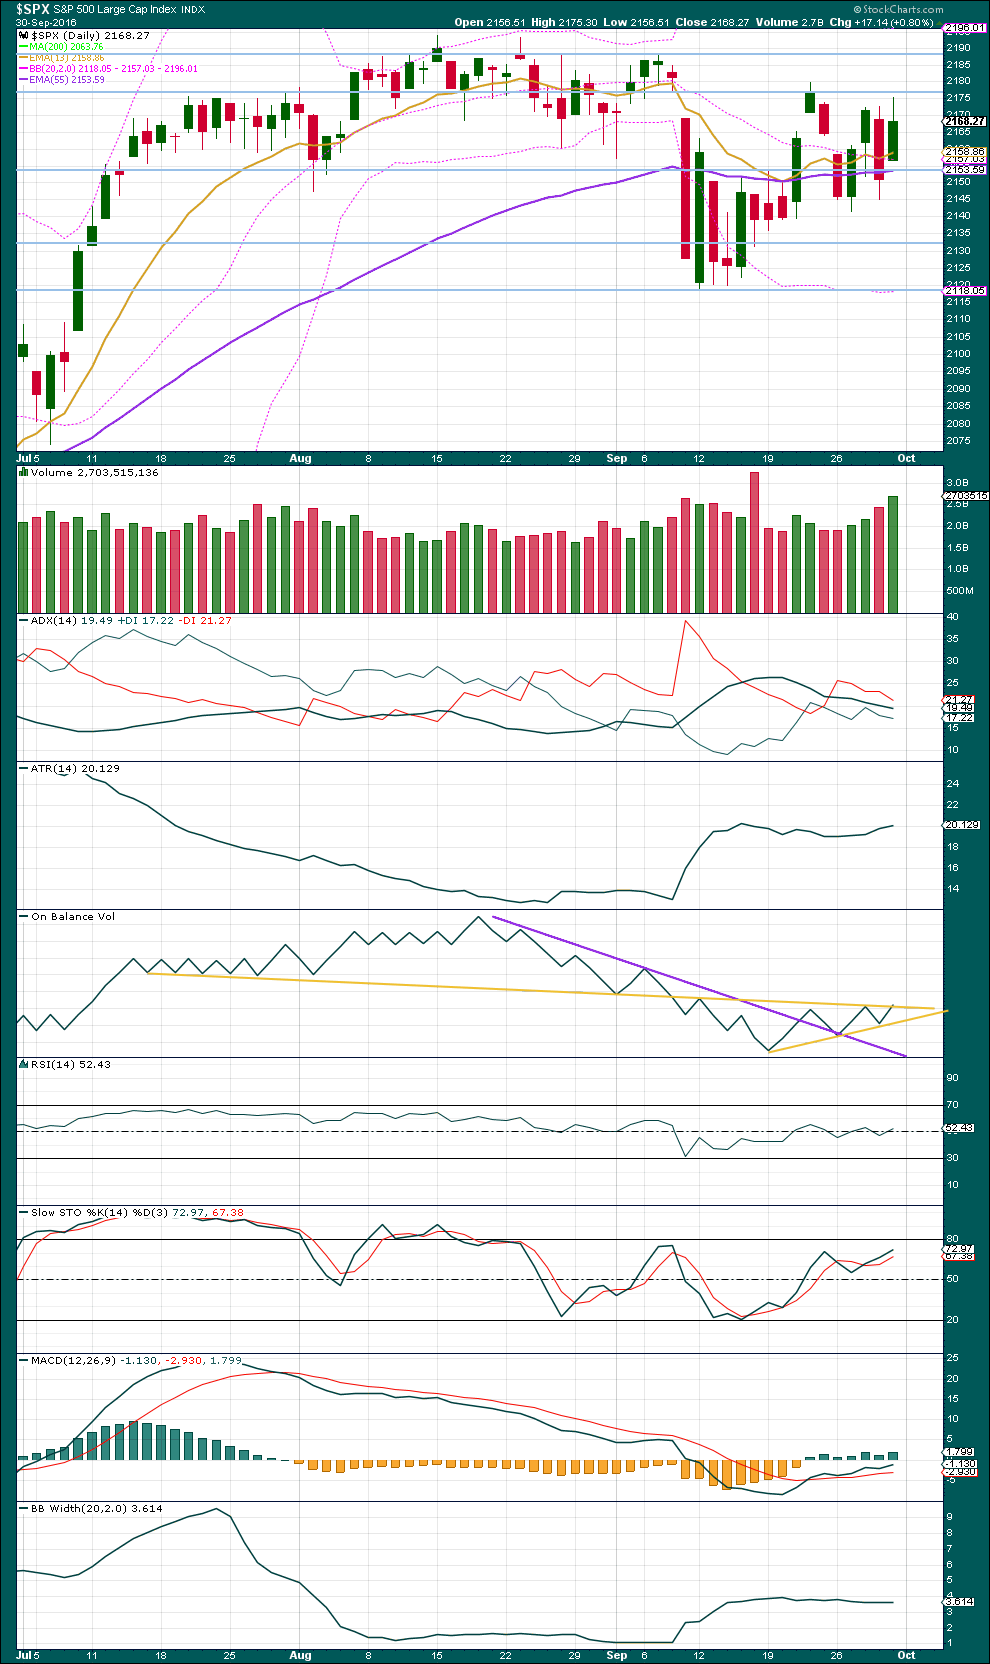
Click chart to enlarge. Chart courtesy of StockCharts.com.
A green daily candlestick with a higher low and higher high shows support from volume. Overall, price has been moving upwards for four days now on increasing volume. More upwards movement would be a reasonable expectation following this behaviour.
Price may find some resistance here about 2,175.
ADX is declining, indicating the market is not trending. ATR is overall flat, in agreement with ADX. Bollinger Bands are now very slightly contracting. This market is not trending. This market is consolidating.
Within this long consolidation, which began back on about 11th of July, it is three downwards days that have strongest volume. This suggests a downwards breakout is more likely than upwards. This trick may or may not work for the S&P at this time. It is one piece of evidence to weigh up. This consolidation is bounded by resistance at 2,190 and support at 2,120.
On Balance Volume has moved up from the lower yellow line and is now sitting on the upper yellow line. There is some leeway in exactly how the upper yellow line may be drawn, so for a bullish signal OBV needs to break clearly above this line. This line may provide some resistance and halt the rise in price here.
RSI is still close to neutral. There is plenty of room for price to rise or fall.
Stochastics has not yet reached overbought. Overall, a continuation of an upwards swing within this consolidation may be expected until price finds resistance and Stochastics reaches overbought at the same time. There is weak bearish divergence today between price and Stochastics, but this signal is so unreliable it is noted but should be given no weight.
There are three moving averages on this chart: a short term Fibonacci 13 days (gold), a mid term Fibonacci 55 days (purple), and a long term 200 days (lime). Both the mid and long term averages are still pointing up, and the mid term average is above the long term average. The longer term trend should be assumed to be up, until these averages prove it is not. The short term average has come down to kiss the mid term average and today it remains above the mid term average. The short term trend is fluctuating, exactly as expected within a consolidating market.
VOLATILITY – INVERTED VIX CHART
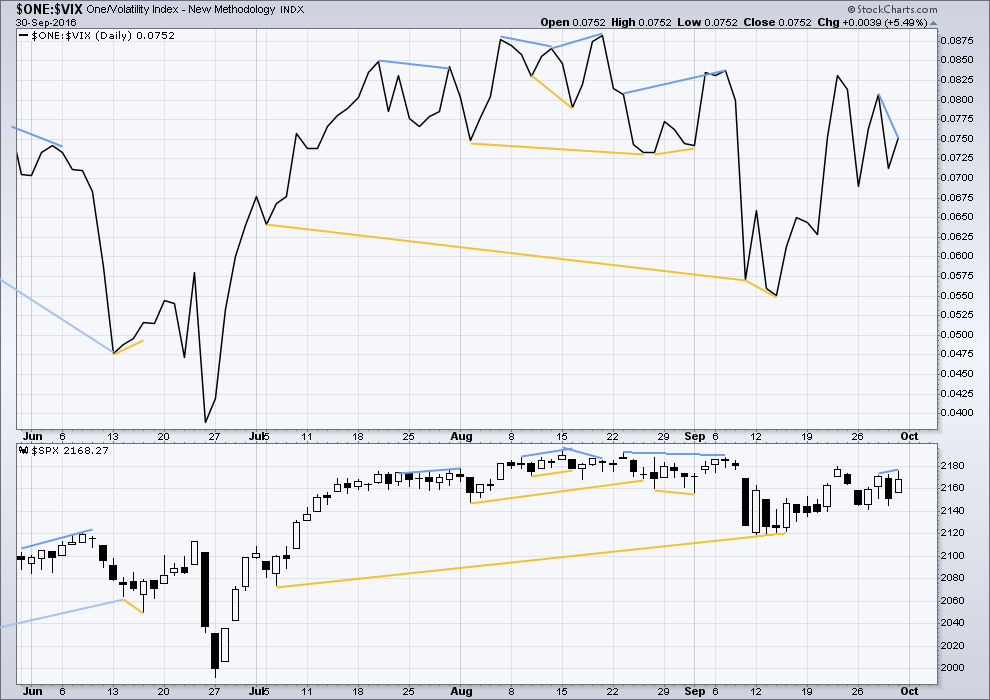
Click chart to enlarge. Chart courtesy of StockCharts.com.
There are a few instances of multi day divergence between price and inverted VIX noted here. Bearish divergence is blue. Bullish divergence is yellow. It appears so far that divergence between inverted VIX and price is again working to indicate short term movements spanning one or two days.
There is short term bearish divergence today between price and VIX: Friday’s session made a new high for price above the high two days prior, but inverted VIX has failed to make a corresponding new high. This indicates weakness in price. It is likely to be followed by one or two days of overall downwards movement, and this fits neatly with the Elliott wave count.
BREADTH – AD LINE
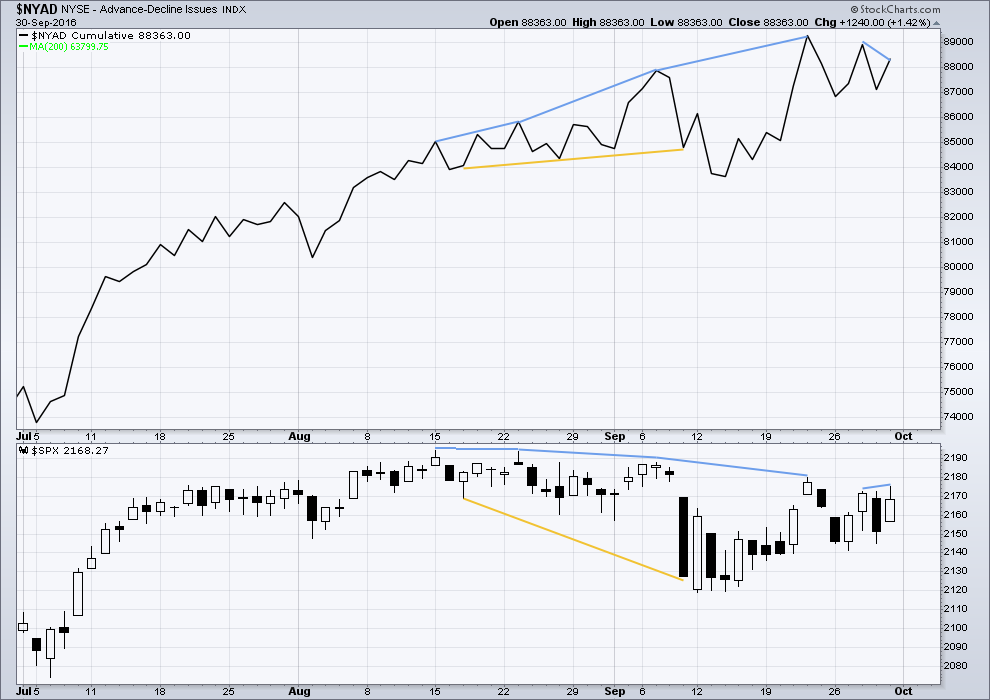
Click chart to enlarge. Chart courtesy of StockCharts.com.
There is support from market breadth as price is rising.
Short term bullish and bearish divergence is again working between price and the AD line to show the direction for the following one or two days.
There is short term bearish divergence today between price and the AD line: Friday’s session made a new high for price above the high two days prior, but the AD line failed to make a corresponding new high. This indicates weakness in price. It is likely to be followed by one or two days of overall downwards movement, and this fits neatly with the Elliott wave count.
DOW THEORY
Major lows within the old bull market:
DJIA: 15,855.12 (15th October, 2014) – closed below on 25th August, 2015.
DJT: 7,700.49 (12th October, 2014) – closed below on 24th August, 2015.
S&P500: 1,821.61 (15th October, 2014) – has not closed below this point yet.
Nasdaq: 4,117.84 (15th October, 2014) – has not closed below this point yet.
Major highs within the bear market from November 2014:
DJIA: 17,977.85 (4th November, 2015) – closed above on 18th April, 2016.
DJT: 8,358.20 (20th November, 2015) – has not closed above this point yet.
S&P500: 2,116.48 (3rd November, 2015) – closed above this point on 8th June, 2016.
Nasdaq: 5,176.77 (2nd December, 2015) – closed above this point on 1st August, 2016.
Dow Theory Conclusion: Original Dow Theory still sees price in a bear market because the transportations have failed to confirm an end to that bear market. Modified Dow Theory (adding S&P and Nasdaq) has failed still to confirm an end to the old bull market, modified Dow Theory sees price still in a bull market.
This analysis is published @ 08:56 p.m. EST on 1st October, 2016.
[Note: Analysis is public today for promotional purposes. Member comments and discussion will remain private.]


There are reports that some DB customers are being denied access to their cash because of “IT glitches”, the second instance in the last 72 hours.
It is entirely possible that my theory about folk biting on bail-out bait may have been far too ebullient…
The next shoe to drop in the developing global financial melt-down will be when they attempt to cobble together a bail-out for DB. You heard me.
Despite Merkel’s bluster, bail-out they will, or at least attempt it.
DB represents counter-party risk to every single financial institution on the planet- every single one! Furthermore, there are implications, hidden though they may be, for mutual funds, pension funds, insurance companies, and even money market funds. After all, in a ZIRP and NIRP universe, what are these companies to do to achieve the ROI needed to satisfy their commitments to their clients? Assume more risk…of course! And risk DB has got. I thought they were leveraged 30 to one. I am now told the correct figure is 40:1
Here’s the problem: Despite any attempt at a bailout being destined to fail and fail miserably, its mere announcement will result in cheering from the rafters, and a corresponding spike in DB’s price, and pronouncement from the bankster cartel that all is well. The smart money will then use this opportunity to bolt for the exits- en masse…and then all hell breaks loose! Watch for it.