Downwards movement was not expected and invalidated the hourly Elliott wave counts.
Summary: The trend is still down, but a bear market rally continues and is not done yet. It may end tomorrow. A new high above 2,116 is expected. The new target for this upwards movement to end is 2,124. Thereafter, the downwards trend should resume in force. This bear market rally is extremely unlikely to make a new all time high. It is expected to stop before 2,134.72.
To see how each of the bull and bear wave counts fit within a larger time frame see the Grand Supercycle Analysis.
To see last analysis of weekly and monthly charts click here.
If I was asked to pick a winner (which I am reluctant to do) I would say the bear wave count has a higher probability. It is better supported by regular technical analysis at the monthly chart level, it fits the Grand Supercycle analysis better, and it has overall the “right look”.
New updates to this analysis are in bold.
BULL ELLIOTT WAVE COUNT
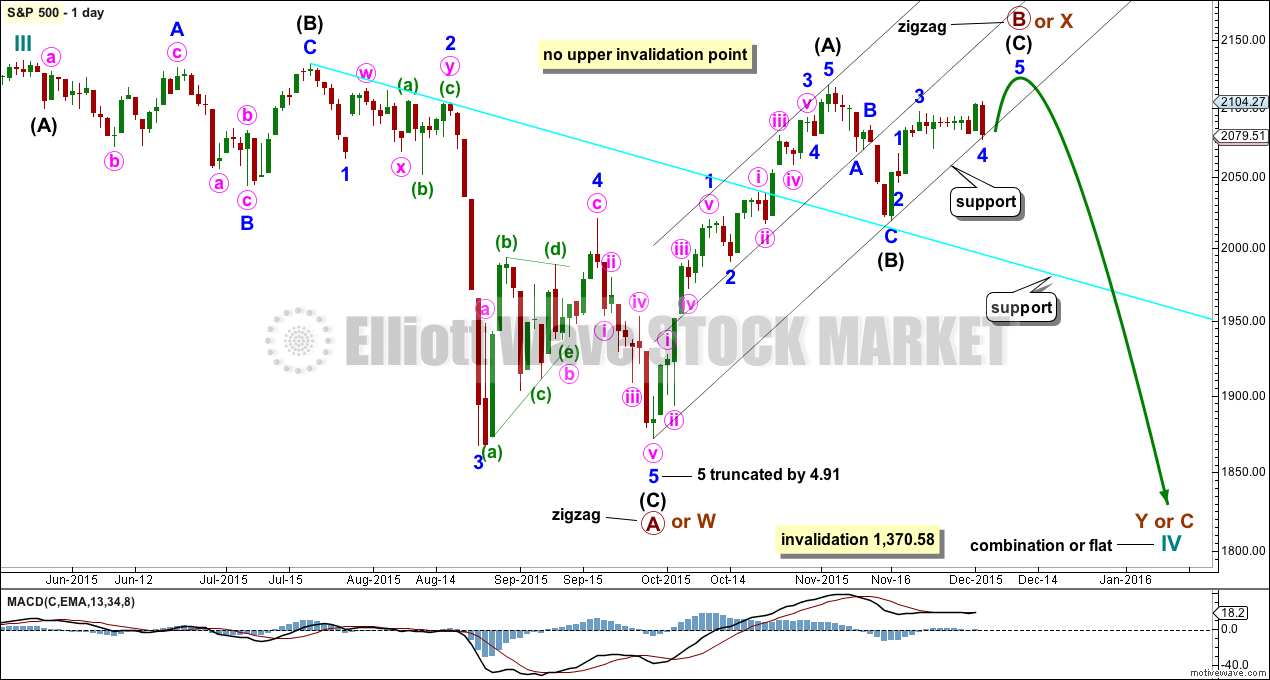
DAILY CHART – COMBINATION OR FLAT
Cycle wave IV should exhibit alternation to cycle wave II.
Cycle wave II was a shallow 0.41 zigzag lasting three months. Cycle wave IV should exhibit alternation in structure and maybe also alternation in depth. Cycle wave IV may end when price comes to touch the lower edge of the teal channel which is drawn about super cycle wave V using Elliott’s technique (see this channel on weekly and monthly charts).
Cycle wave IV may end within the price range of the fourth wave of one lesser degree. Because of the good Fibonacci ratio for primary wave 3 and the perfect subdivisions within it, I am confident that primary wave 4 has its range from 1,730 to 1,647.
If a zigzag is complete at the last major low as labelled, then cycle wave IV may be unfolding as a flat, combination or triangle.
Primary wave B or X is an incomplete zigzag unfolding upwards. If cycle wave IV is an expanded flat correction, then primary wave B may make a new high above the start of primary wave A at 2,134.72. If cycle wave IV is a combination, then primary wave X may make a new high above the start of primary wave W. There is no upper invalidation point for these reasons.
Primary wave A or W lasted three months. When it arrives primary wave Y or C may be expected to also last about three months.
Intermediate waves (A) and (B) together lasted a Fibonacci 34 days within primary wave B or X. So far intermediate wave (C) has lasted thirteen days. If it ends tomorrow, it may be considered to be close enough to a Fibonacci thirteen.
The S&P is not very reliable in terms of Fibonacci numbers for the duration of its waves. The expectation for this movement to end tomorrow is a rough guide and may not be met. The high should still be a matter of only a few days away though.
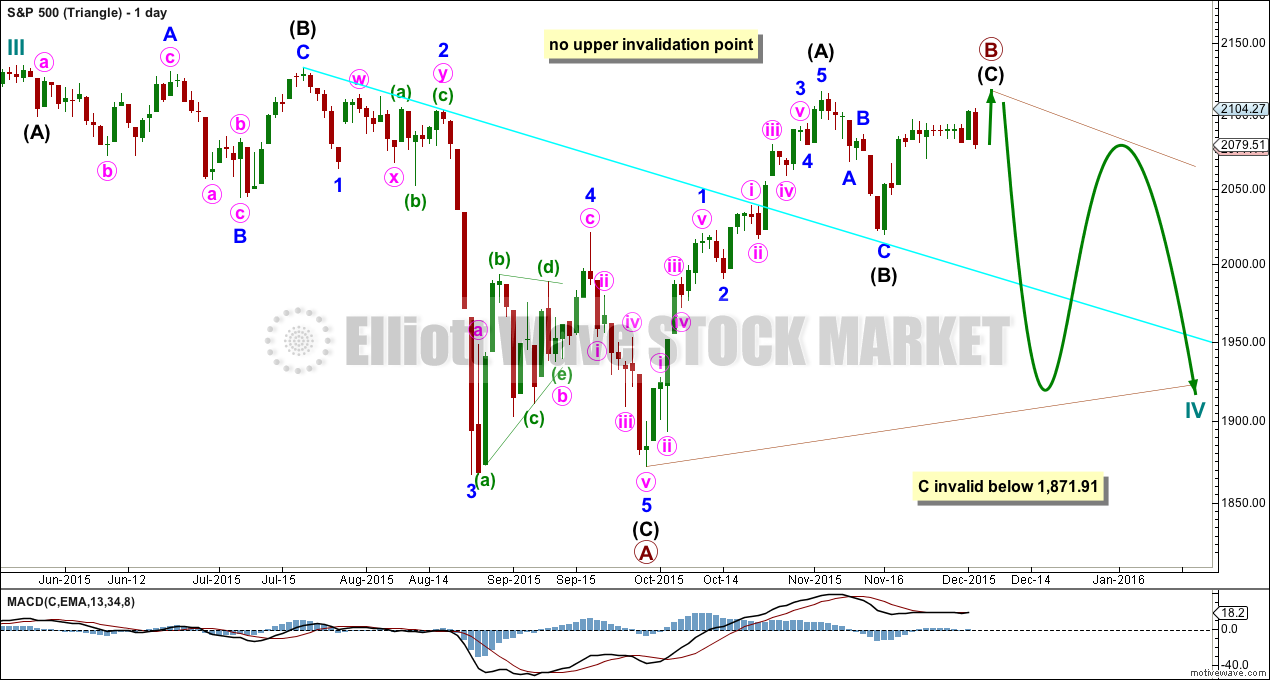
DAILY CHART – TRIANGLE
Cycle wave IV may unfold as a shallow triangle. This would provide alternation with the 0.41 zigzag of cycle wave II.
Primary wave B may be unfolding as a zigzag. Primary wave B may make a new high above the start of primary wave A at 2,134.72 as in a running triangle. There is no upper invalidation point for this wave count for that reason.
The whole structure moves sideways in an ever decreasing range. The purpose of triangles is to take up time and move price sideways. A possible time expectation for this idea may be a total Fibonacci eight or thirteen months, with thirteen more likely. So far cycle wave IV has lasted six months.
HOURLY CHART
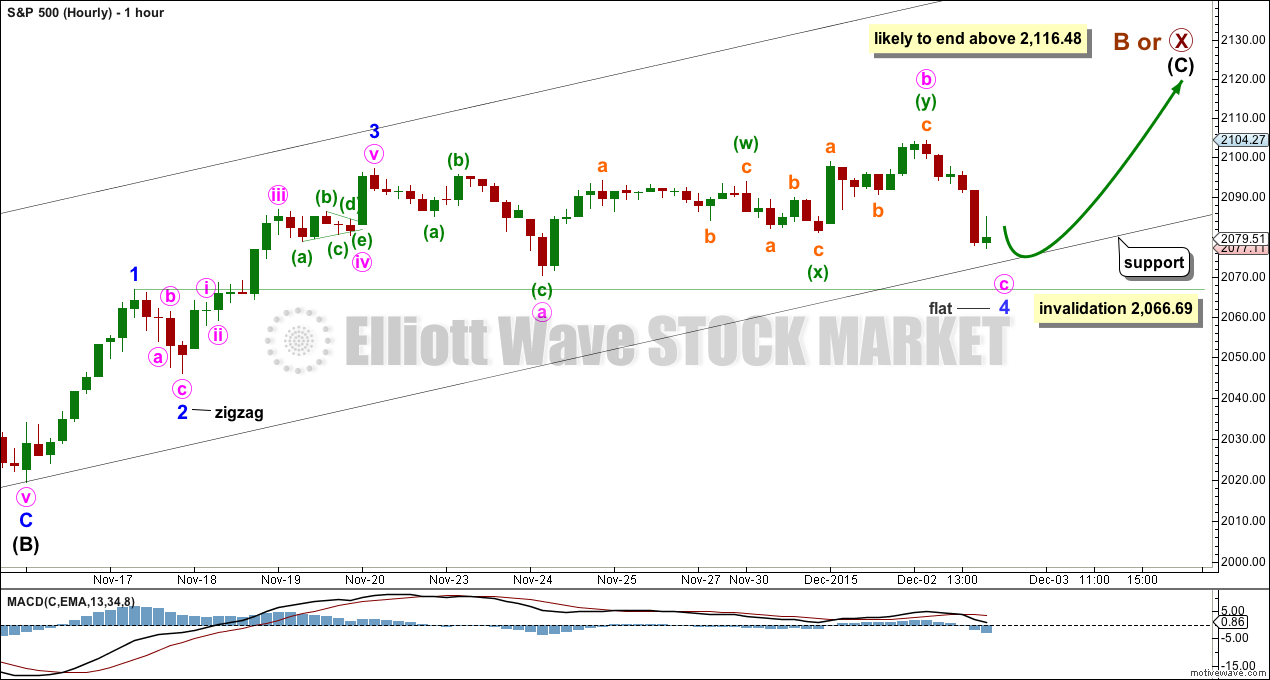
With downwards movement today moving below the invalidation points on yesterday’s hourly wave counts, I have tried to see if this could be part of minor wave 5 still, but it will not fit.
This downwards movement must be part of minor wave 4 which means it must be over at Wednesday’s low or very close indeed. It should find support at the lower edge of the black channel copied over from the daily chart (they sit in slightly different places because the daily chart is on a semi-log scale and the hourly chart is on an arithmetic scale).
The two hourly wave counts will look at minor wave 4 as one of two possible structures: either a flat or combination. This first chart looks at a less likely flat, the second chart a combination.
If minor wave 4 is a flat correction, then within it minute wave c would be extremely likely to end beyond the end of minute wave a to avoid a truncation and a very rare running flat. This means it should move slightly lower tomorrow to end at or below 2,070.29 but not below 2,066.69. This seems unlikely, which gives this first wave count a lower probability.
When minor wave 4 is complete, then intermediate wave (C) is still likely to end at least slightly above the end of intermediate wave (A) at 2,116.48 to avoid a truncation.
Minor wave 5 is most likely to be 47.30 points in length to reach equality in length with minor wave 1.
Minor wave 4 may not move into minor wave 1 price territory below 2,066.69. If this wave count (and the second hourly as well) are invalidated by downwards movement, then my analysis of intermediate waves (B) and (C) is wrong; this may have been a first and second wave correction within the start of the next wave down. A third wave down should then be expected to be underway.
ALTERNATE BULL ELLIOTT WAVE COUNT
DAILY CHART
It is possible to see cycle wave IV a completed flat correction. This would provide some structural alternation with the zigzag of cycle wave II.
This is a regular flat but does not have a normal regular flat look. Primary wave C is too long in relation to primary wave A. Primary wave C would be 3.84 short of 4.236 the length of primary wave A. While it is possible to also see cycle wave IV as a complete zigzag (the subdivisions for that idea would be labelled the same as the bear wave count below, daily chart) that would not provide structural alternation with the zigzag of cycle wave II, and so I am not considering it.
This idea requires not only a new high but that the new high must come with a clear five upwards, not a three.
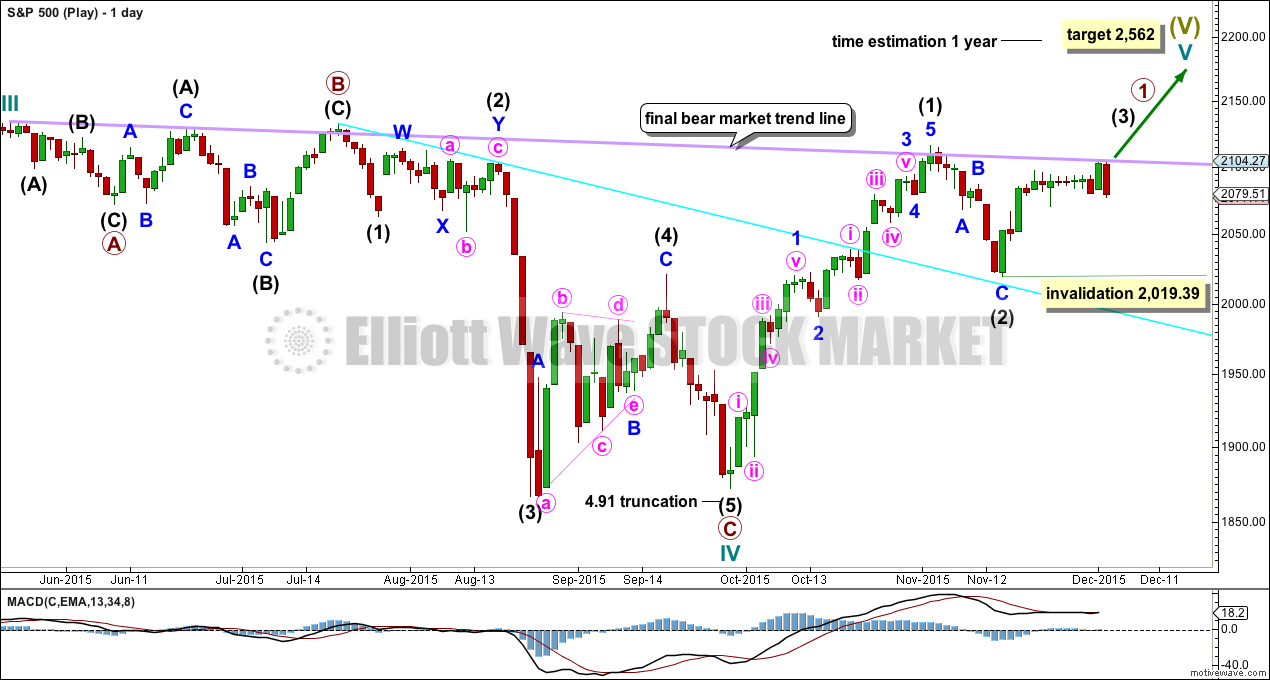
At 2,562 cycle wave V would reach equality in length with cycle wave I. Cycle wave I was just over one year in duration so cycle wave V should be expected to also reach equality in duration. Cycle degree waves should be expected to last about one to several years, so this expectation is reasonable. It would be extremely unlikely for this idea that cycle wave V was close to completion, because it has not lasted nearly long enough for a cycle degree wave.
I added a bear market trend line drawn using the approach outlined by Magee in “Technical Analysis of Stock Trends”. When this lilac line is clearly breached by upwards movement that shall confirm a trend change from bear to bull. The breach must be by a close of 3% or more of market value. If it comes with a clear five up, then this wave count would be further confirmed.
While price remains below the bear market trend line, we should assume the trend remains the same: downwards.
Intermediate wave (1) is a complete five wave impulse and intermediate wave (2) is a complete three wave zigzag. Subdivisions at the hourly chart level would be the same for this wave count as for the other two wave counts; A-B-C of a zigzag subdivides 5-3-5, exactly the same as 1-2-3 of an impulse.
For this wave count, when the next five up is complete that would be intermediate wave (3). Within intermediate wave (3), no second wave correction may move beyond the start of its first wave below 2,019.39.
This wave count does not have support from regular technical analysis and it has a big problem of structure for Elliott wave analysis. I do not have confidence in this wave count. It is presented as a “what if?” to consider all possibilities.
BEAR ELLIOTT WAVE COUNT
DAILY CHART
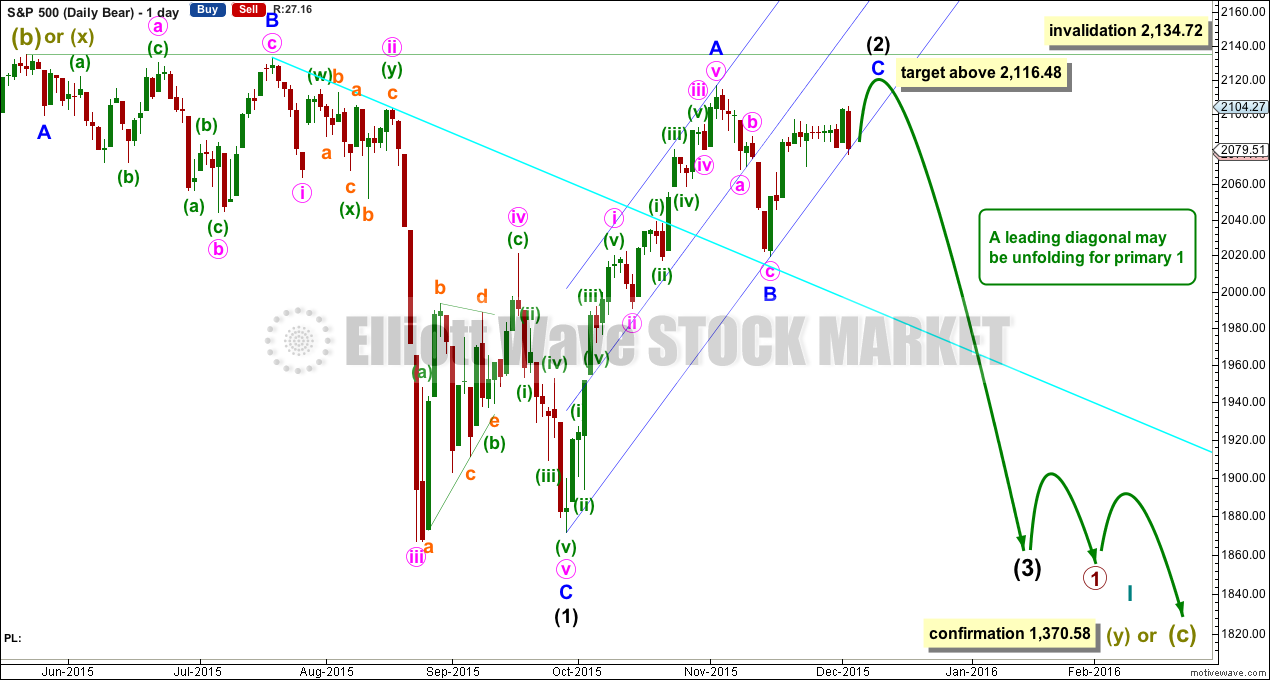
This bear wave count has a better fit at Grand Super Cycle degree and is better supported by regular technical analysis at the monthly chart level. But it is a huge call to make, so I present it second, after a more bullish wave count, and until all other options have been eliminated.
There are two ideas presented in this chart: a huge flat correction or a double flat / double combination. The huge flat is more likely. They more commonly have deep B waves than combinations have deep X waves (in my experience).
A huge flat correction would be labelled super cycle (a)-(b)-(c). It now expects a huge super cycle wave (c) to move substantially below the end of (a) at 666.79. C waves can behave like third waves. This idea expects a devastating bear market, and a huge crash to be much bigger than the last two bear markets on the monthly bear chart.
The second idea is a combination which would be labelled super cycle (w)-(x)-(y). The second structure for super cycle wave (y) would be a huge sideways repeat of super cycle wave (a) for a double flat, or a quicker zigzag for a double combination. It is also possible (least likely) that price could drift sideways in big movements for over 10 years for a huge triangle for super cycle wave (y).
The bear wave count sees a leading diagonal for a primary degree first wave unfolding. Within leading diagonals, the first, third and fifth waves are most commonly zigzags but sometimes may appear to be impulses. Here intermediate wave (1) is seen as a complete zigzag.
Intermediate wave (2) is an incomplete zigzag within the leading diagonal. It may not move beyond the start of intermediate wave (1) above 2,134.72. This wave count expects minor wave C to end midway within its channel, above the end of minor wave A at 2,116.48 but not above 2,134.72.
HOURLY CHART
Of the two ideas presented today at the hourly chart level, I judge this second idea to have a higher probability.
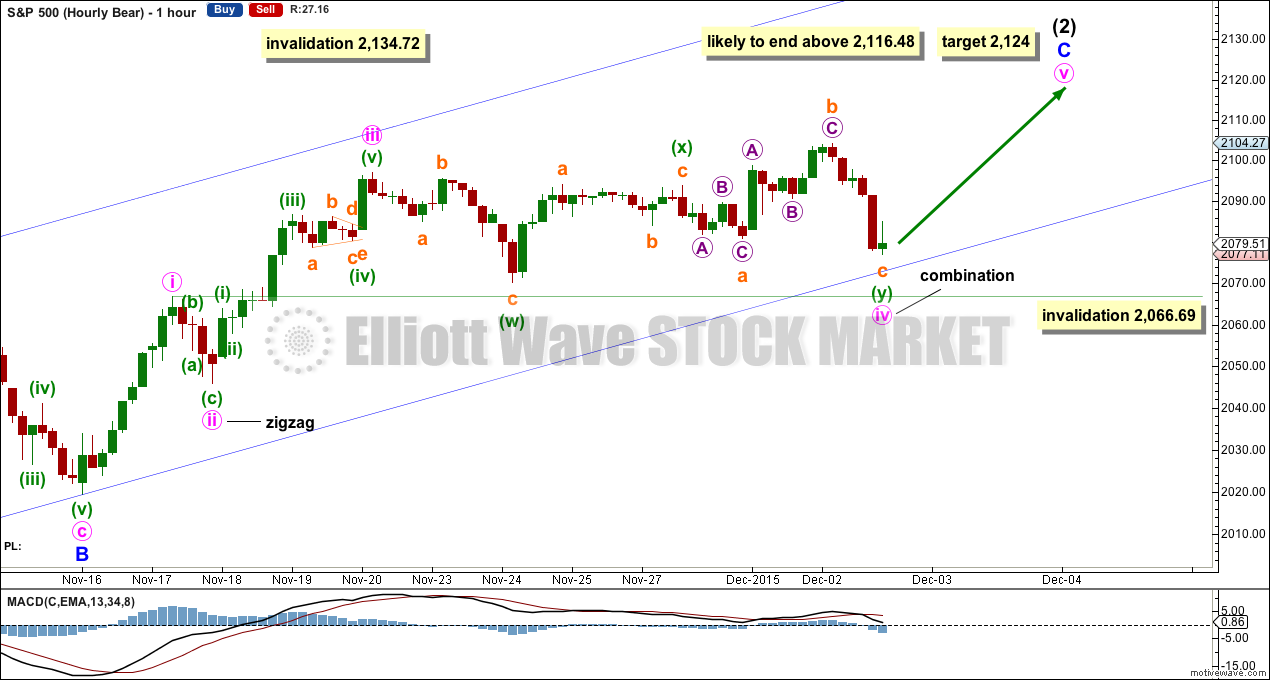
Minute wave iv may now be a complete (and very time consuming) double combination: zigzag – X – expanded flat.
The second structure in the double may end here finding support at the lower edge of the channel copied over from the daily chart.
At 2,124 minute wave v would reach equality in length with minute wave i. If minute wave iv moves lower, then this target must also move correspondingly lower.
Minute wave iv may not move into minute wave i price territory below 2,066.69.
If this invalidation point is breached, then the bear market rally is very likely to be over and a third wave down should be expected to be underway.
A note about the expectation for a new high above 2,116.48 to end this rally. It is very likely but not necessary. If this very bearish wave count is correct, then the next wave down may be a very strong third wave. It may have the force to pull minor wave C down and force a truncation. The next wave down for this bear wave count is expected to be stronger than the downwards wave labelled minute wave iii within intermediate wave (1) on the daily chart. Nearing the end expect surprises to be to the downside.
TECHNICAL ANALYSIS
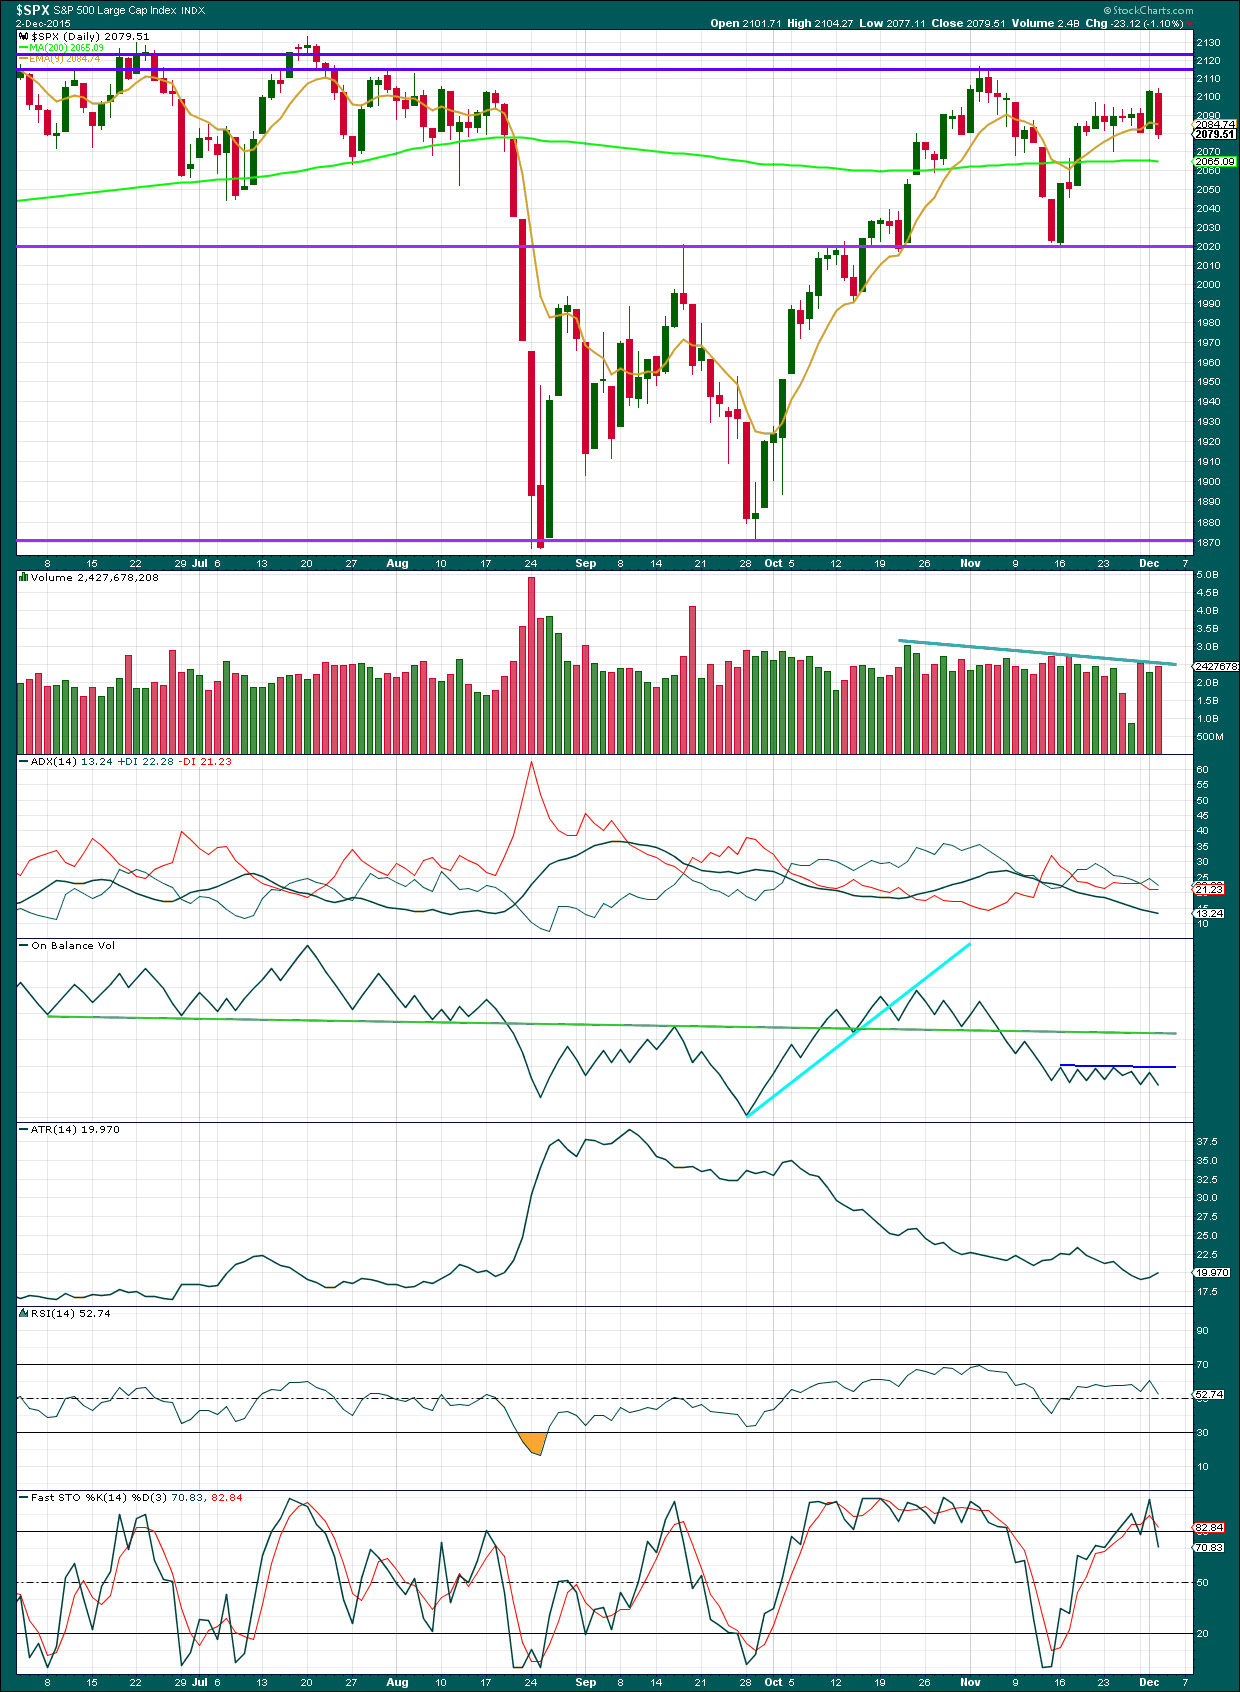
Click chart to enlarge. Chart courtesy of StockCharts.com.
Daily: Slightly higher volume than the prior upwards day supports this fall in price. However, overall volume is still light and declining. This looks more like a correction, which supports the Elliott wave count, than a trend.
Today’s candlestick completes a nice bearish engulfing pattern. This is the strongest of all reversal patterns, and this is a big reason why I am warning that for the Elliott wave counts a new low now below 2,066.69 indicates the bear market rally is over.
Today there is still some divergence with the high yesterday and On Balance Volume. OBV has not managed to make a new high above the prior high of 20th November while price did make a new high. This indicates weakness in upwards movement of price. I have added a new short trend line to OBV. This is very shallow (almost horizontal) and repeatedly tested but not long held. It is reasonably technically significant. This short dark blue line may assist to show when upwards movement for price comes to an end. If OBV again touches that trend line, that may be when price ends the bear market rally.
ADX still indicates the market is not trending but consolidating. A range bound trading approach would expect some more upwards movement from here to not end until price finds resistance at one of the two upper horizontal trend lines and Stochastics is overbought at the same time.
A note on Dow Theory: for the bear wave count I would wait for Dow Theory to confirm a huge market crash. So far the industrials and the transportation indices have made new major swing lows, but the S&P500 and Nasdaq have not.
S&P500: 1,820.66
Nasdaq: 4,116.60
DJT: 7,700.49 – this price point was breached.
DJIA: 15,855.12 – this price point was breached.
To the upside, for Dow Theory, I am watching each index carefully. If any make new all time highs, that will be noted. If they all make new all time highs, then a continuation of a bull market would be confirmed. So far none have made new all time highs.
This analysis is published about 12:06 a.m. EST on 3rd December, 2015.

hi
all
What a day..
2095 premarket high and low of 2042.
Still to early to call a BEAR MARKET is in progress imo.
I can count a nice 5 wave down. Corrective 2’s can be fast and furious up, and it looks like we are closing with an hourly hammer on the S&P 500.
For those not short, you may get your chance tomorrow.
Jobs report shenanigans?
GLTA
i agree…
options,
My only caveat is that I’m short…since 2090, so I have a lot of leeway.
I can’t see a real win tomorrow morning with the jobs report – if its too hot, then Fed will be perceived to have to raise rates (since they are all talking about jobs). So now we have a tight Fed with a lame ECB. If its too cold, then here we are in an uncertain situation where the Fed has said they are likely raising rates, but then in a poor economic environment??? Job indicators are severely lagging indicators compared to say, new orders.
You can’t get too cute – any spike higher is a gift to get out, or get short.
2066 is a decent target or near it. I just wanted a clear signal and today we sure got it. Even at the premarket and some parts of intraday it seemed bullish but then got crushed. So, as you probably know with put options a +10-20 point move against you and you can be down -30%.. Not a fun place…
I can’t quite see it….
I could certainly be wrong….
I can see 1-2-3 with 3 still to end and then 4-5 to come
ok, well my problem is we are extremely oversold on the hourly and the bollinger band is pinching with a hammer. So unless this is a false flag and bollinger band price only rejects at the top of the band and not the lower then we head lower…
Again only an intra bounce to 2064-2070 tomorrow or the day after won’t stop the bigger picture drop that is playing out…
Also, maybe I am to cautious of declines and i think its highly unlikely we keep pushing 1-2% every day or other day. That should put us at 1870 by FOMC or lower. I wonder if that is in the makings? Doesn’t that change the decline timeline? Early FEB 2016 now becomes late December 2016 or JAN 2016?
type- dec 2015 and early jan 2016 for the completion of this correction? See my point?
I was baiting you 😉
It will be interesting to see what targets you have on the downside for the completion of this wave. 3 yet to end and 4-5 to come could be another 50 points.
But Corey, I have to interject here.
We have already dropped hard and the market has voted I agree short term down. But let us not forget that I think it is still to EARLY to vote that the OFFICIAL MAJOR DECLINE has begun. The week isn’t over yet!
We have 2.5 months left for the target of the wave count at 1870 and lower so i am suspect unless that can be revised to late December 2015. The bulls didn’t just disappear did they?
No, of course not, they just get eaten by grizzlies…! 😀 😀
But seriously, I think the first bounce is going to come at Lara’s aquamarine support line…quite a ways down….
thanks
Verne
Something to look at VIX bollinger band rejection – i am sure that doesn’t mean anything?
Does technical analysis not work ?
Bollinger bands with VIX can be quite tricky during transitions from Bull to Bear trends. You would be amazed at how bullishness persists even after the market is well on its way into a reversal and ergo the explosive nature of the VIX as sentiment plays catchup to reality. Note how the bands expanded back in August as the VIX exploded past the upper bands. You are about to see a repeat performance of even greater intensity in all likelihood.
I agree. I think we need another low tomorrow to complete the first impulse wave. I think it is going a lot lower than people expect before the first temporary bounce. The initial decline should take us far enough below the 200 DMA so that a deep retracement brings us back to kiss the underside good-bye.
So 1850 now. Flash crash talk? This whole thing is NOT going down like this…To bearish to soon. VIX slammed stuck – maybe you right..
If it is NOT a third wave down, you could be right.
If it is indeed, you’re in for a fright! 🙂
Kindly buckle your seatbelt…just in case…
This is the daily chart so far. The hourly I’m still working on. The trick now is to try and figure out when and where the bounces will arrive….. which is really hard!
Surprises will be to the downside. This could fall fast.
But it could still have deep quick corrections along the way.
-2.5% down in 2 days. In my experience at least a 30-50% retrace and then move lower should be expected in the next few days…. But anything can happen!
verne,
Just wow – 2 days about -55 some points…
A bounce is due by the open tomorrow. Very tricky markets….
Certain strikes of put option contracts only up $250. I think a VIX over 20 can spike those prices imo.
Did you get short?! 🙂
If this is what I think it is, we are just getting underway…don’t waste your time trying to play market bounces…sit back, enjoy the ride matey!
no – i am waiting for a bounce tomorrow..
wait for a bounce to 2064-2070 then short….
Conservative is OK too. The volatility calls I picked up yesterday absolutely exploded to the upside today. The MM bamboozled me out of some puts expiring tomorrow with this morning’s deep retracement but I was able to reload the second we breached the minor four invalidation point- Thanks Lara!
I played it safe and sold my puts expiring tomorrow after a quick 100% return on the day trade. I think we are indeed due for a bounce to coincide with another bogus jobs number but I suspect it will be SHORT and sweet. 😀 😀
Nice, yes indeed jobs is bogus!
i have been shorting for 2 years non stop mostly… So, i remain cautious….
I can honestly wait 1 more day – no big deal! 2064 is my target tomorrow….
verne,
I got to give it to you – good call for the -55 handle drop.
I think we are going to bounce for 1-2 days +20-35 handles as VIX hitting resistance now. So, its not worth shorting here imo….
I can certainly understand your skepticism. How often over the years have we seen what seemed like no-brainer bearish set-ups only to have our faces ripped off by the bulls. The times…they are a’ changin’…
i agree but still come on. All down hill from here? Markets dont go in 1 direction with my view…especially not down. That flash crash was a chance of a lifetime..
we can bounce down…
Vernecarty is right. Vix just entered backwardation. Very bearish.
Ignore the market makers bid on your put options during the middle of a big decline as they will try to rob you, especially on mid and long dated positions. Try to sell at the capitulation phase when the VIX is spiking for the best price. If you have to unload because of impending expiration, you can generally get fillled at a much better price than the bid if you use a limit order.
Verne
You short overnight or looking for a re entry tomorrow short? I am still learning and GOT BURNED man. See my point for not getting short the past 2 days? Now -55 handles down and go short?
I got only a decade in markets mostly stocks and only a FEW YEARS in OPTIONS…
This party is just getting started and EVERYONE should have short positions at least mid term based on all the red flags we have been discussing. If you are using options and want to wait for a bounce to get in that’s fine but this market is going to be a lot lower three weeks from now…a lot lower…keep the big wave count picture in mind to help you pick your entry points.
i agree. i was just to scared honestly. Burned to many times verne! to many!
You looking for a bounce of some sort? 2070 now?
ES Daily at a channel bottom ES60 RSI at its bottom
John
Nice chart! You looking for a sharp bounce up? maybe 2084 tommorow?
Spoke too soon & my channel line was crooked
Re bounce, Ill leave that to Lara!
yeah – the problem is the hourly bollinger band is being violated now.
Second hand information from twitter : sounds like people are starting to cover
exactly….also yields exploding higher all day…
verne,
you looking for 2066 by the close ?
Third waves are notoriously relentless. They grab you by the throat and they don’t let go until everyone says “Uncle!”. Despite today’s powerful move down and any possible temporary relief tomorrow, nobody is anywhere CLOSE to capitulation.
Wow. Europe is falling off a cliff!
My wave count was wrong. This is a third wave down, it just can’t be a fourth wave correction. Which means the prior upwards wave was a three not a five.
This thing should be fast and strong. Bounces may be deep and quick too.
Working on a chart now to post here before the close.
cool!
Thanks Lara,
I’ve been waiting for this third wave…I’ll keep a 1/3 of my powder dry till we get to 3rd of 3rd…
Lets keep an eye on the bull…this could be a deep second wave correction of a larger fifth wave up to new highs…
True, that bullish alternate remains just possible. Extremely unlikely in my judgement due to the bearishness of technical analysis indicators on weekly and monthly charts (as well as EW structures not fitting well)….. but possible.
Sure looks like the start of a big third wave today.
VIX hanging tough and not so far signaling a bottom. Somebody’s gotta make a move sooner or later….like before the close…!
O.K invalidation point for minor four taken out…why did I let the market makers stop me out…?! Boy are they slick! 😀
No worries, intermediate plays still a go…
SPX is at the 200DMA if that goes I think the VXX will pop
A pause here that refreshes is to be expected, this third wave should demolish it and not look back for quite a while…one of three down may end just in time for the FEDs to reassure us everything is A-OK and usher in a second wave…
Still early but ES is heading upwards
ES HR
Broke up through weekly pivot ;Now testing as support
Choppy!
Big moves
verne,
Also something to think critically about as I stated early on: we could grind sideways until FOMC DEC 15/16 and then get near the ATH and then we tank lower soon after. I dont think the market is setup for a BIG DROP before the FOMC. Hypo – DOW,RUT and S&P grind slowly higher and NDX attempts all time highs area near 4816 in the meantime…
Probably a bear trap here – just saying…
verne
We got to focus at the open and look for that bounce. If the 2090’s become resistance it should show up even after Europe closes….I am afraid the game is OVER……
Good Call!
You are right in that we need to keep an open mind as anything can happen in this market. I like to have particular signs to look for that tell me a trend change is likely and an outside reversal day, while not a certainty, is one thing I have been keeping an eye out for-especially since the waves have been very complicated to analyze. The other thing that has been often true in the past are tops coinciding with, or being quite close to central bank announcements. We got the outside reversal yesterday, we get the central bank announcement today. Caution is warranted methinks…wise to be properly hedged, whatever the outcome, but I must admit I biased to the bearish side. Futures fading as we speak…