Thursday’s analysis expected more upwards movement for Friday which is what has happened.
The wave count remains the same.
Click on the charts below to enlarge.
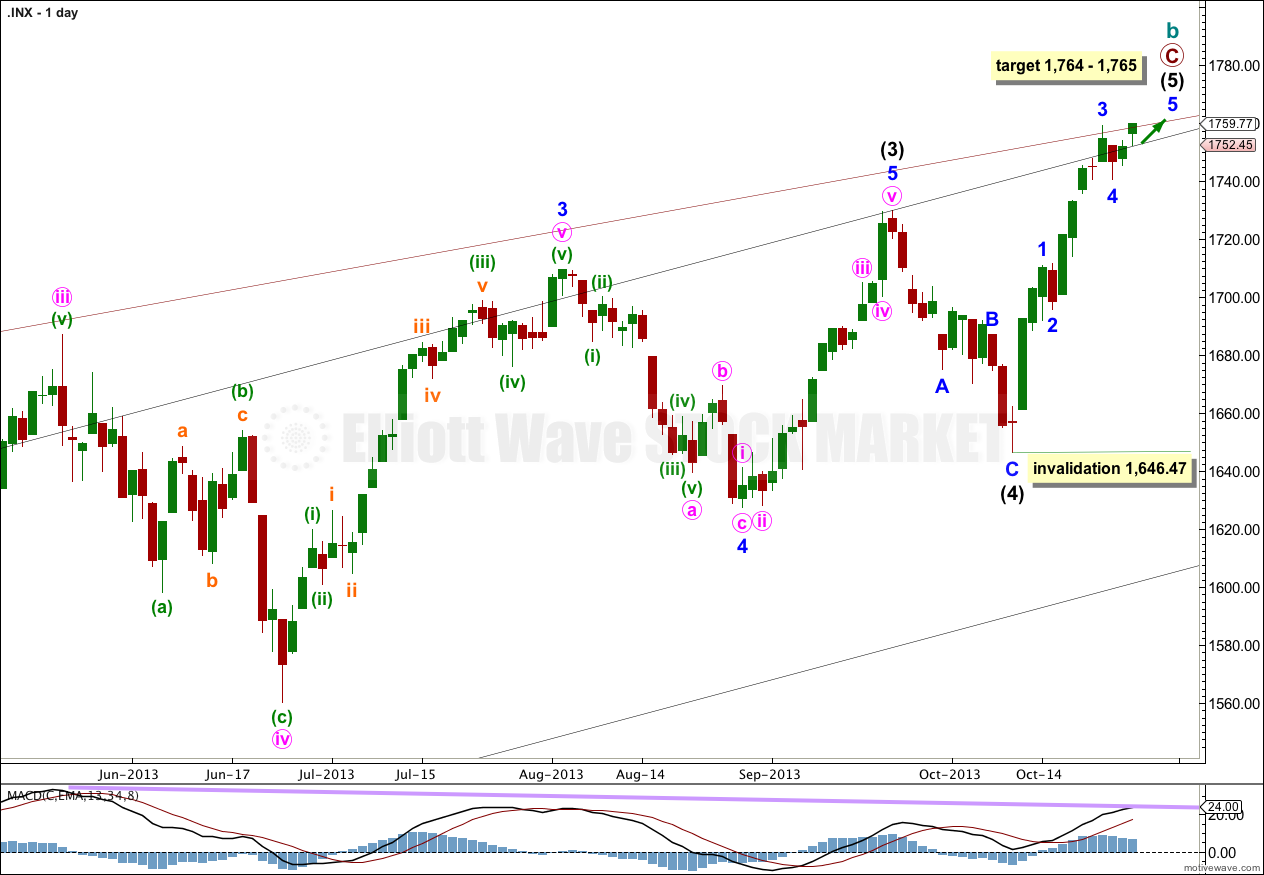
Intermediate wave (4) lasted 14 days, just one more than a Fibonacci 13.
If intermediate wave (5) exhibits a Fibonacci time relationship it may end in a Fibonacci 13 days (or sessions) on 28th October. Please note: this is a rough guideline only. Within this wave count there are few Fibonacci time relationships at primary or intermediate degree. Sometimes this happens, but not often enough to be reliable.
October is a common month for big trend changes with the S&P 500. This wave count could very well complete the structure for intermediate wave (5) this month, and maybe even this week.
Within primary wave C intermediate wave (3) was just 0.76 points longer than 2.618 the length of intermediate wave (1).
Ratios within intermediate wave (3) are: minor wave 3 was 16.23 points longer than 1.618 the length of minor wave 1, and minor wave 5 was just 2.14 points short of 0.236 the length of minor wave 3.
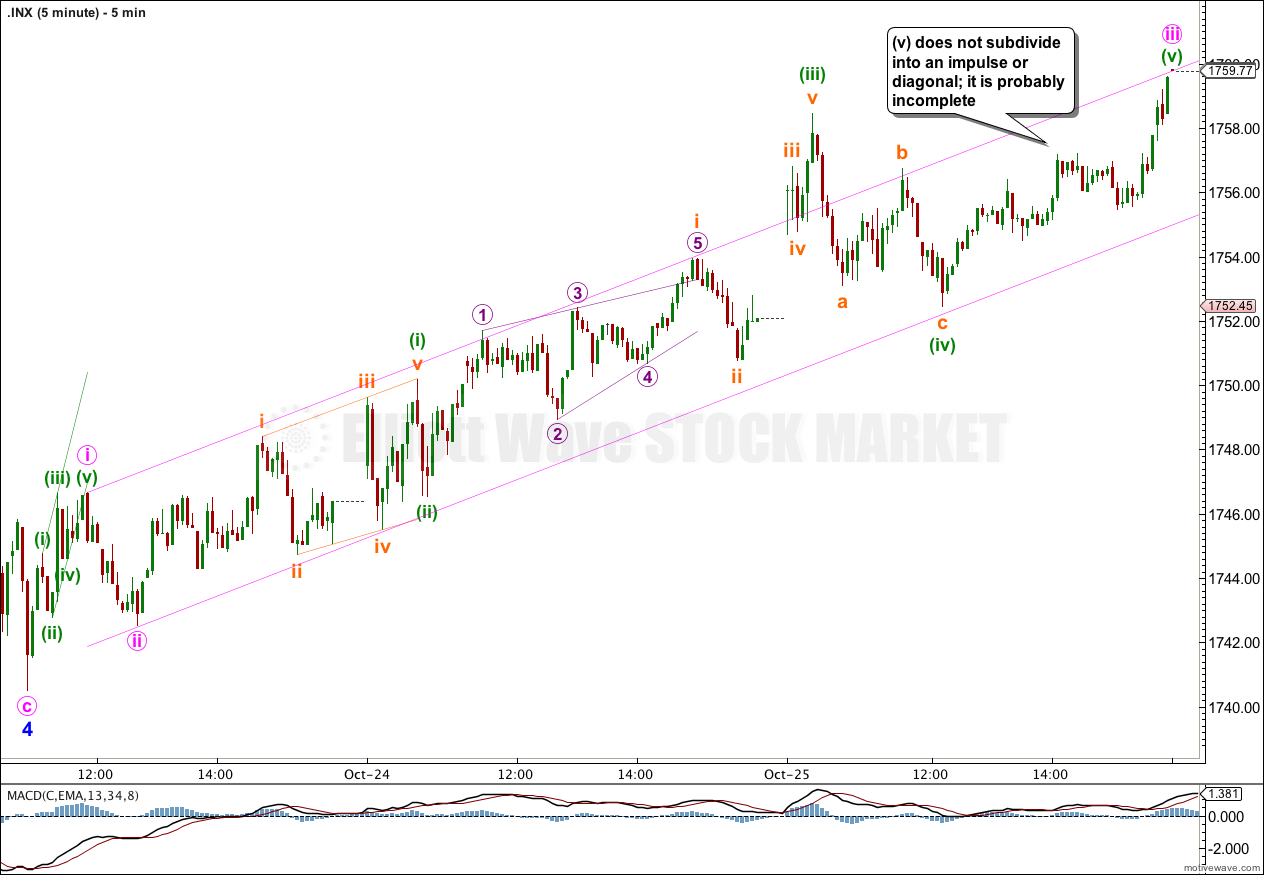
Ratios within minor wave 3 are: minute wave iii was just 7.66 points longer than 1.618 the length of minute wave i, and minute wave v has no Fibonacci ratio to either of minute waves iii or i.
At 1,764 primary wave C would reach equality with primary wave A. If price continues through this first target then the next target would be at 1,781 where intermediate wave (5) would reach 0.236 the length of intermediate wave (3).
Within intermediate wave (5) no second wave correction may move beyond the start of the first wave. This wave count is invalidated with movement below 1,646.47.
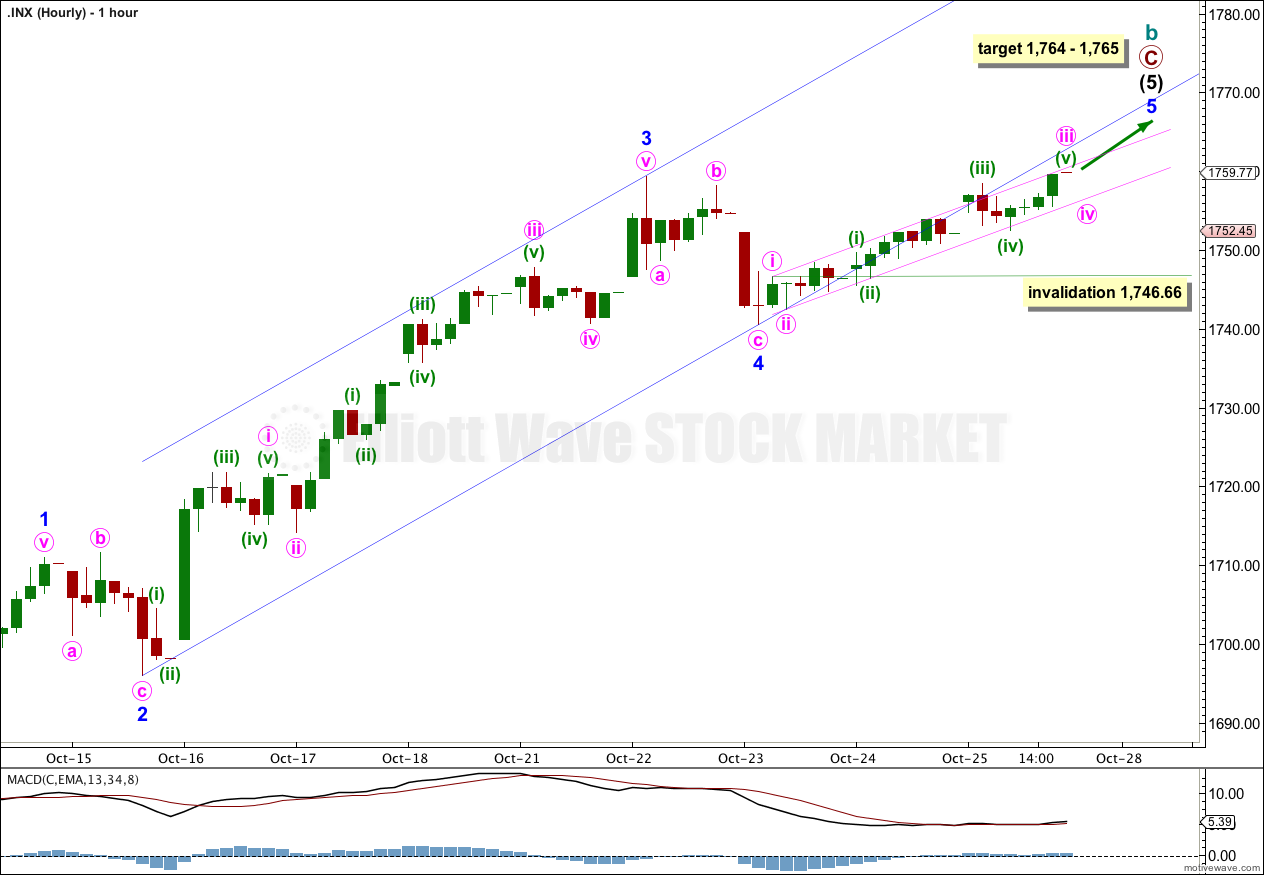
Within minute wave iii the fifth wave is incomplete and so price should move higher when markets open. Minute wave iii has just passed 2.618 the length of minute wave i. It may not exhibit a Fibonacci ratio to minute wave i.
From the five minute chart ratios within minute wave iii are: minuette wave (iii) is 0.47 points short of 1.618 the length of minuette wave (i), and minuette wave (v) is so far 0.36 points short of equality with minuette wave (i).
I have redrawn the parallel channel about minor wave 5. Draw the first trend line from the highs of minute waves i to iii, then place a parallel copy upon the low of minute wave ii. Minute wave iv may find support at the lower end of the channel. When this channel is very clearly breached by downwards movement then that will be the very first indication of a possible trend change.
Minute wave iv may not move into minute wave i price territory. This wave count is invalidated with movement below 1,746.66.


Hi Lara-
What is the max extension for a B wave in an expanded flat? Just curious because the 123.6% extension from the 667 low gets us to 1790. Can they extend all the way to the 138.2% extension which gets us to 1923???