
Last analysis expected more upwards movement to a short term target at 1,760 to 1,761. Price did move very slightly higher, but has fallen well short of the target.
The structure is unfolding as expected even if the wave lengths are not. This structure is extremely close to completion.
Click on the charts below to enlarge.
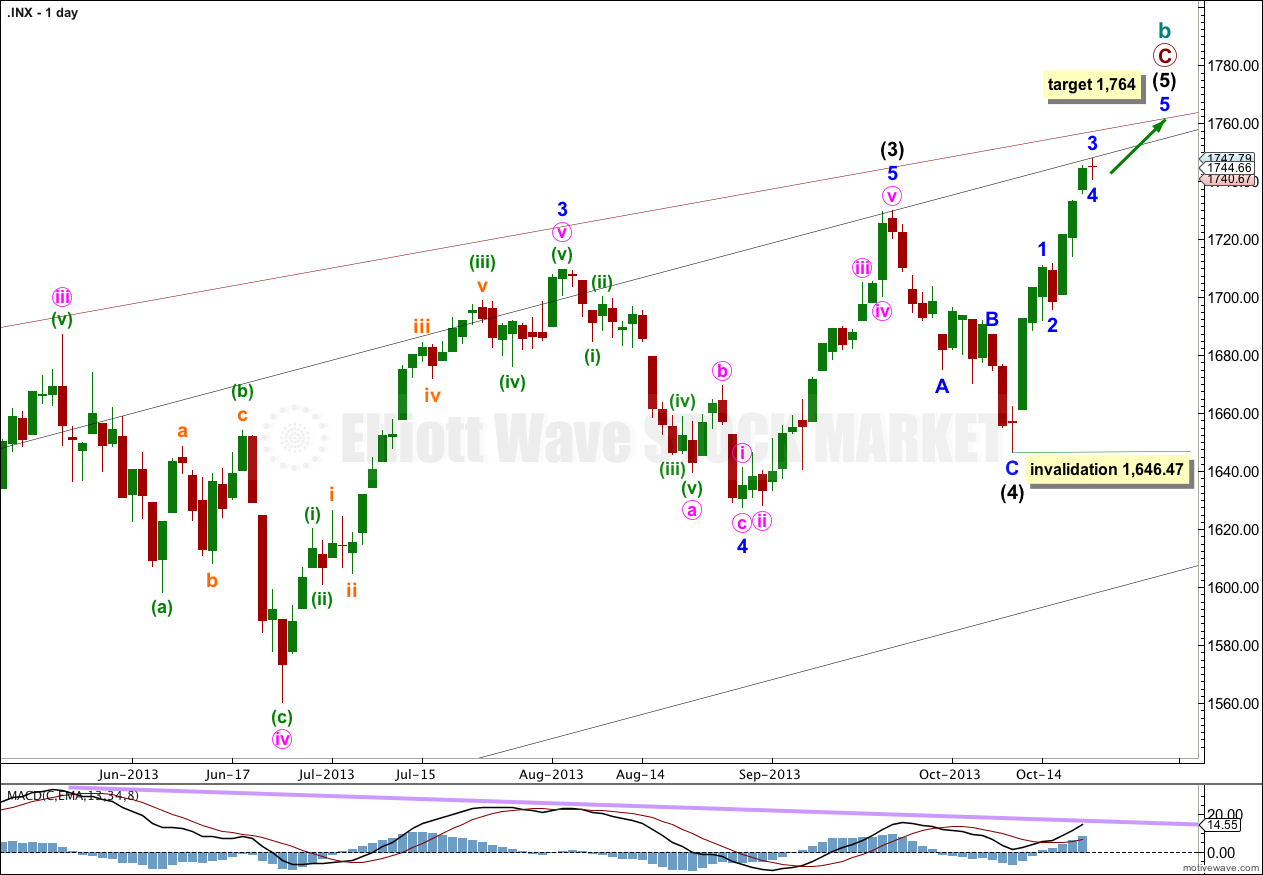
Intermediate wave (4) lasted 14 days, just one more than a Fibonacci 13.
If intermediate wave (5) exhibits a Fibonacci time relationship it may end in a Fibonacci 13 days (or sessions) on 28th October. Please note: this is a rough guideline only. Within this wave count there are few Fibonacci time relationships at primary or intermediate degree. Sometimes this happens, but not often enough to be reliable.
October is a common month for big trend changes with the S&P 500. This wave count could very well complete the structure for intermediate wave (5) this month, and maybe even this week.
At 1,764 primary wave C would reach equality with primary wave A.
Within intermediate wave (5) no second wave correction may move beyond the start of the first wave. This wave count is invalidated with movement below 1,646.47.
Minor wave 3 may be over. I expect this is likely for two reasons: Monday’s candlestick shows up as red on the daily chart which is what I would expect minor wave 4 to look like, and downwards movement breached the parallel channel drawn about minor wave 3 on the hourly chart for the end of week analysis.
Minor wave 3 has no Fibonacci ratio to minor wave 1, and most importantly it is shorter than the first wave. If this wave count is correct then it limits the length of the fifth wave to no longer than 51.86 points.
Minor wave 3 shows a stronger momentum as indicated by MACD which is what it should do. This wave count has a good and typical look.
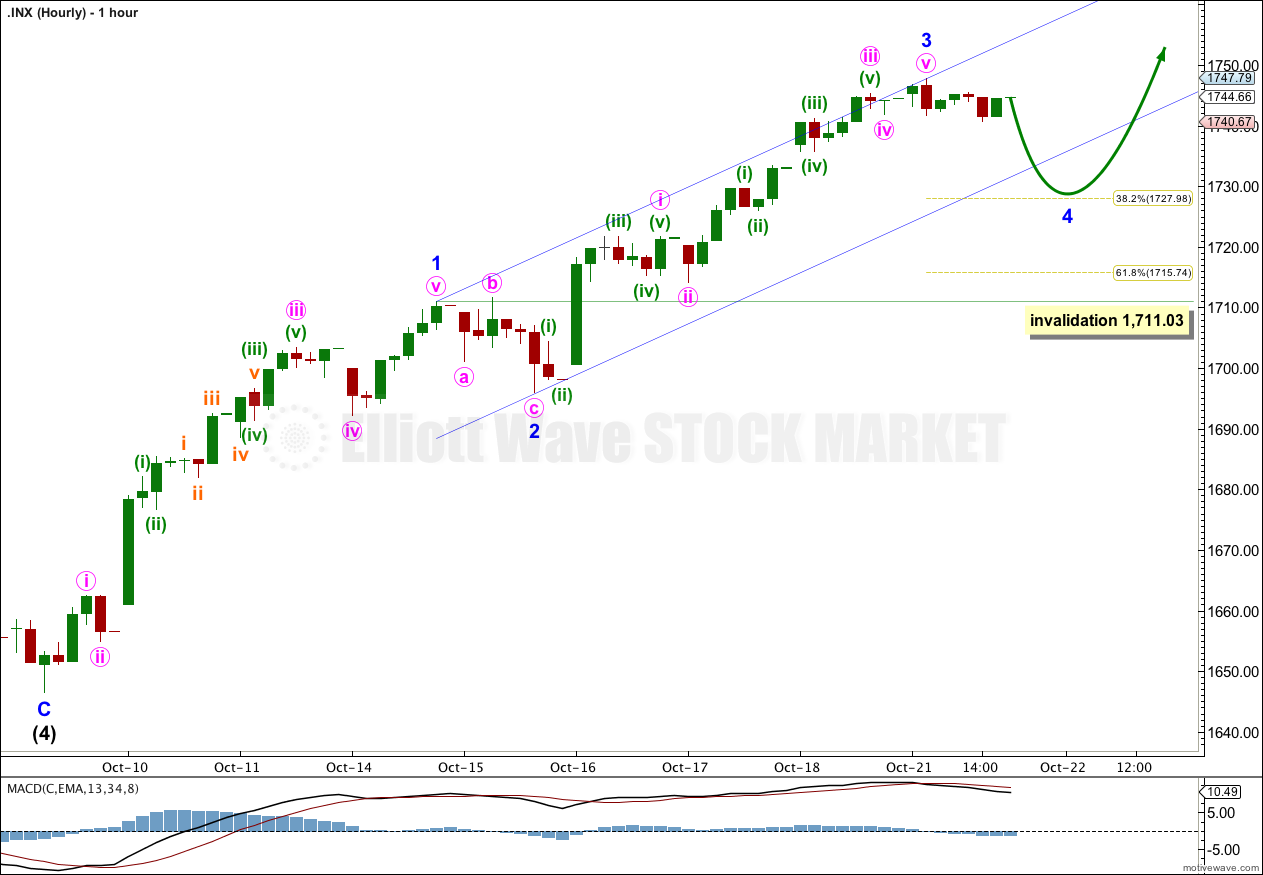
Ratios within minor wave 3 are: minute wave iii has no Fibonacci ratio to minute wave i, and minute wave v is just 0.07 short of 0.236 the length of minute wave i.
Minor wave 2 was a very shallow 23% expanded flat correction of minor wave 1. Given the guideline of alternation I would expect minor wave 4 to be deeper. It may end about the 0.382 Fibonacci ratio, and could even reach down to the 0.618 Fibonacci ratio of minor wave 3.
Minor wave 4 may take one of several structures; a zigzag, double, combination or triangle are most likely (in that order). It should last about one to three days at the most, and has already taken up most of one day. It should be over either tomorrow or the day after.
When minor wave 4 is complete I will use minor wave degree to calculate the target for the final fifth wave up.
Minor wave 4 may not move into minor wave 1 price territory. This wave count is invalidated with movement below 1,711.03.