Last week’s analysis of the Dow expected upwards movement for this week which is what has happened.
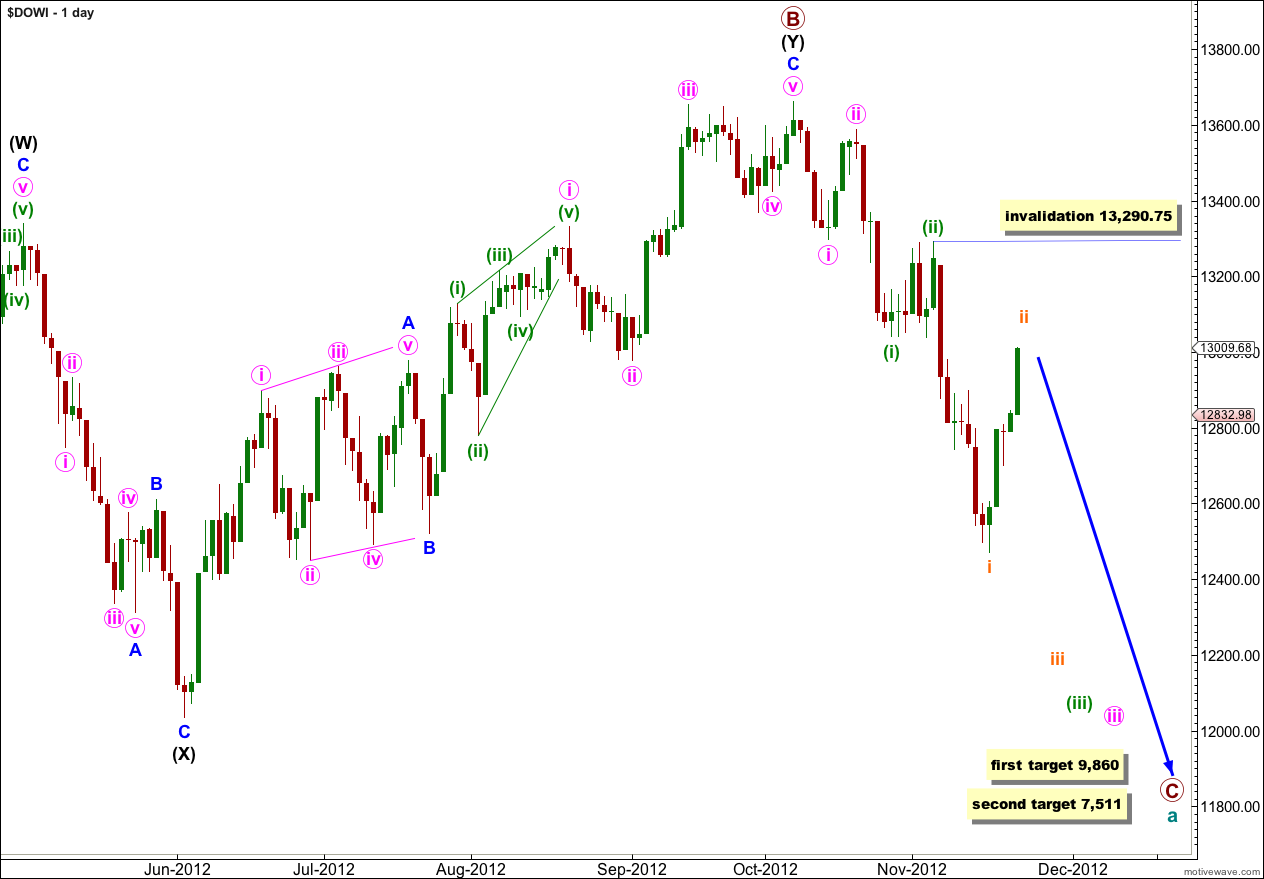
Although price remains below the invalidation point I have adjusted the wave count to remain in line with the S&P 500. The slightly different take on recent movement has a typical look and a good probability.
This week I still have just the one daily wave count for you with only one hourly wave count at this stage.
Click on the charts below to enlarge.
At the monthly chart level this wave count sees a common structure of a double flat unfolding at super cycle degree, and within the second flat primary waves A and B are complete. Primary wave B is a 139% correction of primary wave A.
Downwards movement is moving towards the middle of a third wave for iii pink with so far a series of overlapping first and second waves.
This is a very common scenario, because it is most commonly the third wave which is extended and this is preceded by a series of first and second waves.
Wave 2 purple may not move beyond the start of wave 1 purple. This wave count is invalidated with movement above 13,290.75.
Targets for wave C at primary degree are long term, they are months away. At 9,860 primary wave C would reach 1.618 the length of primary wave A. At 7,511 primary wave C would reach 2.618 the length of primary wave A.
The subdivisions on this wave count are identical within the downwards movement to the last analysis, except all labeling has been moved down one degree.
Upwards movement instead of being a fourth wave correction may be a second wave correction.
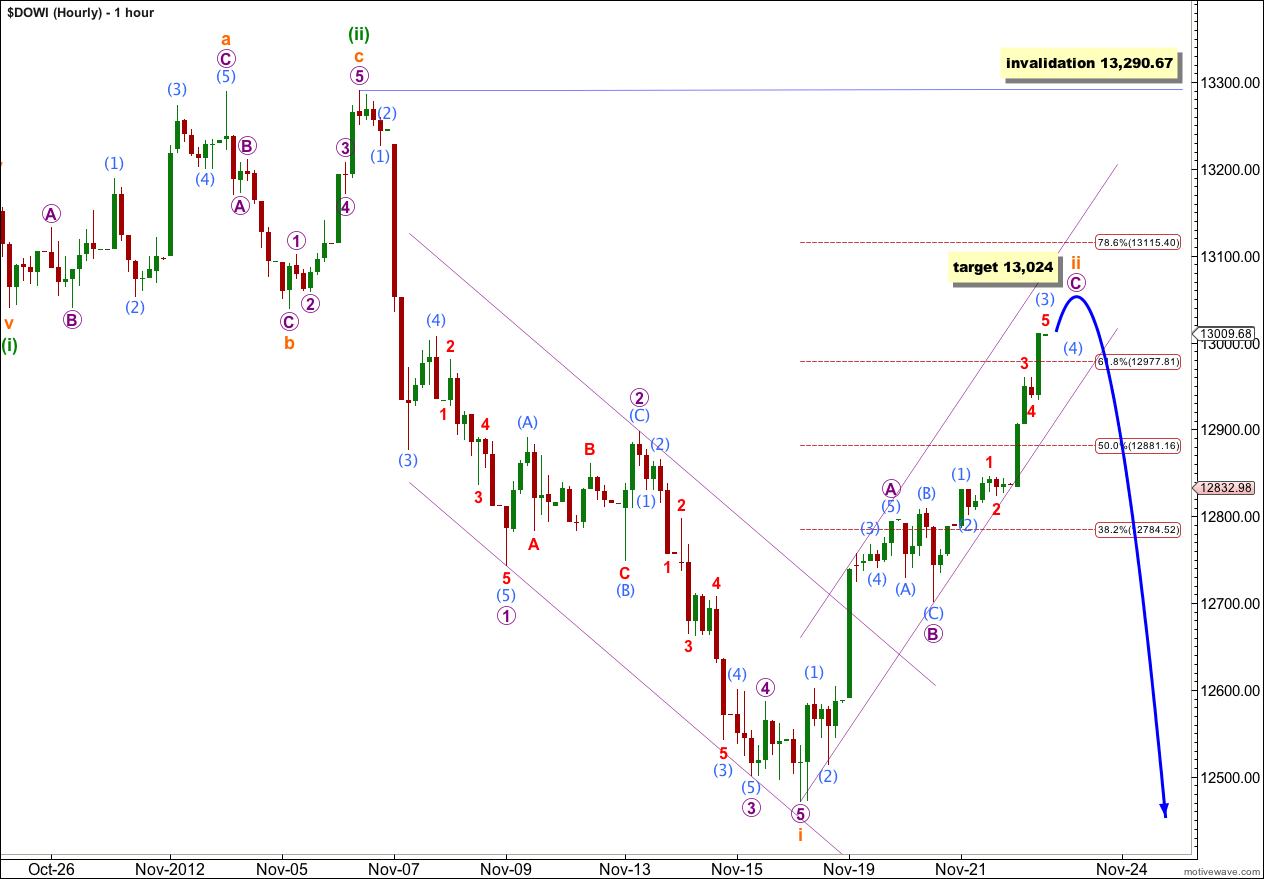
Second waves are most typically zigzags and are often very deep corrections. This one has so far reached above the 0.618 Fibonacci ratio of wave 1 purple and the structure is incomplete, and it needs to move higher.
At 13,024 wave C purple would reach equality in length with wave A purple.
Draw a channel about wave ii orange with the first trend line from the start of wave A purple to the low labeled wave B purple, then place a parallel channel on the outer edge of wave A purple. We may see wave C purple end about the upper edge of this channel.
Wave ii orange may not move beyond the start of wave i orange. This wave count is invalidated with movement above 13,290.67.
When wave ii orange is complete then we should expect strong downwards movement for wave iii orange. If this wave count is correct this downwards movement may be explosive.
When the channel about wave ii orange is clearly breached with downwards movement we shall have trend channel indication that wave iii orange has begun.
If wave ii orange lasts only one more day it would have lasted a Fibonacci 5 days. Otherwise it may end in another 4 days lasting a Fibonacci 8 days.


Thought it would likely be a 2nd wave unfolding. $US nosedived from this rally to what now looks like a complete 2nd wave correction of the 1st of 3rd wave up. Many call for dollar doom but the alternative consistent with Lara’s SPX and DOW counts uses elliott, fibonacci and gann methods to reach 83.094 (or 3.5% increase) by beginning of 2nd week in December or maybe Christmas.
http://twitpic.com/bfxp3u/full