The Dow did move higher at the beginning of last week and the wave count remained valid. Thereafter, we saw downwards movement during the week which is what the main wave count expected.
I still have two wave counts for you: the main wave count has one hourly chart and the alternate wave count may be used if the main wave count is invalidated.
Click on the charts below to enlarge.
Main Wave Count.
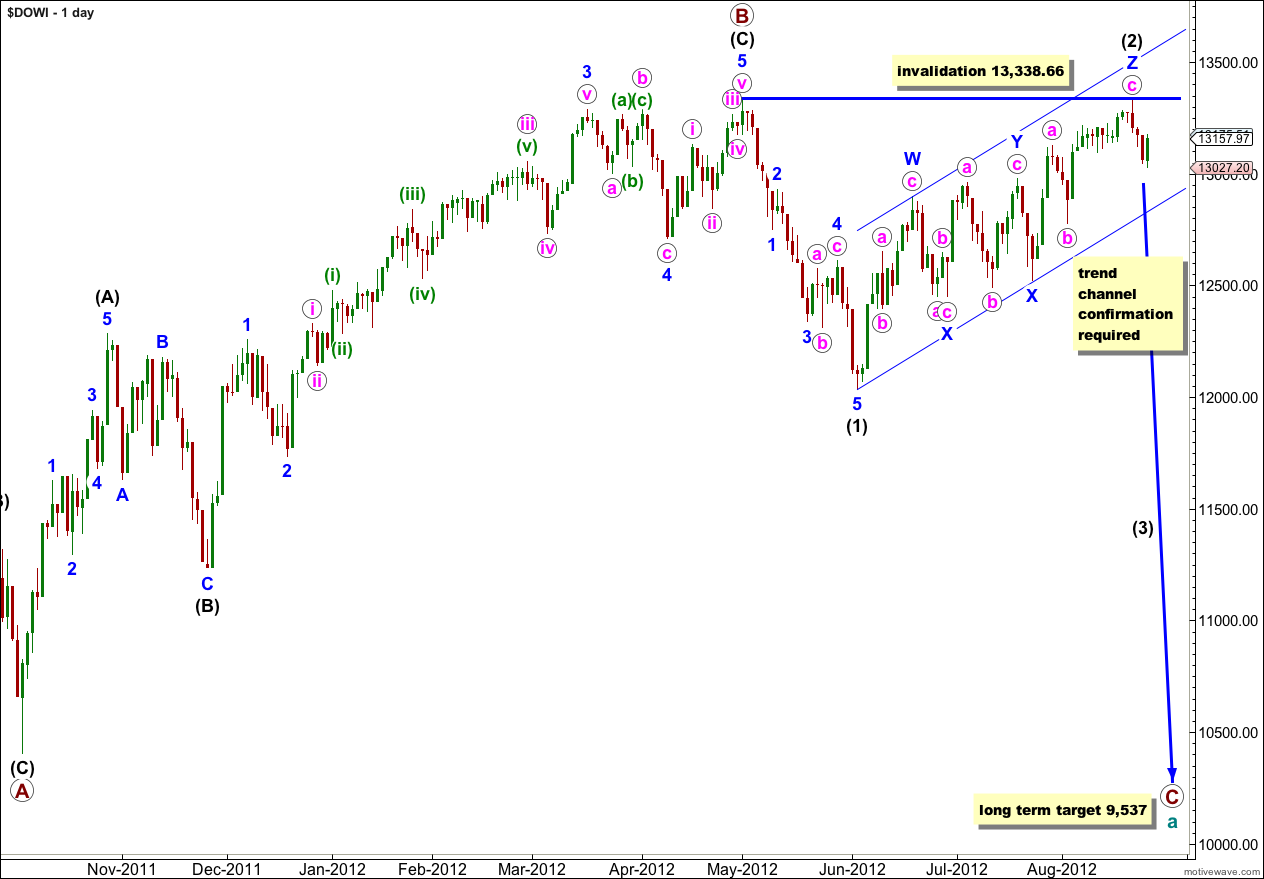
Wave (2) black may have ended last week as a very rare triple zigzag. The subdivisions all fit and the purpose of a triple zigzag to deepen a correction is being achieved; movement is clearly upwards and not sideways.
Cycle wave a is an expanded flat because primary wave B within it is over 105% the length of primary wave A. An expanded flat expects a C wave to move substantially beyond the end of the A wave. At 9,537 primary wave C would achieve this and would be a typical 1.618 the length of primary wave A.
The parallel channel drawn here about wave (2) black is a best fit. Movement below this channel would confirm a trend change.
Wave (2) black may not move beyond the start of wave (1) black. This wave count is invalidated with movement above 13,338.66.
If this wave count is invalidated with movement above 13,338.66 we should use the alternate daily wave count below.
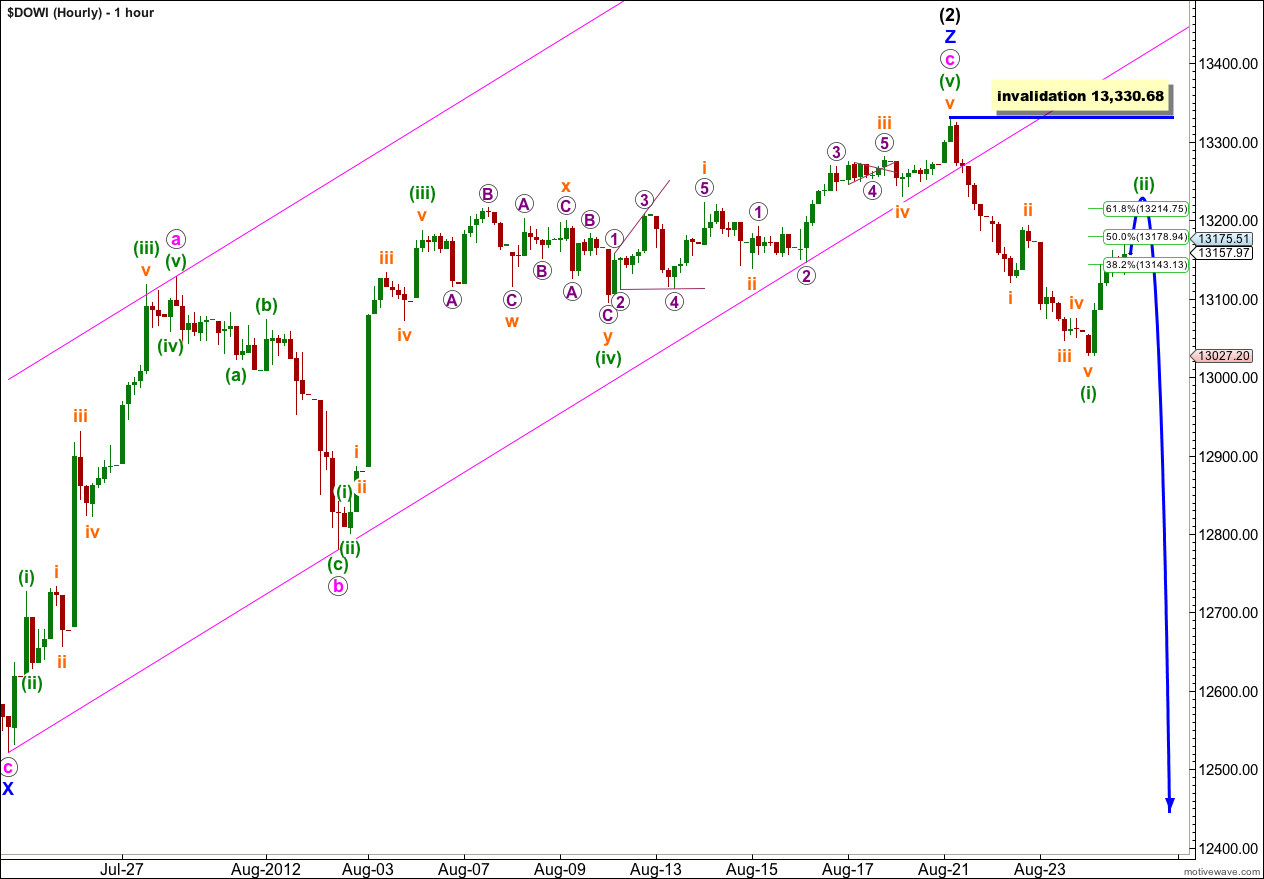
This hourly chart shows the subdivisions of the third and final zigzag within wave (2) black, wave Z blue.
Wave c pink within wave Z blue has no Fibonacci ratio to wave a pink.
Ratios within wave c pink are: wave (iii) green is 16.8 points longer than 6.854 the length of wave (i) green, and wave (v) green is just 7.26 points longer than 4.236 the length of wave (i) green and 3.1 points short of 0.618 the length of wave (iii) green.
Within wave (v) green there are no Fibonacci ratios between waves i, iii and v orange.
Downwards movement from the high at 13,330.68 subdivides nicely on the 5 minute chart into an impulse.
Ratios within wave (i) green are: wave iii orange is 10.8 points short of 0.618 the length of wave i orange, and wave v orange is 6.4 points longer than 0.382 the length of wave i orange.
Upwards movement for wave (ii) green is unlikely to be over, when it is complete it should be a clear obvious zigzag on the hourly chart. It would be most likely to end about the 0.618 Fibonacci ratio of wave (i) green at 13,214.75.
Wave (ii) green may not move beyond the start of wave (i) green. This wave count is invalidated with movement above 13,330.68.
Alternate Wave Count.
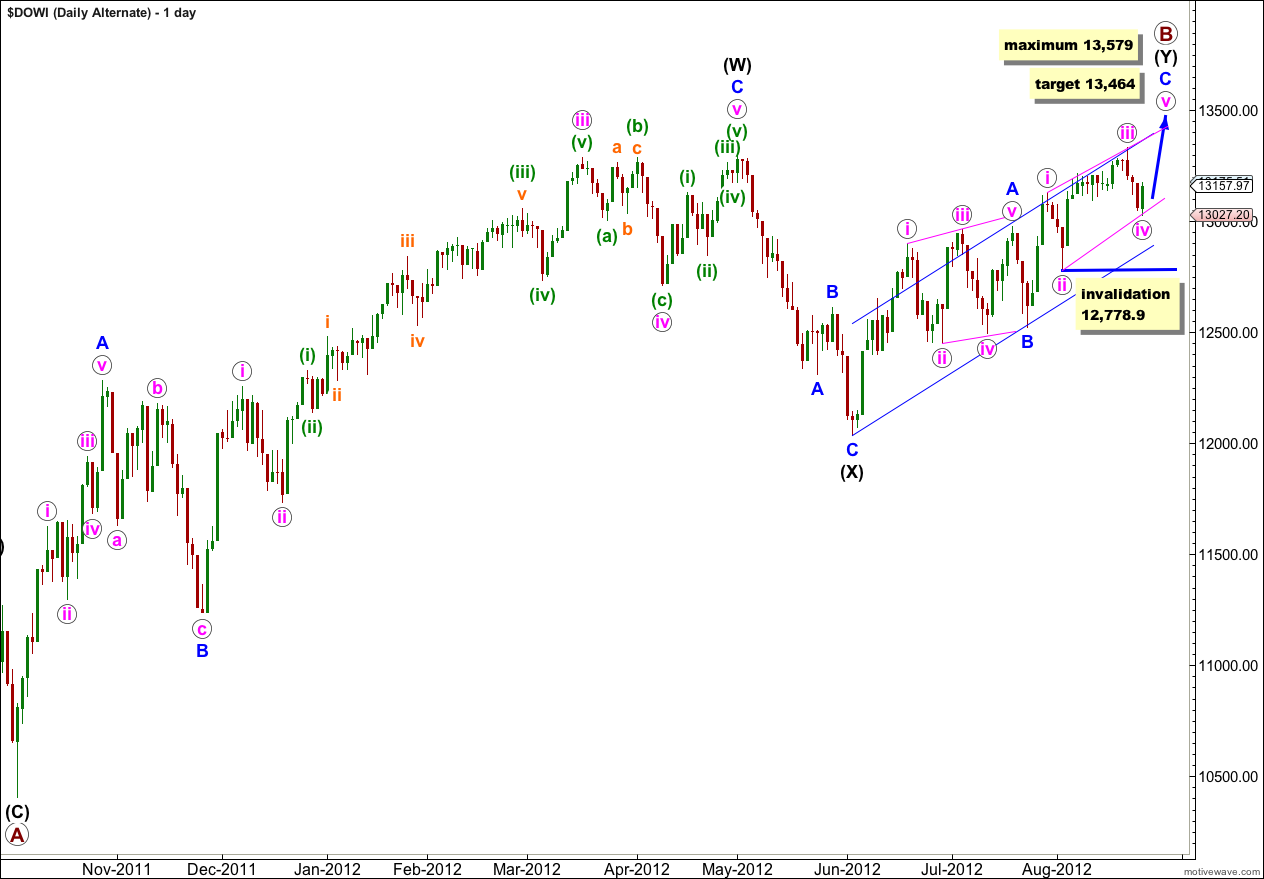
It is possible that primary (maroon) wave B is not over as a single zigzag and may be continuing further as a double zigzag. Unfortunately, with the Dow, downwards movement labeled here wave (X) black is ambiguous and may be seen either as a three or a five, and indeed looks pretty good as a three.
If this is the case then upwards movement from the low labeled (X) black could be seen as a single zigzag. However, this is where this wave count encounters problems. The structure upwards does not subdivide nicely into a single zigzag. The possible leading diagonal for wave A blue subdivides into a series of three wave structures but wave iv pink is longer than wave ii pink, while wave iii pink is shorter than wave i pink and wave v pink is shorter than wave iii pink. The actionary waves suggest a contracting diagonal, while the reactionary waves suggest an expanding diagonal. I will consider this possibility even though it does not meet rules for a typical diagonal because the third wave is not the shortest. I have on occasion seen diagonals where the wave lengths are not as expected, but it is rare. This reduces the probability that this wave count is correct.
Wave C blue may also be unfolding as a diagonal. An ending diagonal requires all subwaves to subdivide into zigzags. The upwards movement labeled wave i pink within wave C blue subdivides easily into an impulse on the hourly chart, so to see this as a zigzag reduces the probability of this wave count further.
Within the ending diagonal for wave C blue wave iii pink may not be the shortest wave. This gives a maximum limit to wave v pink at equality with wave iii pink at 13,579.
At 13,464 wave C blue would reach equality with wave A blue.
Within the ending diagonal of wave C blue wave iv pink may not move beyond the end of wave ii pink. This wave count is invalidated with movement below 12,778.9.


The link for “Tselem” under Friends of Elliott Wave Stock Market does not work. I thought you might like to be aware of this.
Rodney
You main count for the Dow Industrials expects downward impulsive movement in a third wave while your main count for the S&P expects continued upward and corrective movement. I do not see how both can be correct as they are diametrically opposed to one another.
The next couple of days should resolve this divergence. I was thinking that finally at this top of wave B, the two counts would align. Any thoughts?
Thanks,
Rodney