
Last analysis expected downwards movement to a target of 1,320 – 1,317 before the beginning of a deeper more long lasting upwards movement. Downwards movement did not occur and upwards movement quickly broke the channel indicating a more long lasting upwards trend.
I still have one daily wave count with two hourly wave counts.
Click on the charts below to enlarge.
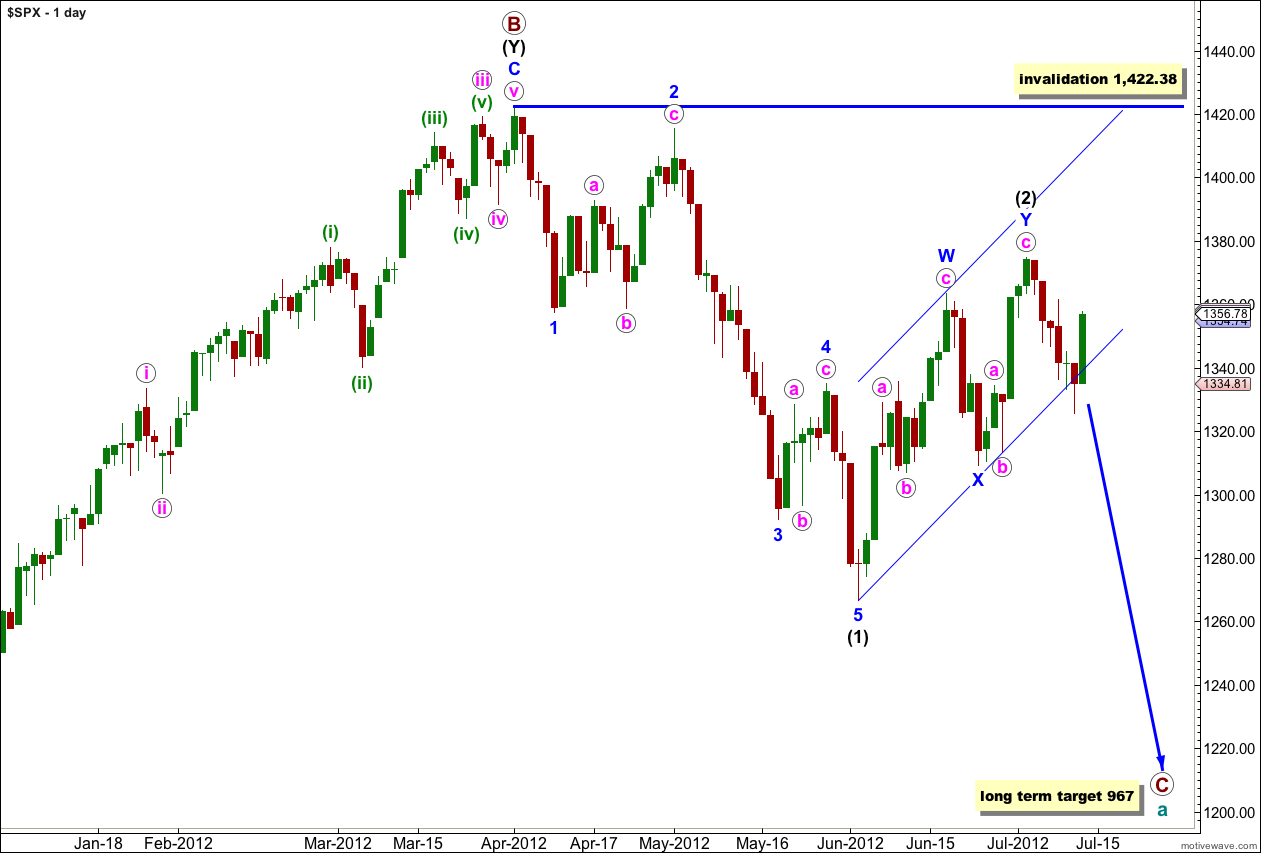
This wave count sees a big trend change at the price high of 1,422.38. Primary wave C should make substantial new lows below the end of primary wave A which had its low at 1,074.77. Primary wave C would reach 1.618 the length of primary wave A at 967, completing a typical expanded flat for cycle wave a.
Within primary wave C wave (1) black is a complete five wave impulse downwards. Wave (2) black is unfolding as a double zigzag structure. The purpose of a double zigzag is to deepen a correction. At this stage the final structure of wave Y blue, the second zigzag, may be either complete or is still a few days away from completion.
With price moving strongly back into the parallel channel containing wave (2) black we do not have a trend channel breach. Prior to a proper channel breach I will not calculate a target for wave (3) black, it would be premature. We must consider the possibility that there has been no trend change.
Wave (2) black may not move beyond the start of wave (1) black. This wave count is invalidated with movement above 1,422.38.
I have the same two hourly wave counts today which look at this most recent movement differently. Again these hourly wave counts diverge, with the main hourly chart expecting downwards movement, and the alternate expecting upwards movement.
Main Hourly Wave Count.
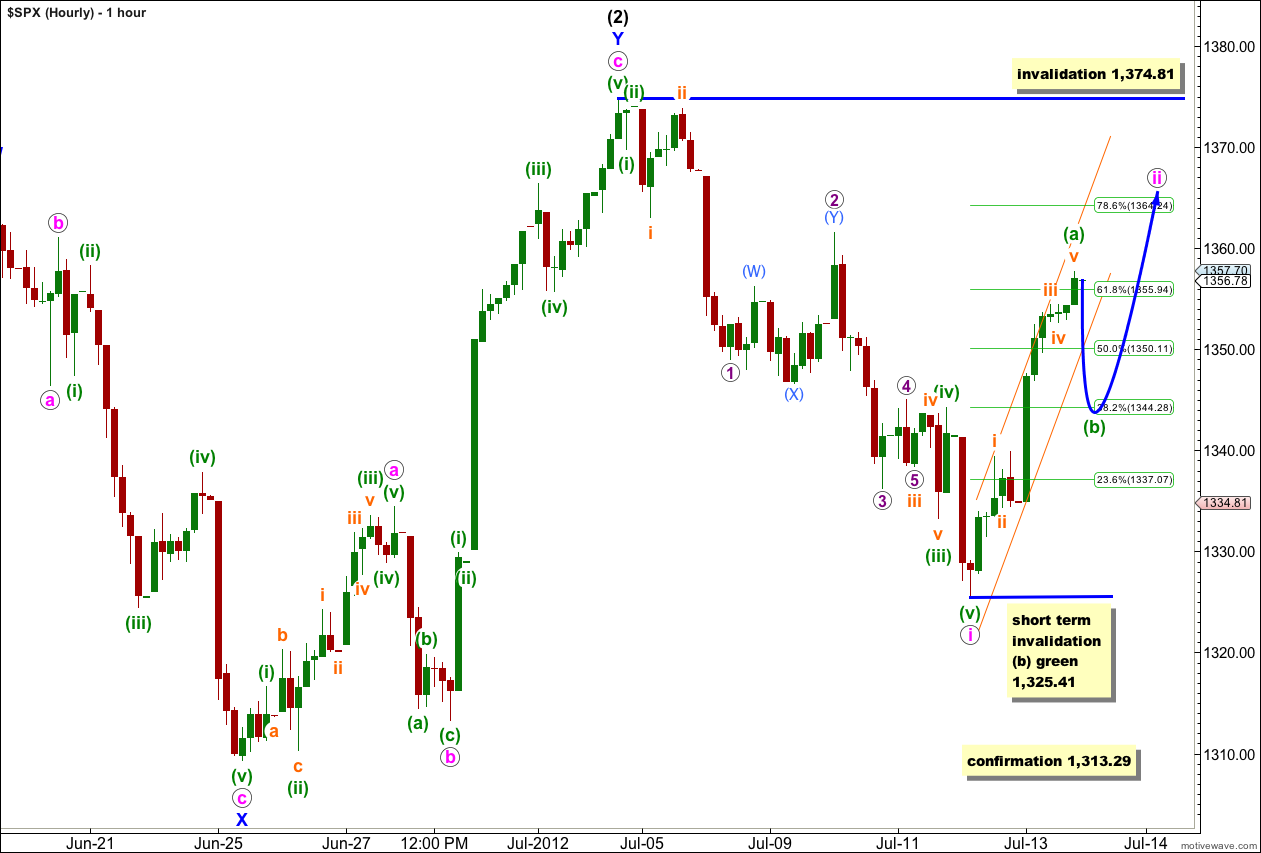
Upwards movement during Friday’s session is ambiguous; it may be seen as either a three or a five on the 5 minute chart. It is more easily seen as a five and this fits better with an expected duration of wave ii pink.
Movement above the short term invalidation point and outside of the parallel trend channel on the last hourly chart indicated that wave i pink was over and wave ii pink upwards was underway.
Within wave i pink there are no Fibonacci ratios between green waves (i), (iii) and (v).
Ratios within wave (iii) green are: wave iii orange has no Fibonacci ratio to wave i orange, and wave v orange is just 0.74 points short of equality with wave i orange.
Ratios within wave iii orange are: wave 3 purple is just 0.37 points longer than equality with wave 1 purple, and wave 5 purple has no adequate Fibonacci ratio to either of 1 or 3 purple.
Ratios within wave (a) green of wave ii pink are: wave iii orange has no Fibonacci ratio to wave i orange, and wave v orange is 0.35 points short of 0.236 the length of wave iii orange (these ratios were worked out on the 5 minute chart, and wave iv orange is a double combination).
This wave count has one truncation within it for wave 5 purple of wave iii orange, but it avoids a rare running flat. It has a reasonable probability.
So far wave ii pink has reached just above the 0.618 Fibonacci ratio of wave i pink. It is possible that it was a brief sharp zigzag and if downwards movement breaches the short term invalidation point at 1,325.41 then wave ii pink would be complete, and a breach of this invalidation point would strongly indicate the start of a third wave down.
However, seeing upwards movement of wave ii pink as a five and only wave (a) green within wave ii pink as over has a better fit. The small orange parallel channel on today’s chart is drawn as a best fit about upwards movement. I would expect wave (b) green to most likely breach this channel with downwards movement. Thereafter, wave (c) green upwards should make a new high beyond the end of wave (a) green at 1,357.7. When we have the end of wave (b) green then we may calculate a target for wave (c) green to complete wave ii pink.
Wave ii pink may not move beyond the start of wave i pink. This wave count is invalidated with movement above 1,374.81.
Alternate Hourly Wave Count.
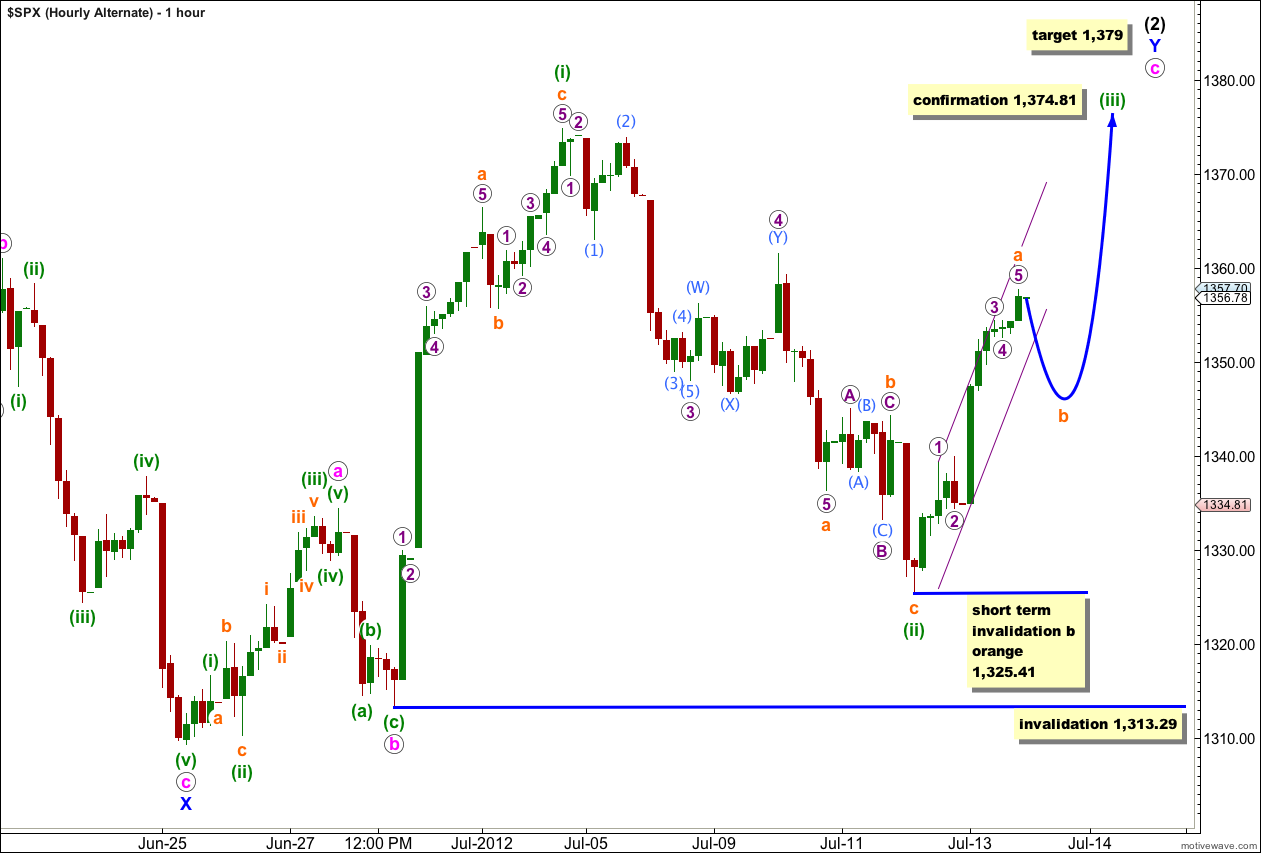
This alternate wave count expected upwards movement during Friday’s session. Although that is what happened it has not been enough yet to confirm this alternate wave count and this still has a slightly lower probability than the main wave count.
If wave c pink is continuing as an ending diagonal then wave (iii) green must subdivide into a zigzag and must move beyond the end of wave (i) green to make a new high above 1,374.81.
Within wave (iii) green it may be likely that wave a orange is complete. Wave b orange should take price lower before wave c orange upwards completes wave (iii) green.
This wave count includes a rare running flat which is possible for wave b orange within wave (ii) green. I will leave the invalidation point at 1,313.29 because it is possible to see wave (ii) green as incomplete. Only movement below 1,313.29 would finally invalidate any variation of this alternate wave count and provide confidence in the main wave count.
The small channel containing this movement should be breached by a little downwards movement before price turns back higher.
In the short term when markets open on Monday downwards movement for wave b orange may not move beyond the start of wave a orange. This wave count is invalidated in the short term with movement below 1,325.41.
Things That Make You Go Hmmm – Such As QE3 Marking An S&P500… Top? http://www.zerohedge.com/news/things-make-you-go-hmmm-such-qe3-marking-sp500-top
Bingo I think we have a winner … 1516.00
Do you have a month on when 967 hits?