
The S&P 500 has moved mostly sideways, but importantly our main hourly wave count was invalidated by a fraction of a point by upwards movement. Our one daily wave count looks correct and we have mid and long term targets for this.
Click on the charts below to enlarge.
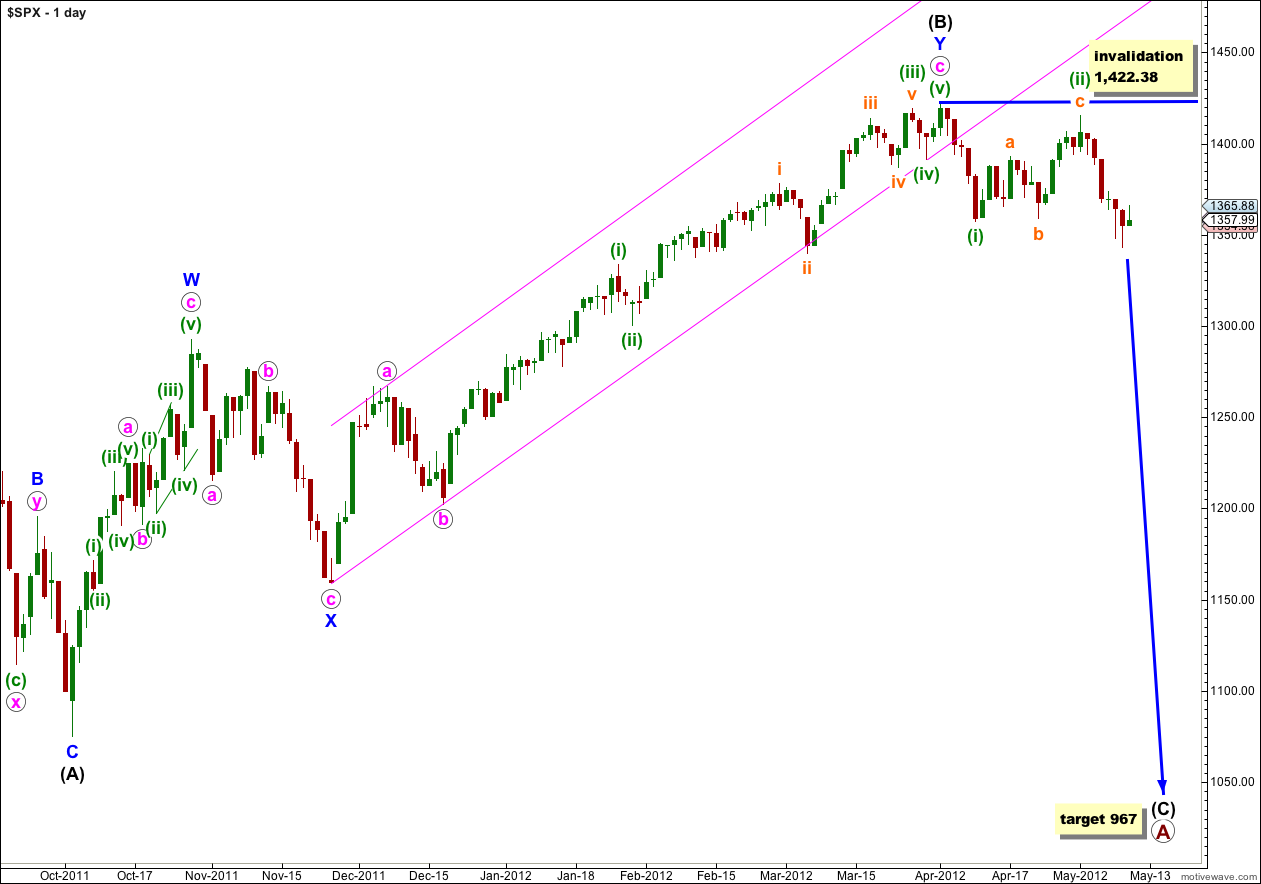
It looks highly likely that we have recently seen a very large trend change on the S&P 500 and a new downwards trend, to last months, has begun.
At primary degree wave A is an expanded flat correction. Wave (A) black within it subdivides into a three, and wave (B) black is over 105% of wave (A) black at 123%. The minimum requirements for an expanded flat are met. We should expect wave (C) black to subdivide into a five and move price substantially beyond the end of wave (A) black at 1,074.77.
At 967 wave (C) black would reach 1.618 the length of wave (A) black. If price continues through this first target, or it gets there and the structure is incomplete, then our second (less likely) target is at 685 where wave (C) black would reach 2.618 the length of wave (A) black.
Wave (A) black lasted 4 months. Wave (B) black lasted 6 months. We may expect wave (C) black to last at least 4 months, if not longer.
If wave (ii) green continues further as a double flat or combination it may not move beyond the start of wave (i) green. This wave count is invalidated with movement above 1,422.38.
Main Hourly Wave Count.
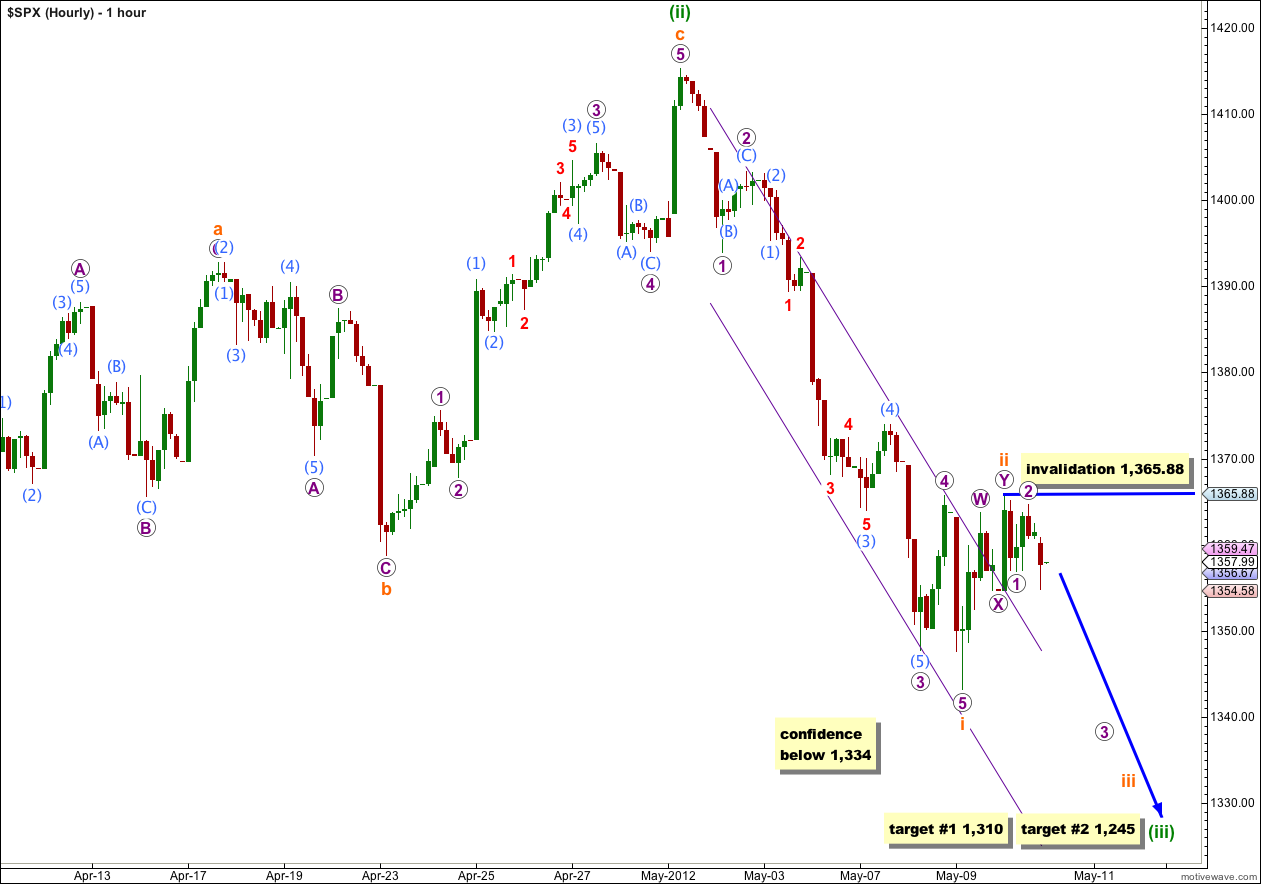
This wave count is slightly different from yesterday’s alternate in the subdivisions of wave i orange downwards. The alternate did not fit with recent subdivisions on the 5 minute chart and I have taken another look at this.
This wave count has a slightly higher probability than the alternate, and both are entirely possible and subdivisions fit very well for both.
Wave i orange may have ended lower at 1,343.13.
Ratios within wave i orange are: wave 3 purple is just 0.36 points short of 2.618 the length of wave 1 purple, and wave 5 purple is just 1.21 points longer than equality with wave 1 purple. These are excellent Fibonacci ratios.
Ratios within wave 3 purple are: wave (3) aqua is 2.97 points longer than 4.236 the length of wave (1) aqua (this variation is less than 10% and acceptable), and wave (5) aqua has no Fibonacci ratio to either of waves (1) or (3) aqua.
Within wave (3) aqua there are no Fibonacci ratios between waves 1, 3 and 5 red.
Within wave ii orange this best subdivides on the 5 minute chart as a double zigzag. If wave ii orange is over already it was a shallow 32% correction of wave i orange.
Within wave iii orange no second wave correction may move beyond the start of it’s first wave. This wave count is invalidated with movement above 1,365.88.
Movement below 1,334 would significantly increase the probability of this wave count. At that stage we may have more confidence that the middle of the third wave is underway.
Alternate Hourly Wave Count.
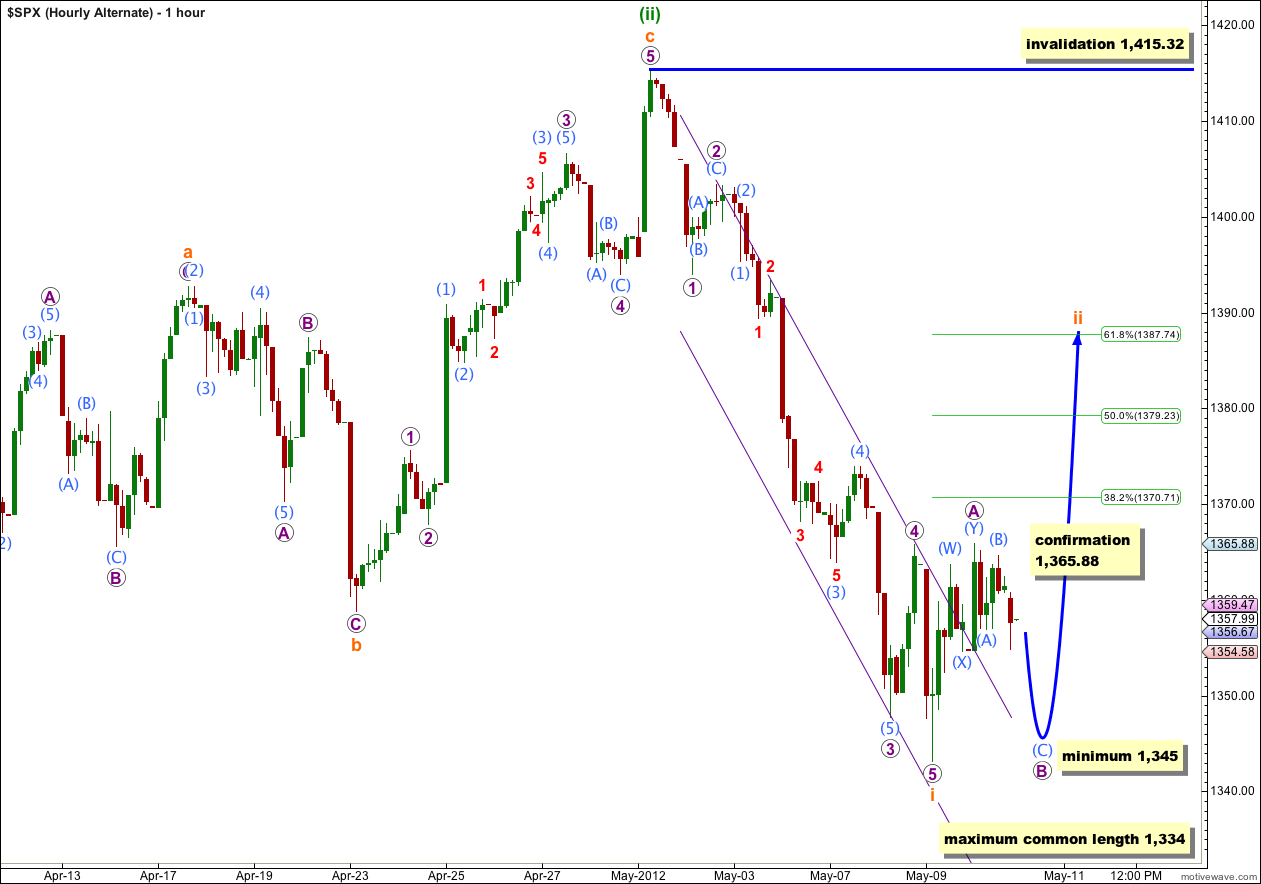
By simply moving the degree of labeling within wave ii orange down one degree we may have only seen wave A purple within a flat correction for wave ii orange.
Wave A within a flat must subdivide into a “three” and a double zigzag is correctly termed a “three”.
Within a flat the B wave must reach at least 90% of the A wave. Wave B purple must reach down to 1,345 at minimum.
The most common length for a B wave in relation to the A wave of a flat is 100% to 138%. Wave B purple would reach 138% the length of wave A purple at 1,334. If price moves below this point then the probability of this wave count reduces significantly.
When wave B purple is complete then a target for wave C purple to complete wave ii orange may be calculated. At this stage for this alternate we should simply expect wave ii orange to reach up to the 0.618 Fibonacci ratio of wave i orange at 1,387.74.
This wave count only has a slightly lower probability than the alternate. Unfortunately, because within a flat the B wave may make a new price low beyond the start of the A wave, there is no downside price point to differentiate our two hourly wave counts. The only thing that will clarify which one is correct is the structure of the next movement down: the main count expects an impulse and this alternate expects a three wave structure.
Both our main and alternate wave counts expect downwards movement to a minimum of 1,345 tomorrow.