
Last analysis expected price to move downwards for both the main and alternate wave counts. Price has moved lower to start the session, and then has bounced upwards for a small correction.
We still have two wave counts. The price point which differentiates them is now extremely close by. We may have clarity after tomorrow’s session.
Click on the charts below to enlarge.
I am switching the main and alternate wave counts back. This is because, despite the Dow invalidating its equivalent to the S&P 500’s main wave count, this wave count for the S&P 500 still has the higher probability for this market.
Main Wave Count.
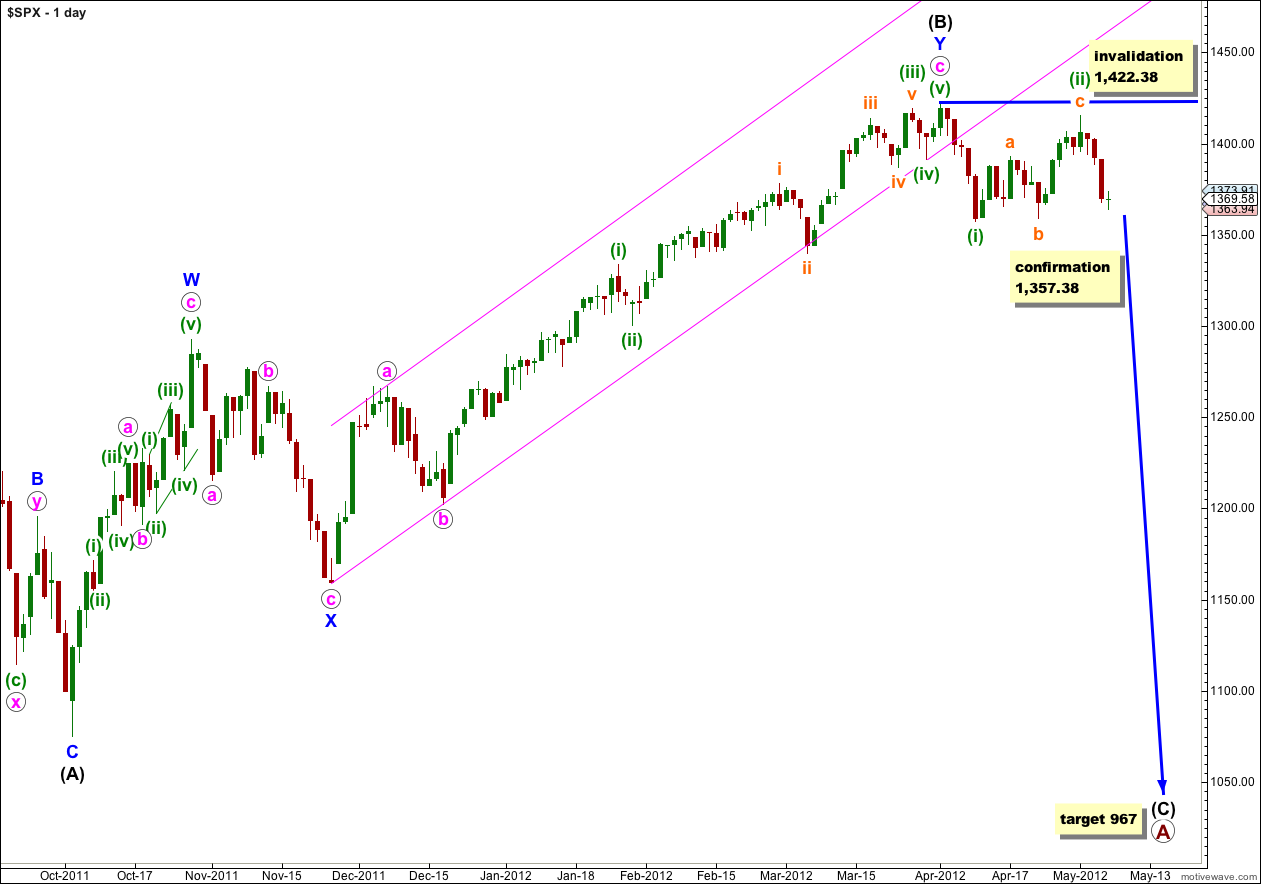
We may be seeing the start of a low degree third wave to the downside.
If the huge channel breach of the alternate wave count is an indication of a major trend change then this would be the most likely scenario.
Wave (B) black subdivides most easily into a double zigzag structure. A low degree second wave correction for (ii) green, a regular flat correction, completed last week. Thereafter, wave (iii) green down has begun and should gather momentum.
At primary degree this structure is an expanded flat correction, and wave (B) black was a 123% correction of wave (A) black. Expanded flats normally expect C waves to move substantially beyond the end of the A wave. At 967 wave (C) black would reach 1.618 the length of wave (A) black.
Any further upwards movement of wave (ii) green may not move beyond the start of wave (i) green. This wave count is invalidated with movement above 1,422.38.
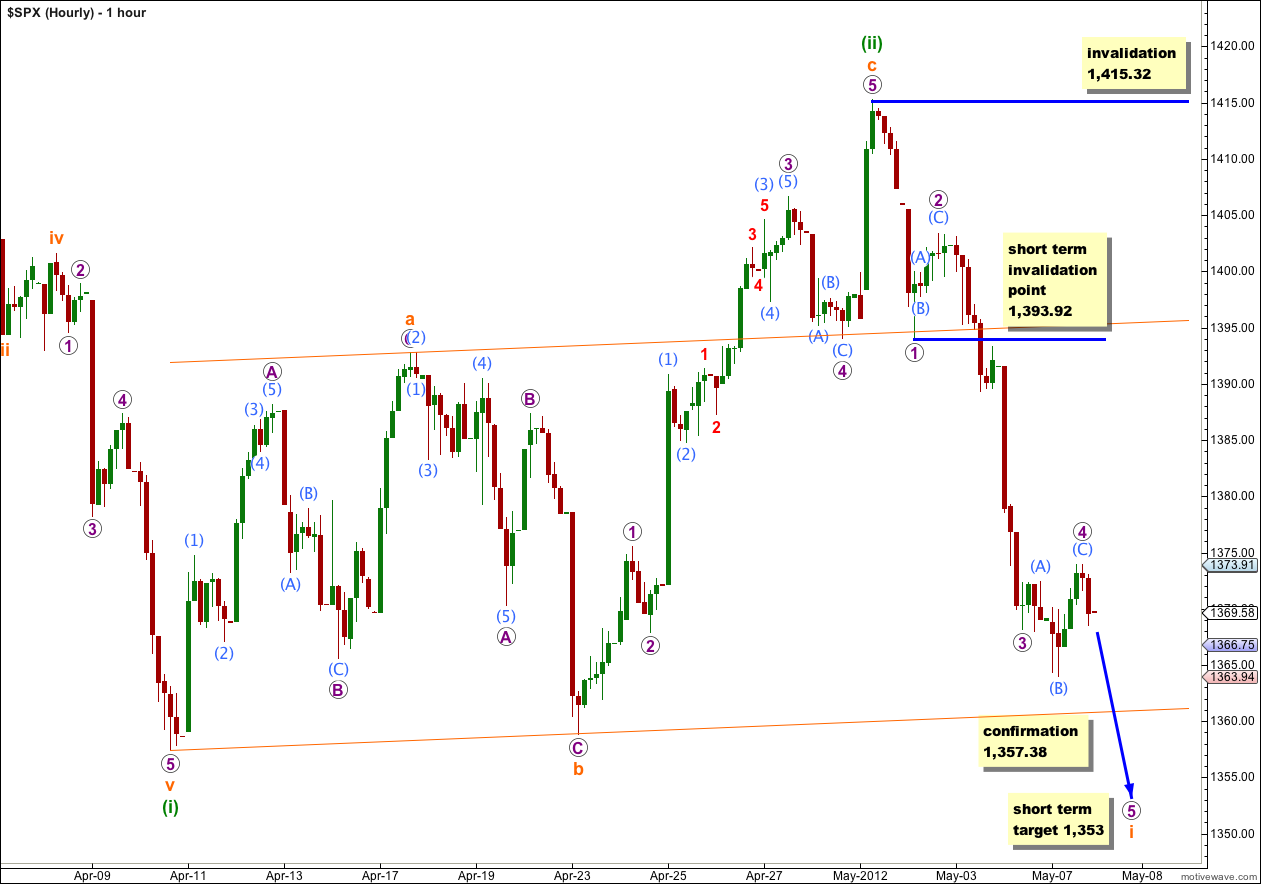
I have relabeled downwards movement to be only subdivisions of wave i orange within wave (iii) green, this has a better look after Monday’s mostly sideways movement.
Within wave i orange wave 3 purple is just 0.62 points longer than 1.618 the length of wave 1 purple.
On the 5 minute chart wave 3 purple subdivides perfectly into a five wave impulse with a very extended third wave.
There is nice alternation between the zigzag for wave 2 purple and a flat for wave 4 purple. Wave 2 purple is a 44% correction of wave 1 purple, and wave 4 purple is a 16% correction of wave 3 purple.
When markets open tomorrow any further extension of wave 4 purple upwards may not move into wave 1 purple price territory. Tomorrow’s short term invalidation point is at 1,393.92.
Tomorrow should see wave 5 purple move lower to breach the orange parallel channel containing wave (ii) green, hopefully confirming this wave count with movement below 1,357.38.
At 1,353 wave 5 purple would reach equality with wave 1 purple.
It is possible however that wave 5 purple may end before 1,357.38 and wave ii orange could begin without this wave count being confirmed. If that happens we would have to wait longer for clarity.
Wave ii orange may not move beyond the start of wave i orange. This wave count is invalidated with movement above 1,415.32.
Alternate Wave Count.
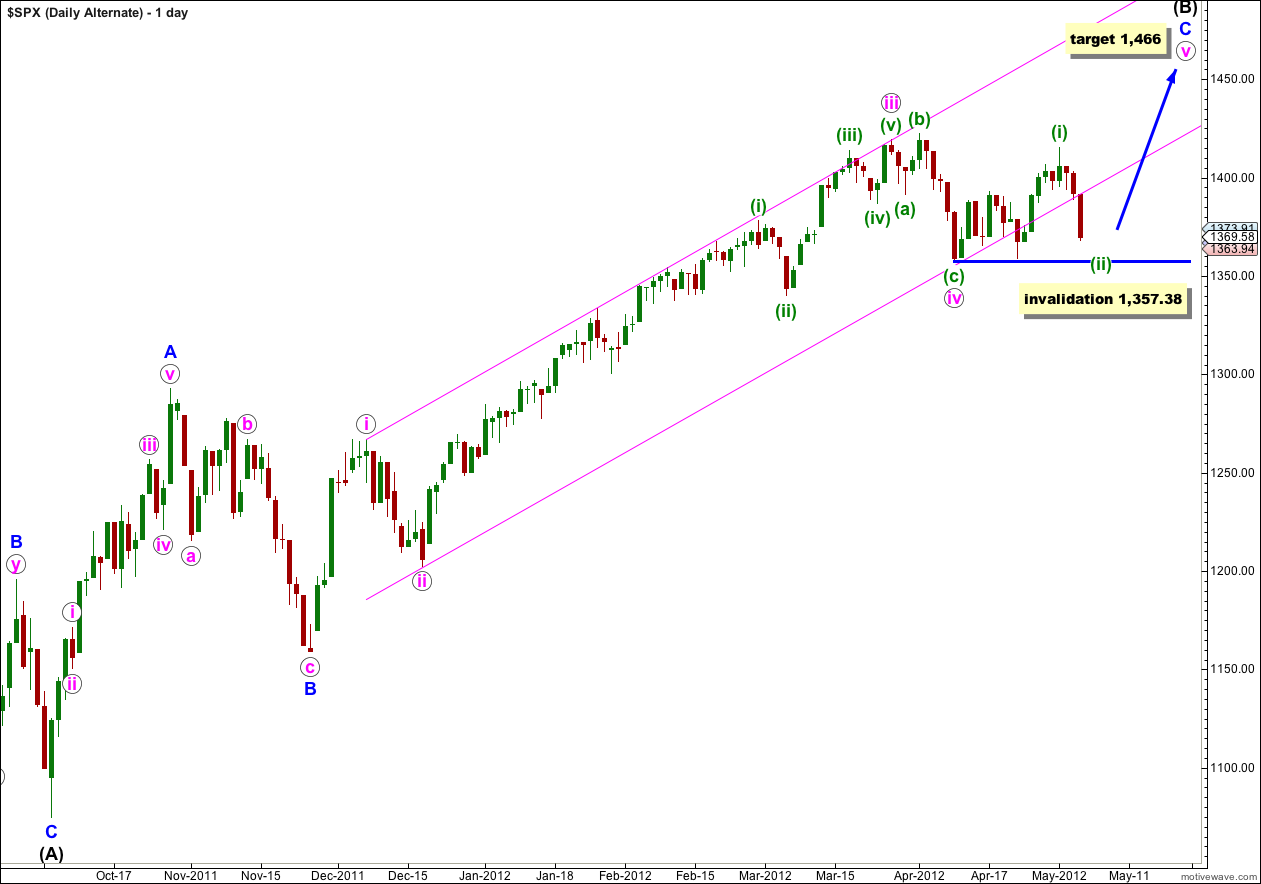
With price remaining below the channel for another session the breach is even more convincing. This reduces the probability of this wave count. If this wave count is wrong it may be invalidated during tomorrow’s session.
Recent movement on the hourly chart supports our main wave count better than this alternate. Subdivisions for this wave count are not as good as for the main wave count on the daily chart.
This wave count expects the S&P 500 is within a final fifth wave upwards to complete a single zigzag correction for wave (B) black.
When wave v pink is complete we shall look out for a big trend change. Movement below 1,357.38 will confirm a big trend change and the start of wave (C) black downwards. This price point will be extremely important for us because while price remains above that point the risk of new highs will remain.
The target of 1,466 is where wave v pink would reach equality with wave i pink, but Wave (B) black would reach its maximum common length, 138% of wave (A) black, at 1,464. It is likely we shall see a trend change before this point.
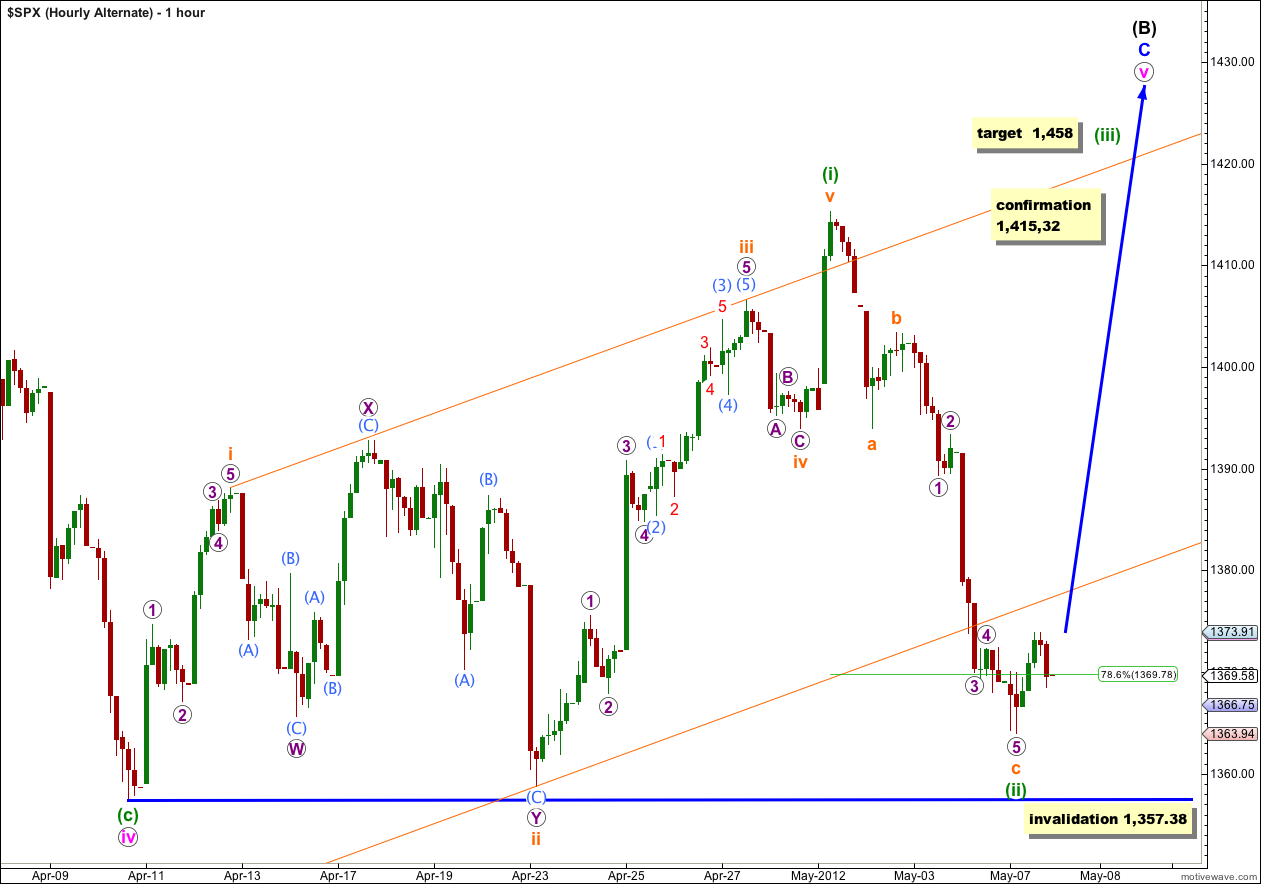
Upwards movement on this hourly chart labeled wave (i) green may be seen as a five wave impulse, but it looks better as a three.
Subsequent downwards movement labeled here wave (ii) green may be seen as a three wave zigzag, but it has a better look (so far) as a five.
This reduces the probability of this alternate and makes our main wave count look more likely.
For this alternate we should see momentum to the upside increase. At 1,458 wave (iii) green would reach 1.618 the length of wave (i) green.
If downwards movement for wave (ii) green continues any further it may not move beyond the start of wave (i) green. This wave count is invalidated with movement below 1,357.38.