
As expected from yesterday’s analysis the S&P 500 moved a little higher for Wednesday’s session, as price bounced off the lower edge of the parallel channel on our alternate wave count for a small correction.
Price has found resistance at the upper edge of the small parallel channel on the hourly chart.
We still have two daily wave counts, with the main wave count having a higher probability than the alternate. If the parallel channel on the alternate is breached significantly in the next few days we shall discard it and use only one wave count.
Click on the charts below to enlarge.
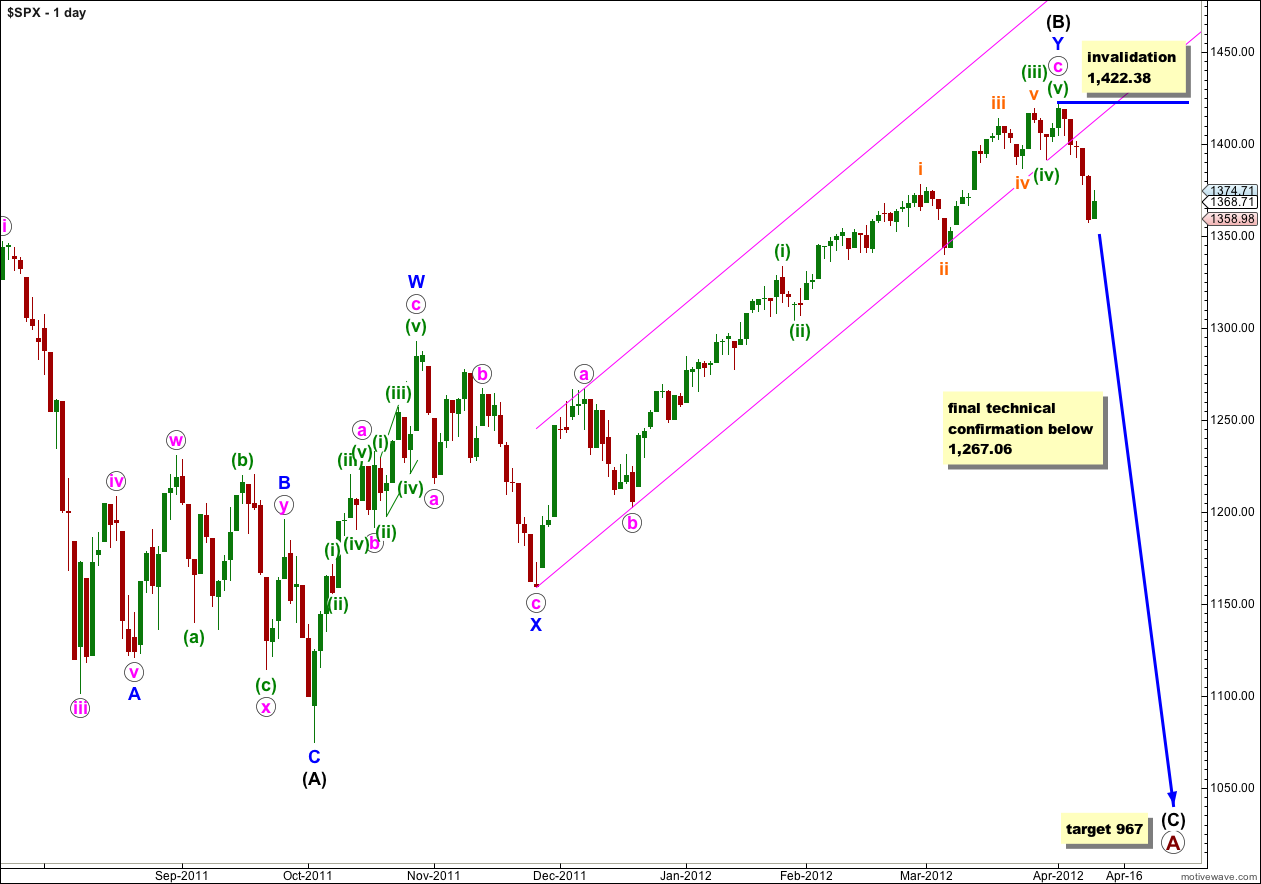
At primary degree wave A would be an expanded flat correction because wave (B) black is a 123% correction of wave (A) black. We would expect wave (C) black to most likely reach 1.618 the length of wave (A) black a 967. If price moves through this first target then the next (less likely) target would be where wave (C) black reaches 2.618 the length of wave (A) black at 685.
Within wave (C) black no second wave correction may move beyond the start of its first wave. This wave count is clearly invalidated with any movement above 1,422.38.
This wave count has a typical look for wave c pink. The third wave is extended which is most common, and its subdivisions can be seen clearly on the daily chart which should be expected. It agrees with MACD in that within wave c pink the strongest reading is for the third wave.
Wave (B) black is a double zigzag structure which is a common structure. Within the first zigzag labeled W blue the subdivisions fit most neatly as a zigzag.
If the channel on the daily chart for the alternate wave count below is breached then we may have significantly increased confidence in this wave count. Movement below 1,267.06 would finally and technically confirm a large trend change.
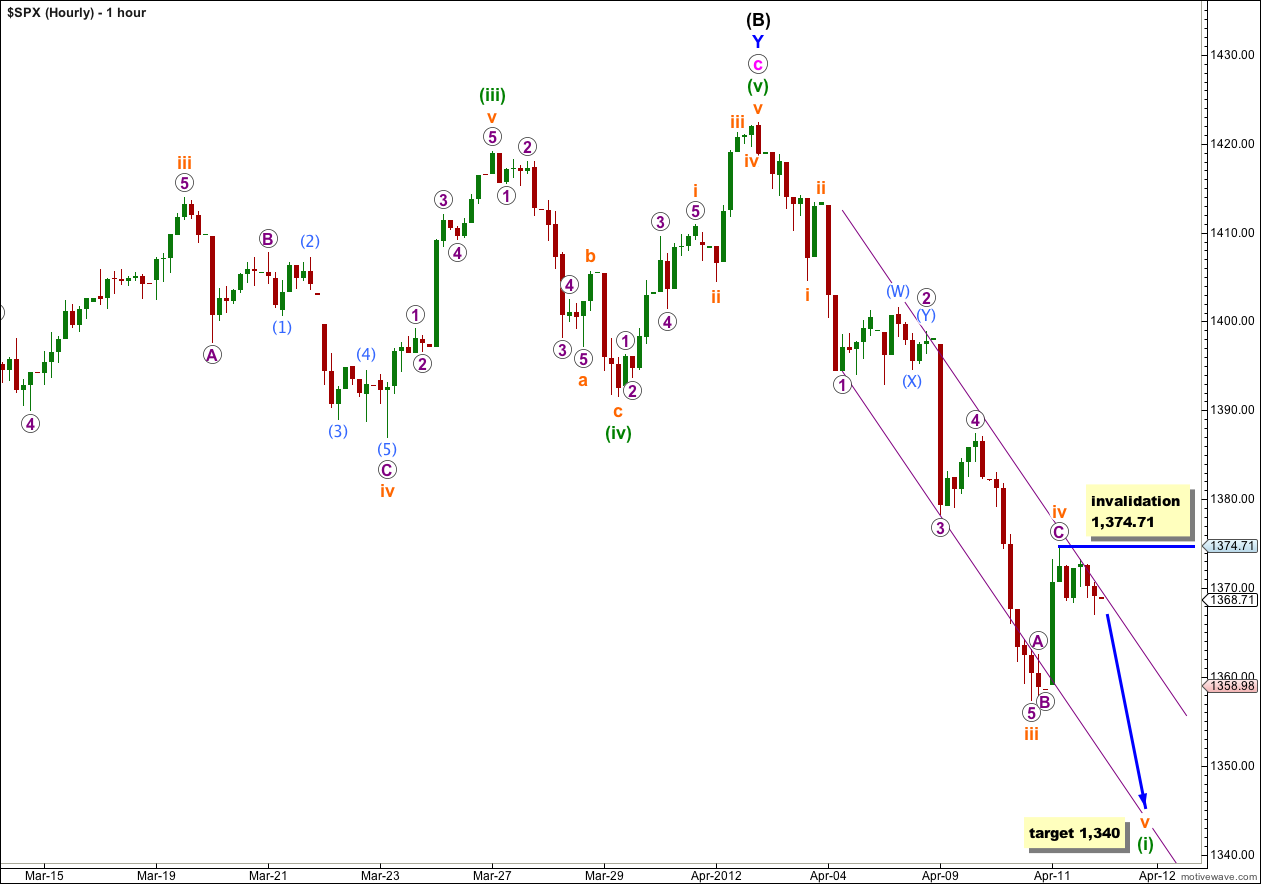
On the 5 minute chart wave iv orange subdivides into a perfect zigzag. Wave C purple is just 0.65 points short of 4.236 the length of wave A purple. With price reaching the upper edge of the parallel channel to find resistance, wave iv orange may be over here. It is nicely in proportion to wave ii orange and this whole structure has a typical look.
The most likely next direction tomorrow would be downwards.
At 1,340 wave v orange would reach 0.618 the length of wave iii orange. Were wave v orange to only reach equality with wave i orange price would end about the same level as the end of wave iii orange, so a longer fifth wave is more likely.
Within wave v orange no second wave correction may move beyond the start of its first wave. This wave count is invalidated with movement above 1,374.71.
Alternate Hourly Wave Count.
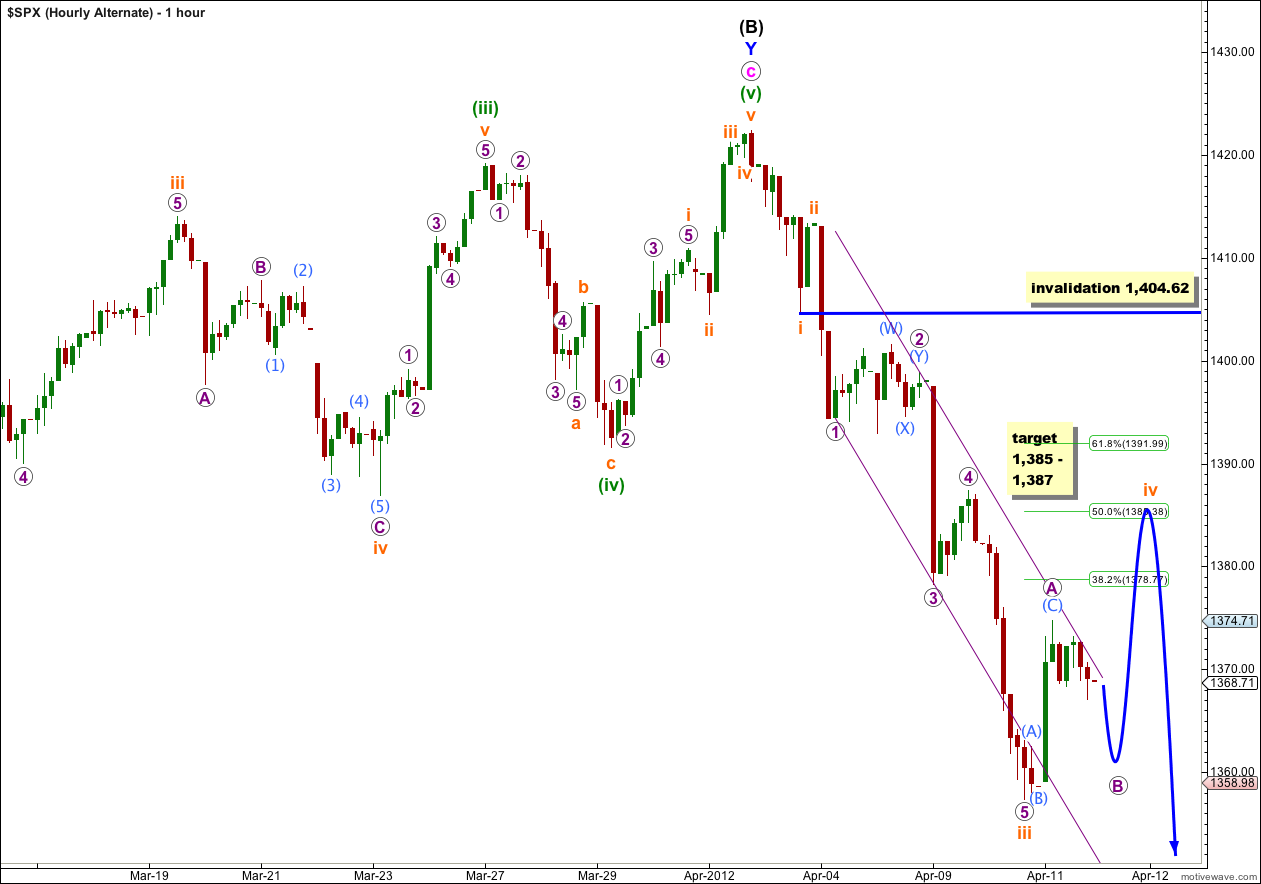
Alternately, if we move the degree of labeling within wave iv orange down one degree we may have only seen wave A purple (or wave W of the first of two zigzags) complete. Wave B purple would need to move lower to reach 1,359 and be 90% the length of wave A purple (or wave X could be over already).
Thereafter, wave C purple (or wave Y, the second of a double zigzag) may take price higher towards our target at 1,385 – 1,387, about the fourth wave of one lesser degree, and just over the 50% level of wave iii orange.
If this wave count is correct wave iv orange would be out of proportion to wave ii orange. This is possible, but the proportionality makes this wave count have a lower probability than the main hourly wave count.
If wave iv orange is a flat correction then wave B purple may make a new low below the start of wave A purple at 1,357.38, and unfortunately there is no lower price point which differentiates this alternate from the main hourly wave count.
To the upside, if price makes a new high above 1,374.71 then the main hourly wave count would be invalidated and this alternate would be correct.
Alternate Daily Wave Count.
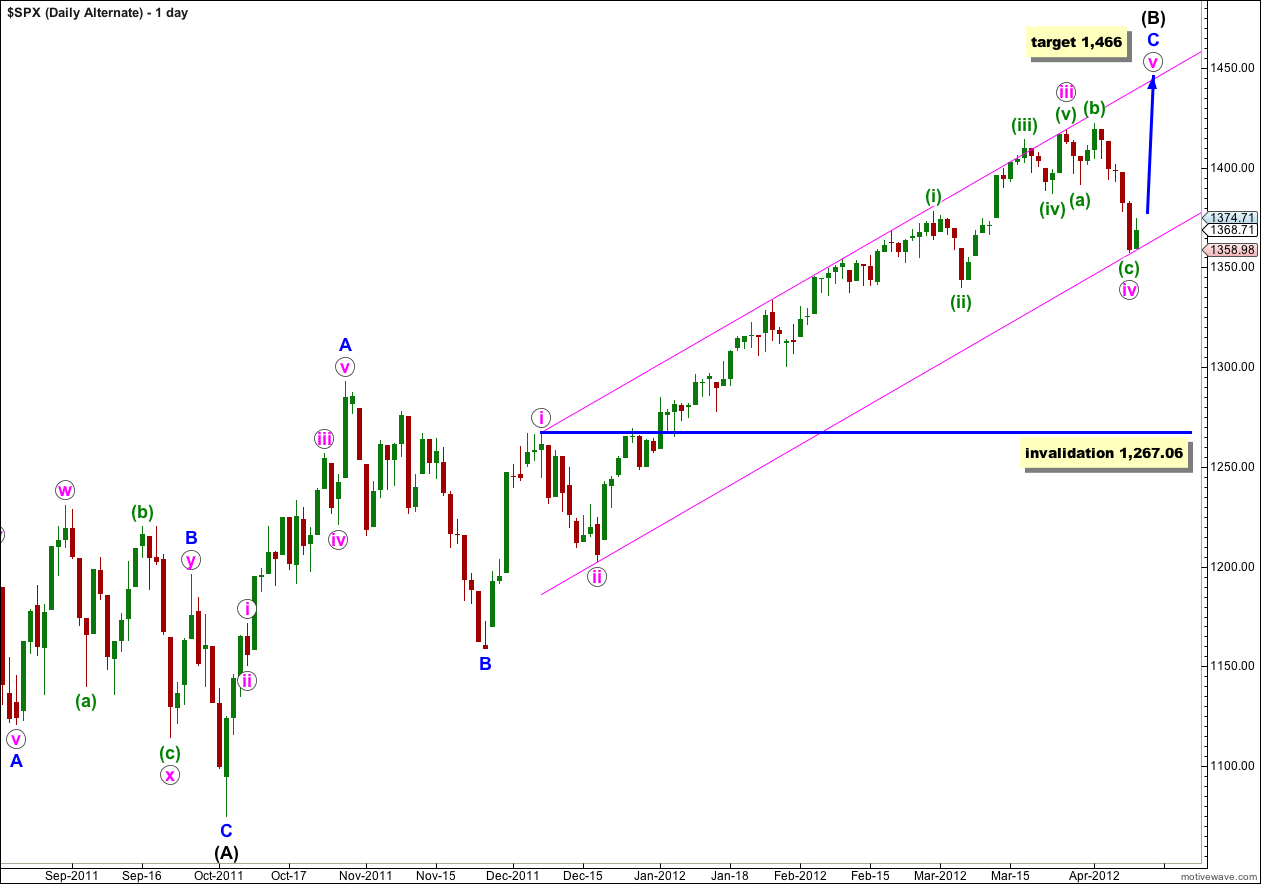
If the upwards wave labeled A blue here subdivides into a five then wave (B) black may be a single zigzag structure. This wave count has a fairly low probability because this wave subdivides most easily into a three, and it is difficult (but possible) to see it as a five. As a five it has a strange looking third wave which reduces the probability of this wave count.
However, we should consider the implications of the parallel channel about wave C blue. This channel has been nicely held to on the upper edge all along this long sustained rise, and until this channel is breached by downwards movement I want us to consider the possibility that we may yet see a final fifth wave up to new highs.
Within wave iv pink wave (c) green is now almost perfectly 1.618 the length of wave (a) green. Wave (b) green was a 112% correction of wave (a) green, and this is a very typical expanded flat correction, so far.
At 1,466 wave v pink would reach equality with wave i pink. Wave (B) black would be almost 138% the length of wave (A) black, the maximum common length for a B wave in relation to an A wave of a flat correction.
If price continues lower tomorrow then the probability of this wave count will reduce. Look out for support about the lower edge of this pink parallel channel.
Wave iv pink may not move into wave i pink price territory. This wave count is invalidated with movement below 1,267.06. However, in practice I would discard this wave count before price gets that low, as a strong and significant breach of the parallel channel containing wave C blue would reduce the probability of this wave count.
Hello Lara,
Just wanted to tell you again how valuable your alternate counts are; you do not just present one “Set in stone” scenario. This is a very tricky, manipulated market and the invalidation points are additional helpful indicators of probable direction.
Thanks,
Gene
Thanks Gene!
Some traders don’t like the use of alternates, wanting Elliott wave analysis to provide one wave count which is always correct. But this is impossible and unrealistic.
The correct way to use EW analysis is with as many alternates as possible, but I’m trying to keep the number of charts for members manageable. In this way I hope to keep you prepared for whatever the market does.
I’m pleased members get this and it works for you.