
Elliott Wave chart analysis for the S&P 500 for 14th November, 2011. Please click on the charts below to enlarge.
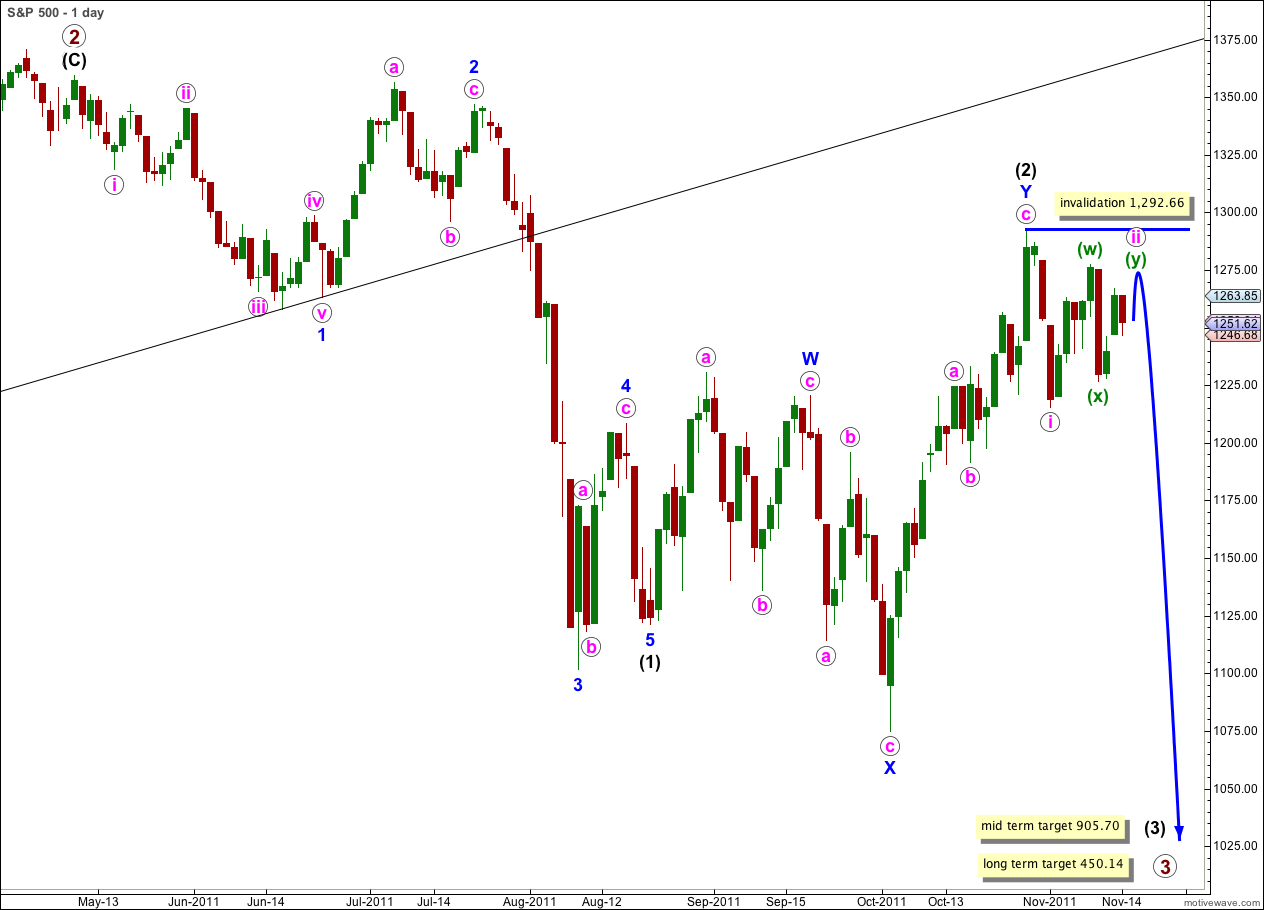
Last analysis expected price to move higher but it moved lower for all of Monday’s session. We should still expect to see one final upwards thrust before wave iii pink begins.
When this second structure within wave ii pink is complete then the probability that wave iii pink downwards should follow will be extremely high. Triple combinations are relatively rare structures, and in comparison doubles are relatively common.
Wave ii pink may not move beyond the start of wave i pink. This wave count is invalidated with movement above 1,292.66.
If this wave count is invalidated with movement above 1,292.66 then we may use the alternate below.
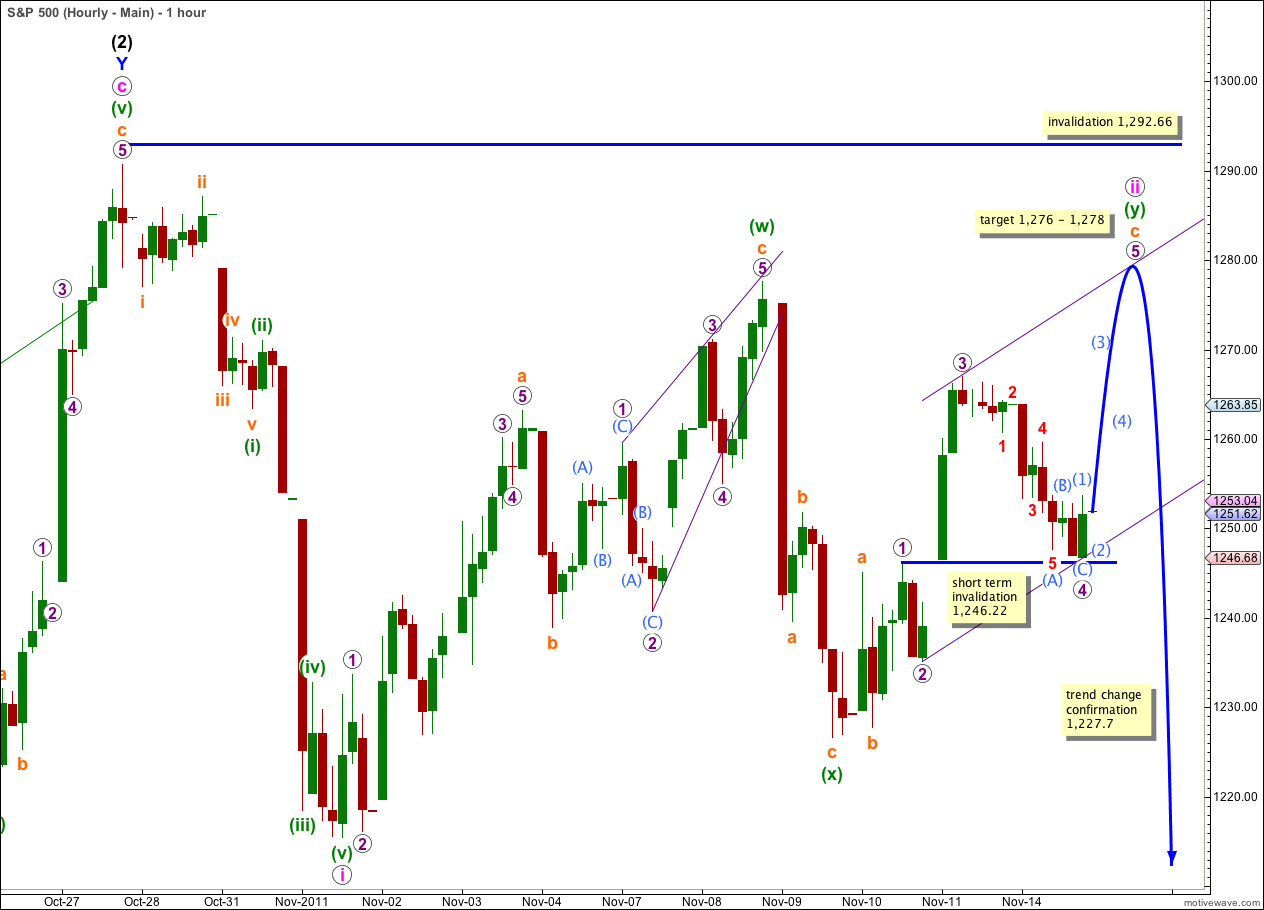
Within wave c orange wave 4 purple extended lower and has remained above the price territory of wave 1 purple.
Wave c orange must subdivide into a five wave structure and only 4 waves can be seen complete.
At 1,278 wave 5 purple would reach equality with wave 3 purple. This price point is very close to where wave c orange would reach 2.618 the length of wave a orange at 1,276 and gives us a 2 point target zone.
Any further downwards movement of wave 4 purple into wave 1 purple price territory (before wave 5 purple upwards is complete) below 1,246.22 would invalidate this wave count. The structure for wave 4 purple is complete on the 5 minute chart.
We should expect one to three more days of upwards movement which is extremely likely to make a new high above the high of wave 3 purple at 1,266.98 to avoid a truncated fifth wave. When wave 5 purple is a complete five wave structure then we should expect a trend change.
We may redraw the parallel channel about wave c orange using Elliott’s second technique. Wave 5 purple may end about the upper edge of this channel.
Thereafter, when the channel is breached by downwards movement, wave 5 purple and wave ii pink in its entirety should be over, and wave iii pink downwards should have begun.
Alternate Wave Count.
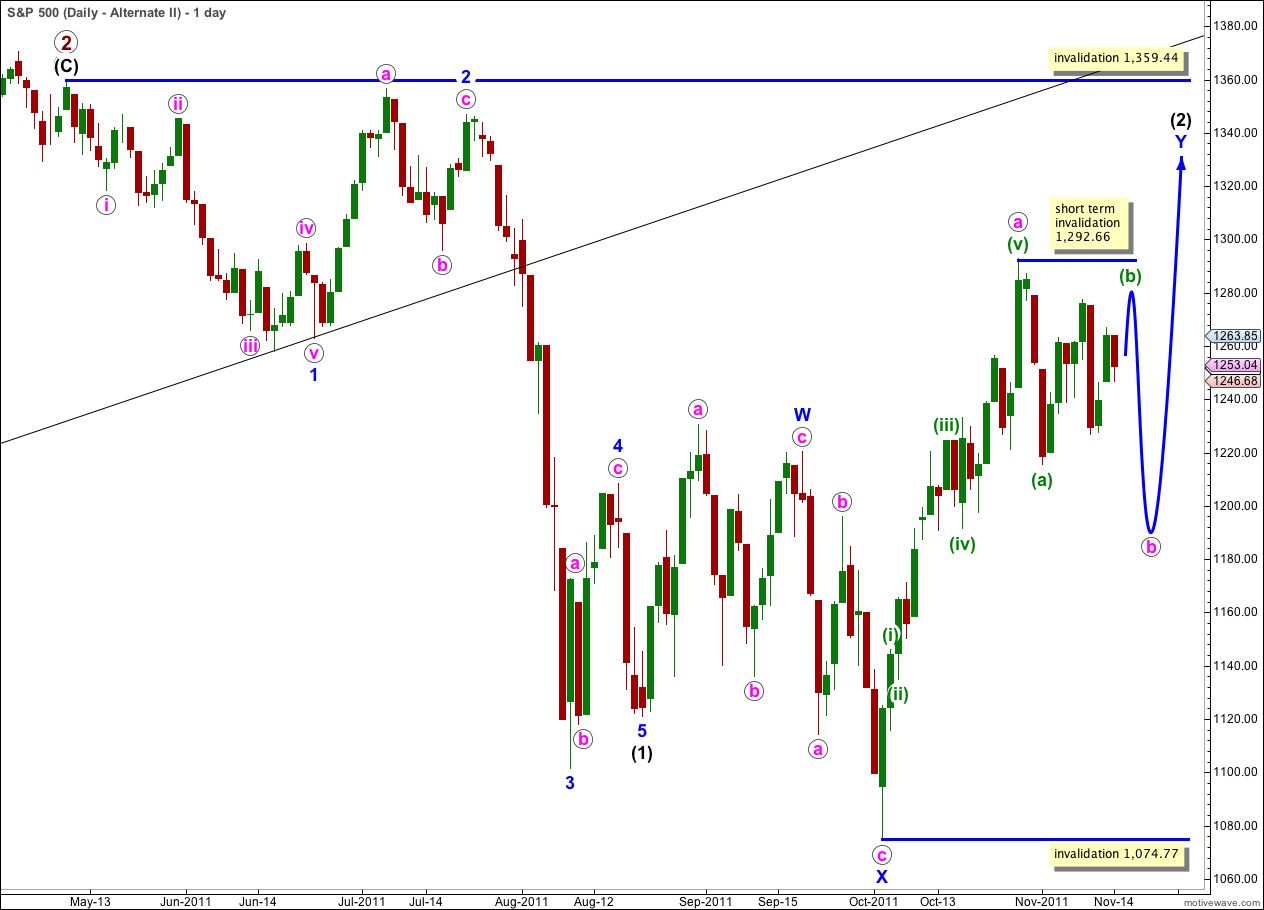
It remains technically possible that wave (2) black is incomplete and we may yet see price move above 1,292.66 in the mid term.
In the short term wave b pink within the zigzag of wave Y blue must complete a three wave structure downwards. This is most likely to make a new low below the end of wave (a) green at 1,215.42 but it does not have to.
Wave (2) black may not move beyond the start of wave (1) black. This wave count is invalidated with movement above 1,359.44.
This wave count does not have as good a look as the main wave count as wave Y blue is significantly out of proportion to wave W blue. However, this only reduces the probability of this wave count and it does not invalidate it.
The subdivisions on the hourly chart are exactly the same as for the main wave count. 1-2-3 and a-b-c have the same subdivisions. The targets and invalidation points are the same.