
Elliott Wave chart analysis for the S&P 500 for 22nd September, 2011. Please click on the charts below to enlarge.
As expected from yesterday’s main hourly wave count and the daily chart, the S&P 500 moved lower during Thursday’s session. Downwards movement is very impulsive and momentum is increasing. Thursday’s down day may be the start of the next “crash” if this wave count is correct.
If downwards movement does not continue with increased momentum then we will consider the alternate idea published yesterday, that this is wave 5 blue to complete wave (1) black. At this stage there is no divergence in the expected direction so I will publish only this one wave count today. I will only consider the alternate idea if it shows itself to be correct.
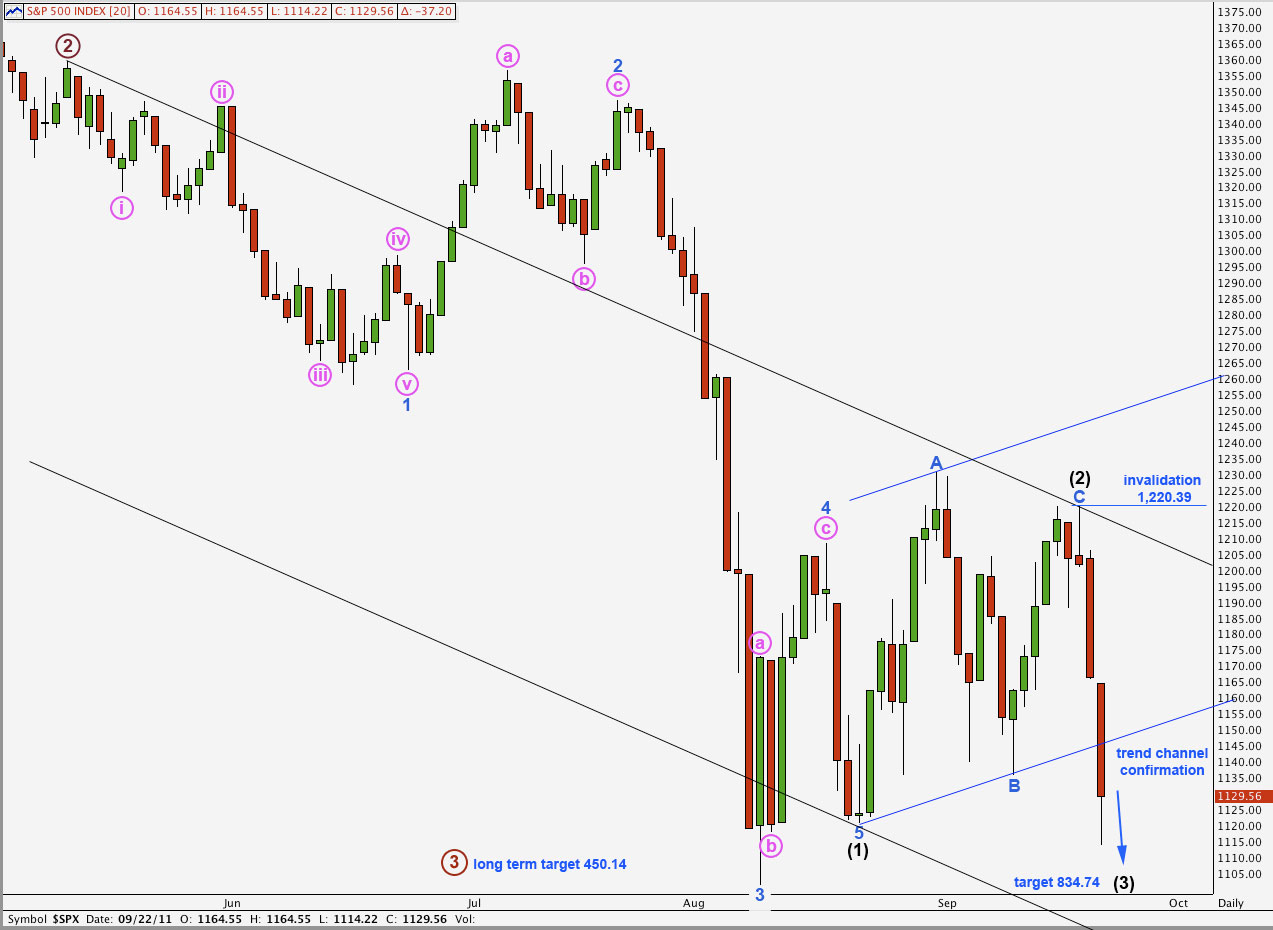
The black trend lines on the daily chart today are a base channel containing wave (1) black. If this is a third wave at the same degree then price should move below this channel. A breach of the lower trend line may be considered further confirmation of our wave count.
The smaller upwards blue channel containing the zigzag for wave (2) black has been breached by downwards movement. Using this channel in the manner Elliott intended confirms that the correction is over and the next wave down, a third wave, has begun.
There is a very slim outlying possibility that wave (2) black is incomplete and may continue as a double zigzag or double combination, with downwards movement a three wave structure for an X wave. The probability is so small I don’t want to chart it, and I don’t think we should seriously consider it at this point. If downwards movement slows and develops a strong three look then we must consider this. Wave (2) black, were it to continue, would be out of proportion to wave (1) black. It has the right look completed here.
Within wave (3) black wave 2 blue may not move beyond the start of wave 1 blue. This wave count is invalidated with movement above 1,220.39.
In reality any correction should find strong resistance at the lower edge of the blue parallel channel containing wave (2) black (sloping upwards). We should expect corrections to tend to be brief and shallow within this third wave of a third wave.
This strong downwards momentum is exactly what we should expect from this third wave. Momentum should increase still further as this unfolds.
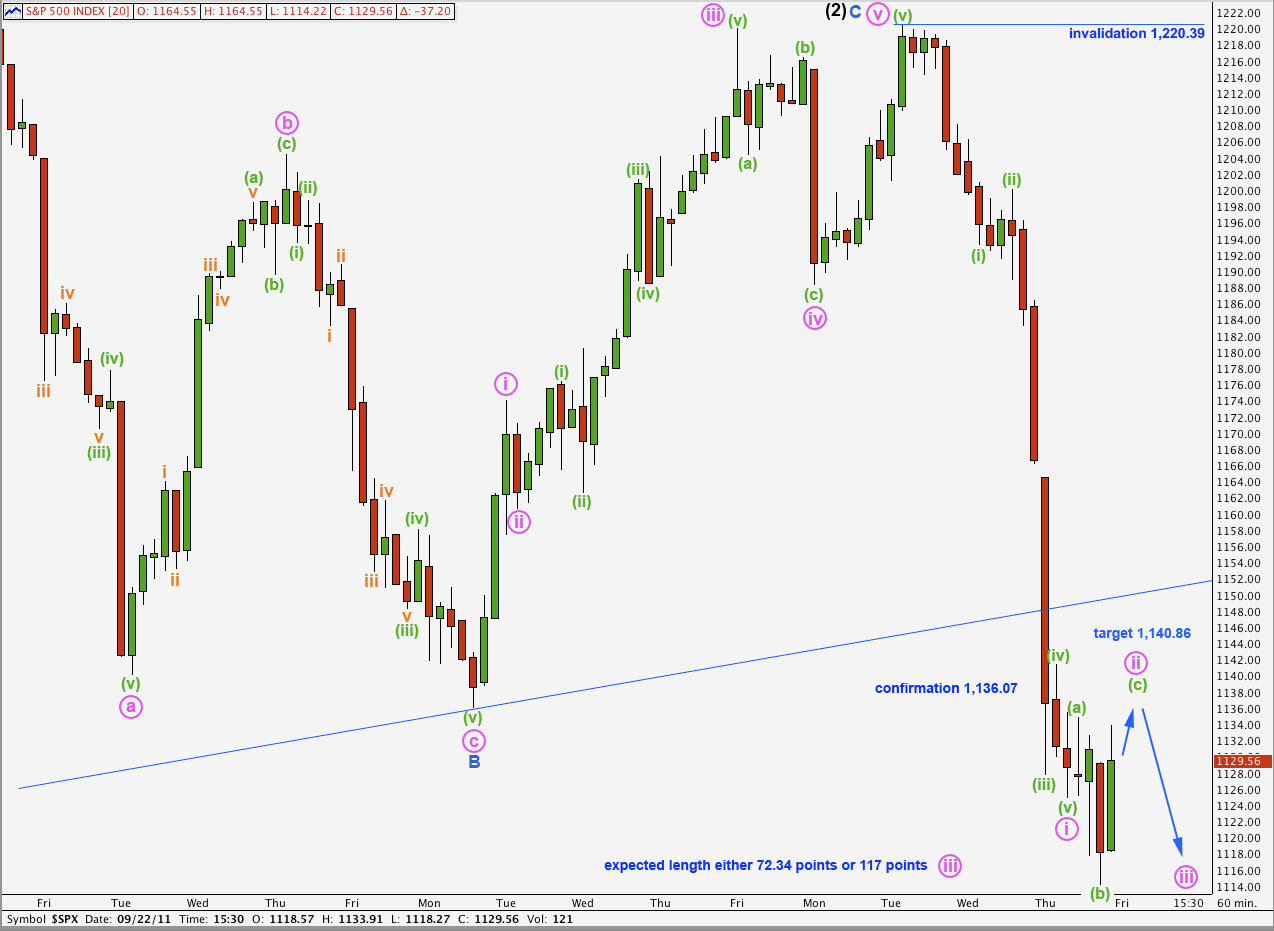
Movement below 1,136.07 has confirmed a trend change.
Ratios within wave i pink are: wave (iii) green is just 2.36 points longer than 2.618 the length of wave (i) green, and wave (v) green is just 0.47 points longer than 0.236 the length of wave (iii) green.
I have determined the ends of waves on a 5 minute chart for this movement.
Wave ii pink may be unfolding as a flat correction. We cannot say that at this stage a running flat is unlikely; there is enough downwards pressure to force a truncation and a running flat here. However, it would still be a bit more likely that this flat may be the more common expanding flat and at 1,140.86 wave (c) green would reach 2.618 the length of wave (a) green.
Wave ii pink may not move beyond the start of wave i pink. This wave count is invalidated with movement above 1,220.39. However, in reality we would expect the lower edge of the parallel channel about wave (2) black to now provide resistance to upwards movement.
I cannot calculate a target for wave iii pink for you because we don’t know where wave ii pink has ended yet. Expect wave iii pink to be at least 72.34 points in length, and probably 117 points in length (either equal with i pink or 1.618 its length).