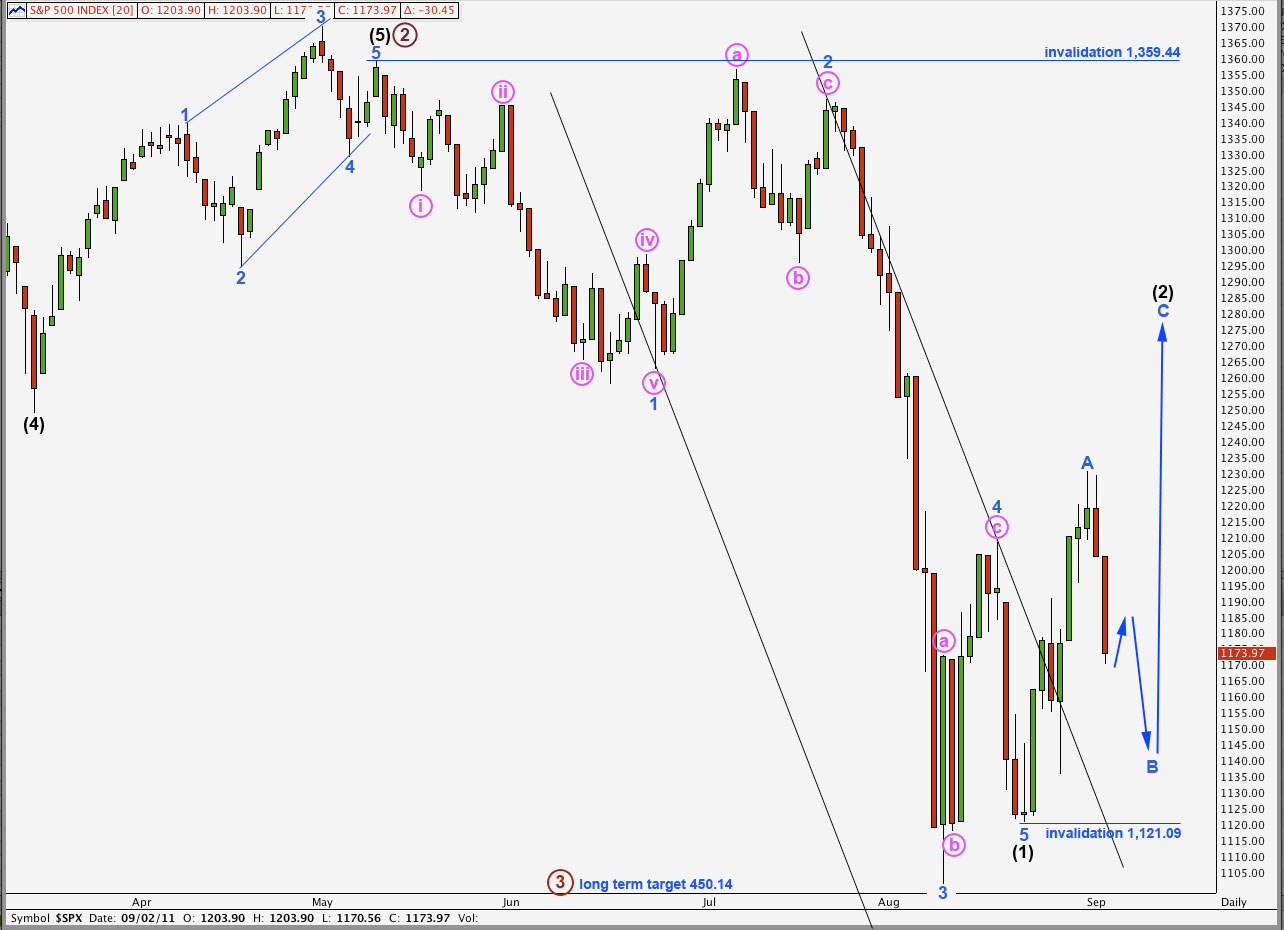
Elliott Wave chart analysis for the S&P 500 for 2nd September, 2011. Please click on the charts below to enlarge.
As our main wave count expected the S&P 500 continued to move lower during Friday’s session.
Wave B blue is incomplete and should unfold as a zigzag. Wave B blue may not move beyond the start of wave A blue. This wave count is invalidated with movement below 1,121.09.
When wave B blue is complete then wave C blue should take price higher to complete this second wave zigzag correction for (2) black. Wave (2) black may not move beyond the start of wave (1) black. This wave count is invalidated with movement above 1,359.44.
When wave (2) black is complete then the S&P 500 should be ready for a spectacular fall for a third wave within a third wave, if I have the degree of labeling for this movement correct.
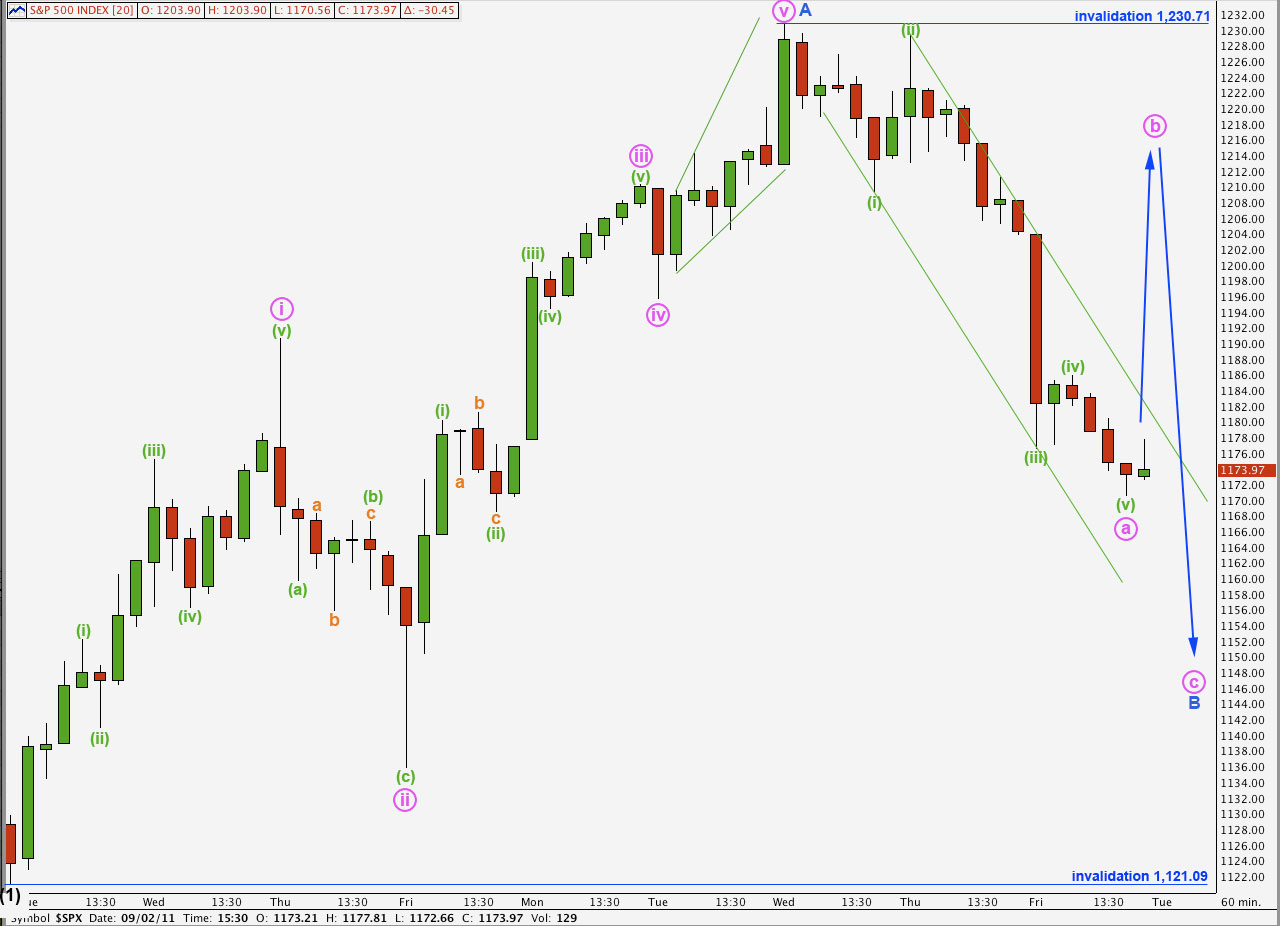
The short term target for wave (iii) green to end was at 1,194.75. Price moved well below this point and wave (iii) green most likely ended at 1,176.55, 18.2 points below the target.
Wave a pink is now a complete five wave structure. Ratios within wave a pink are: wave (iii) green is 3.18 points short of 2.618 the length of wave (i) green, and wave (v) green has no Fibonacci ratio to either of (i) or (iii) green.
Wave (v) green has ended mid way in the channel containing wave a pink impulse.
When this channel is breached by upwards movement then we shall have the end of wave a pink confirmed and know that wave b pink is most likely underway.
Wave b pink may not move beyond the start of wave a pink. In the short term this wave count is invalidated with movement above 1,230.71.
Wave c pink downwards should subdivide into a five, as either an impulse or an ending diagonal. When we know where it starts we may calculate a target for it to end. I may be able to do this for you after Monday’s session.
When wave B blue is complete then we must remove the upper invalidation point and expect upwards movement.
Wave (2) black has probably another one to two weeks before it is complete.


