Elliott Wave chart analysis for the SPX500 for 22nd February, 2011. Please click on the charts below to enlarge.
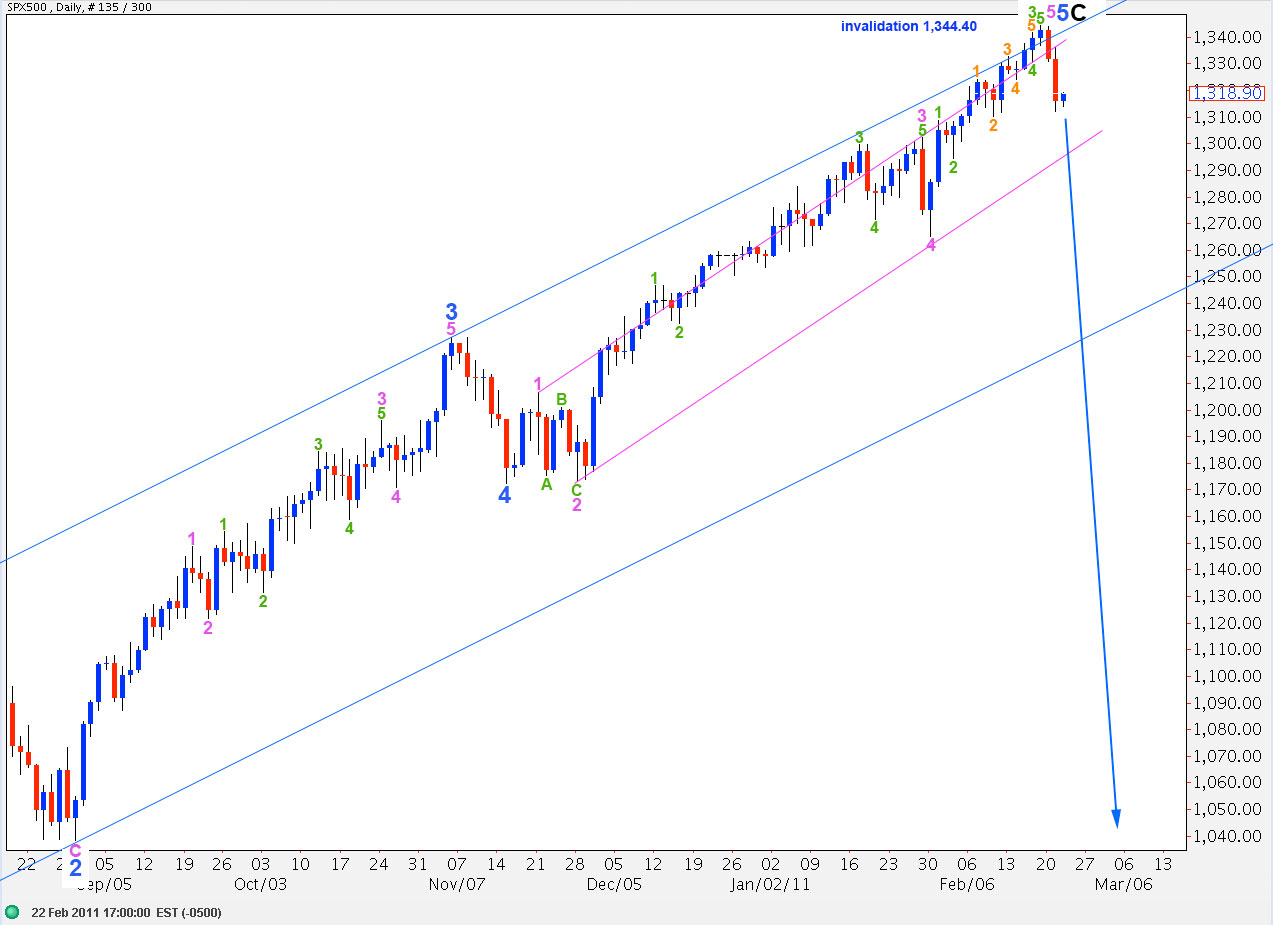
I have only one wave count to present to you today. It sees a high in place.
I have spent considerable time today working on an alternate count which sees further upward movement, but the charts look horrible. The alternate count could be just technically possible but it is too elastic with guidelines and it does not have the “right look” as wave counts should do.
On the other hand, the main wave count is textbook perfect in almost every way.
Wave C black is just 5.5 points short of 0.618 the length of wave A black.
Ratios within wave C black are: wave 3 blue is 8.6 points short of 1.618 the length of wave 1 blue and wave 5 blue is 16.8 points short of equality with wave 3 blue. Considering wave 3 blue is 188.6 points in length and wave 5 blue 171.8 points in length, a 16.8 point difference is not too far off equality. This is the worst wave relationship in this whole wave count. At all other wave degrees the relationships are extremely good.
Ratios within wave 5 blue are: wave 3 pink is 15 points short of 4.236 the length of wave 1 pink an wave 5 pink is just 0.6 points short of 0.618 the length of wave 3 pink.
Ratios within wave 5 pink are: wave 3 green is 2.8 points short of 0.618 the length of wave 1 green and wave 5 green is 3.4 points short of 0.618 the length of wave 3 green.
My alternate wave count sees downward movement as a fourth wave at green degree. Because I would really not want to place the label for wave 1 green anywhere else this alternate wave count would be invalidated with movement below 1,302.9. Therefore, movement below this point would provide us with initial confirmation of a trend change.
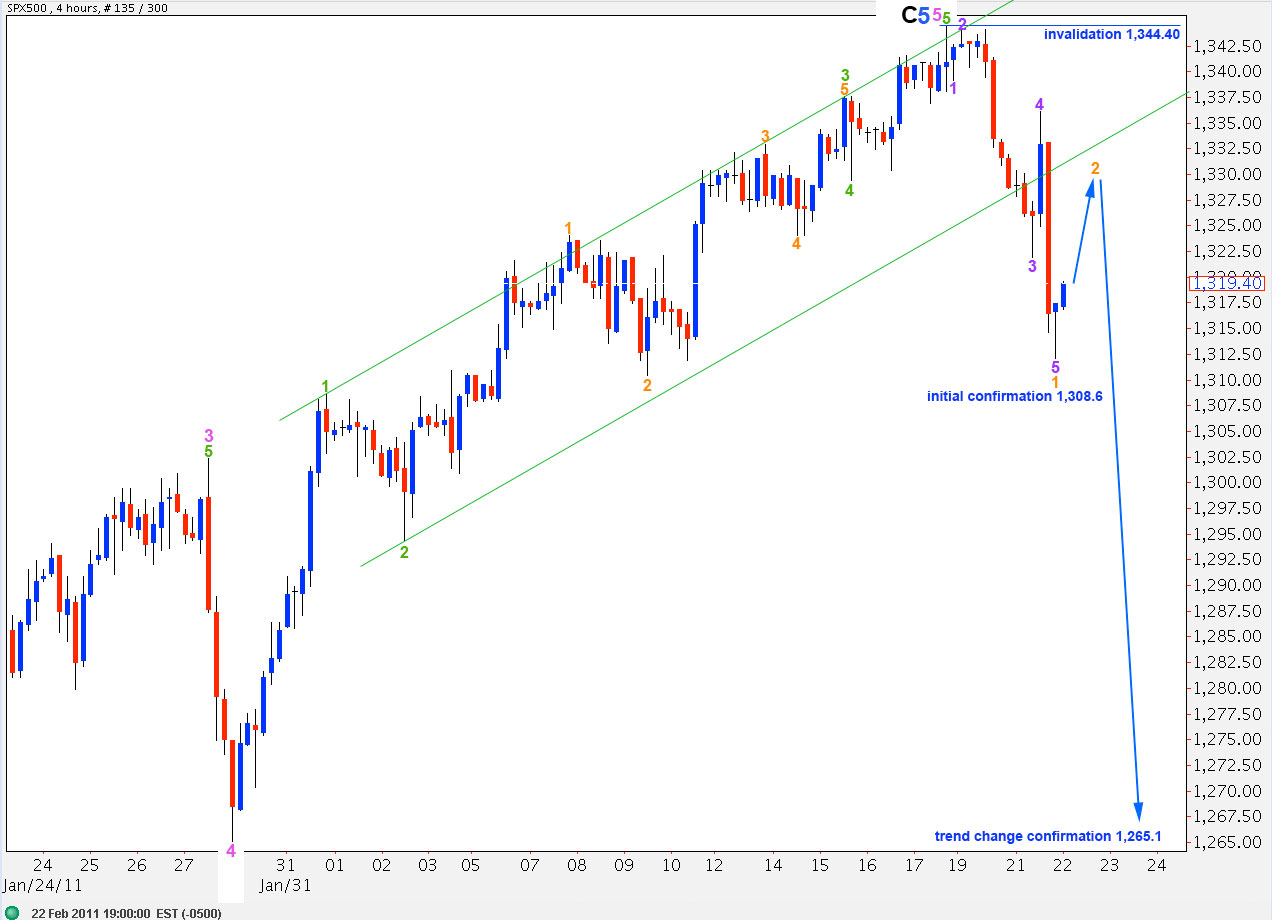
Here is the four hourly chart. Downward movement has very clearly breached the trend channel containing wave 5 pink upward.
Using this simple technique, we may expect that wave 5 pink is over. Therefore, we have had a trend change, at least at minute degree.
Movement below 1,265.1 would invalidate any alternate which saw downward movement as a second wave correction within wave 5 pink because wave 2 may not move beyond the start of wave 1. Therefore, at that point we may have more confidence that we have seen a trend change.
Labeling of the last piece of upward movement has been adjusted. It now has a much better look.
Ratios within wave 5 green are: wave 3 orange is just 0.9 short of 1.618 the length of wave 1 orange and waves 1 and 5 orange are perfectly equal. Wave 2 orange is a deep 87% correction of 1 and wave 4 orange is a shallow 42% correction of 3, achieving the guideline of alternation nicely. This is an almost perfect impulse.
Therefore, the high is at 1,344.4.
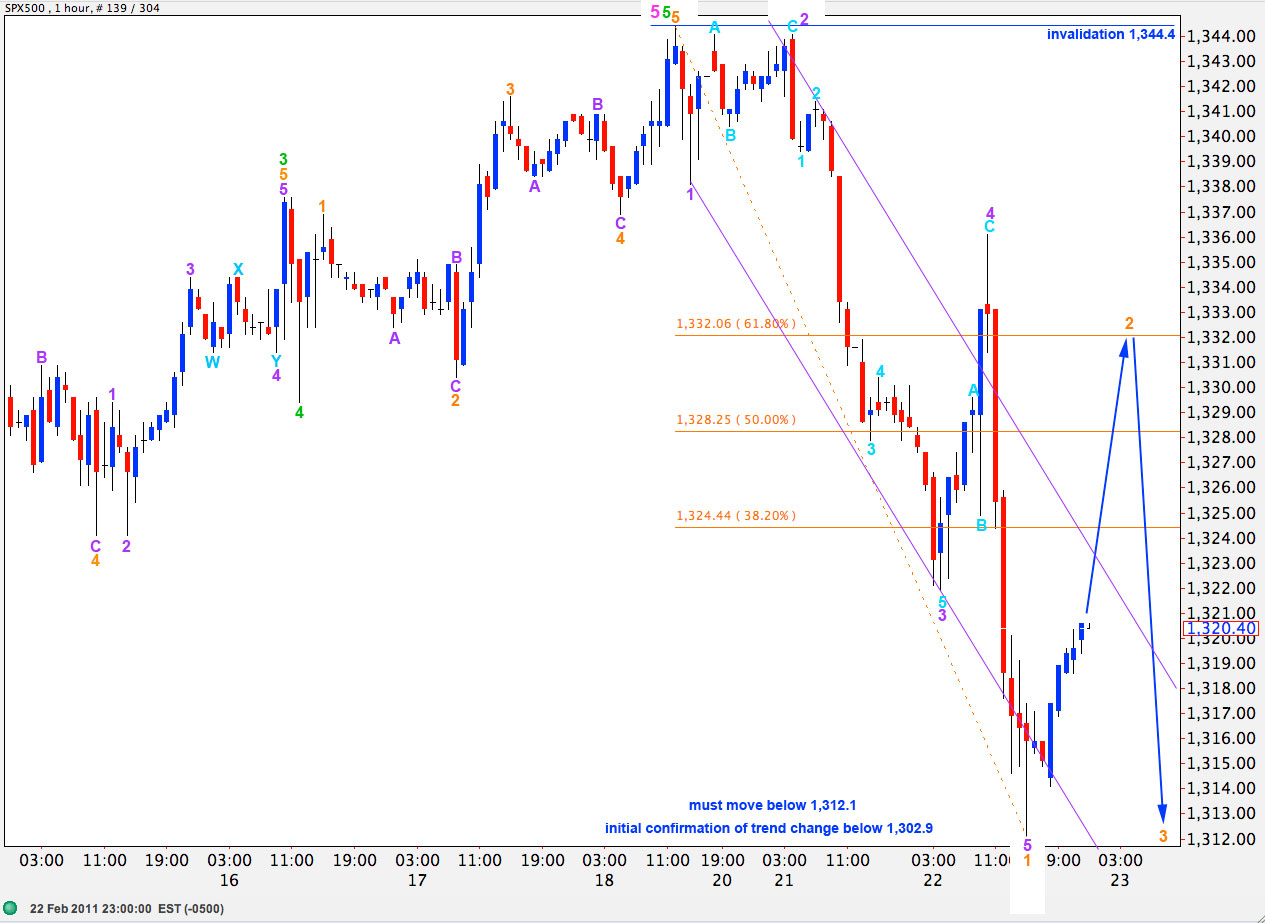
We have a clear five wave impulse downward on the hourly chart now.
Ratios within wave 1 orange are: wave 3 purple has no fibonacci ratio to wave 1 purple and wave 5 purple is 2.7 points short of 4.236 the length of wave 1 purple. Wave 5 purple is also 1.8 points short of equality with wave 3 purple.
This trend channel around wave 1 orange down is also a perfect fit. Wave 4 purple overshot the channel, indicating an overshoot in the opposite direction for wave 5 to end this wave.
When we see this channel breached to the upside we shall have confirmation that the first downward wave is complete and wave 2 orange is then underway. It is most likely that we shall see upward movement breach this channel.
When we have an end to wave A purple and B purple within wave 2 orange then we may calculate an accurate target for wave 2 orange to end. At this stage we may expect, as it is a second wave, to most likely reach up to about the 0.618 fibonacci ratio of wave 1 orange at 1,332.06.
Wave 2 may correct right up to the start of wave 1 orange at 1,344.4 but it may not move beyond this point. Therefore, movement above 1,344.4 would invalidate this wave count.
Wave 3 orange must move beyond the end of wave 1 orange. Therefore, it must take price below 1,312.1.


Thank you Lara!!
It’s hard to believe that the trend change may be upon us after quite a long wait!! Cant wait to see if Fat Finger’s Freddy shows up.
All the BEST,
John
You’re welcome John.
I’m very nervous about calling this trend change at this time. You may notice that up to this point in time I have normally had a main and alternate wave count at each point where it was possible to see a complete upwards wave structure. I am having difficulty developing a decent looking alternate which sees new highs possible at this time however, and I don’t want to publish something that looks like I’ve taken liberties with EW guidelines.
This is such a big trend change, if this is P3 then we’re in for a rough downwards ride. It’s such a big change I’m really nervous about getting it right. I want to see channel breaches to confirm it.
Movement below 1,265.1 would give a high degree of confidence in a trend change. If this really is P3 underway then this point should be breached within a very few days. We should not have to be patient for too long.