Elliott Wave chart analysis for the SPX500 for 6th December, 2010. Please click on the charts below to enlarge.
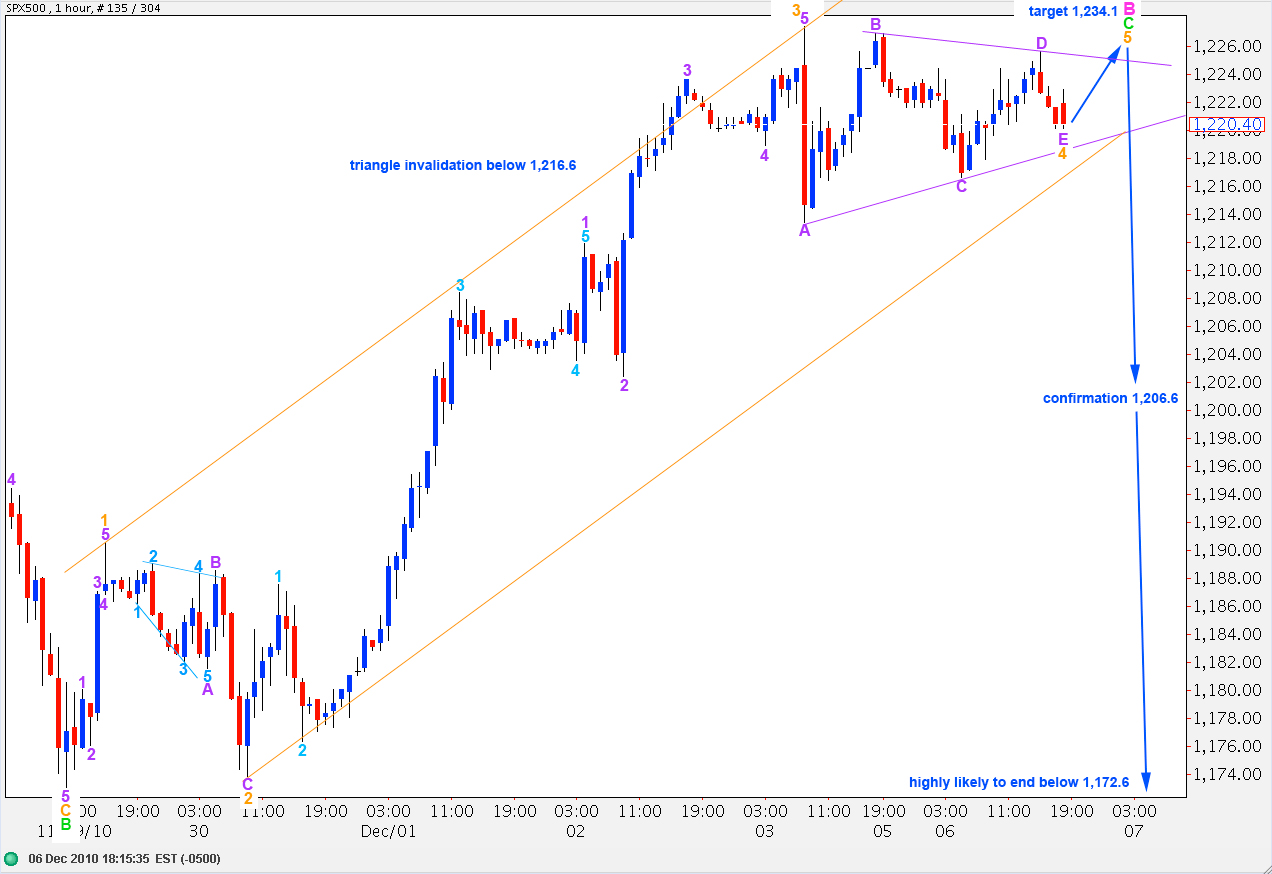
It looks increasingly likely that we will see at least a little movement above 1,227.4 shortly. There seems to be a triangle in a fourth wave position which may have just ended, and so we should expect a short thrust about 14 points to the upside.
When this is over we should see a C wave at pink degree to the downside which is highly likely to end below 1,172.6.
This main daily wave count will be confirmed with movement below 1,206.6.
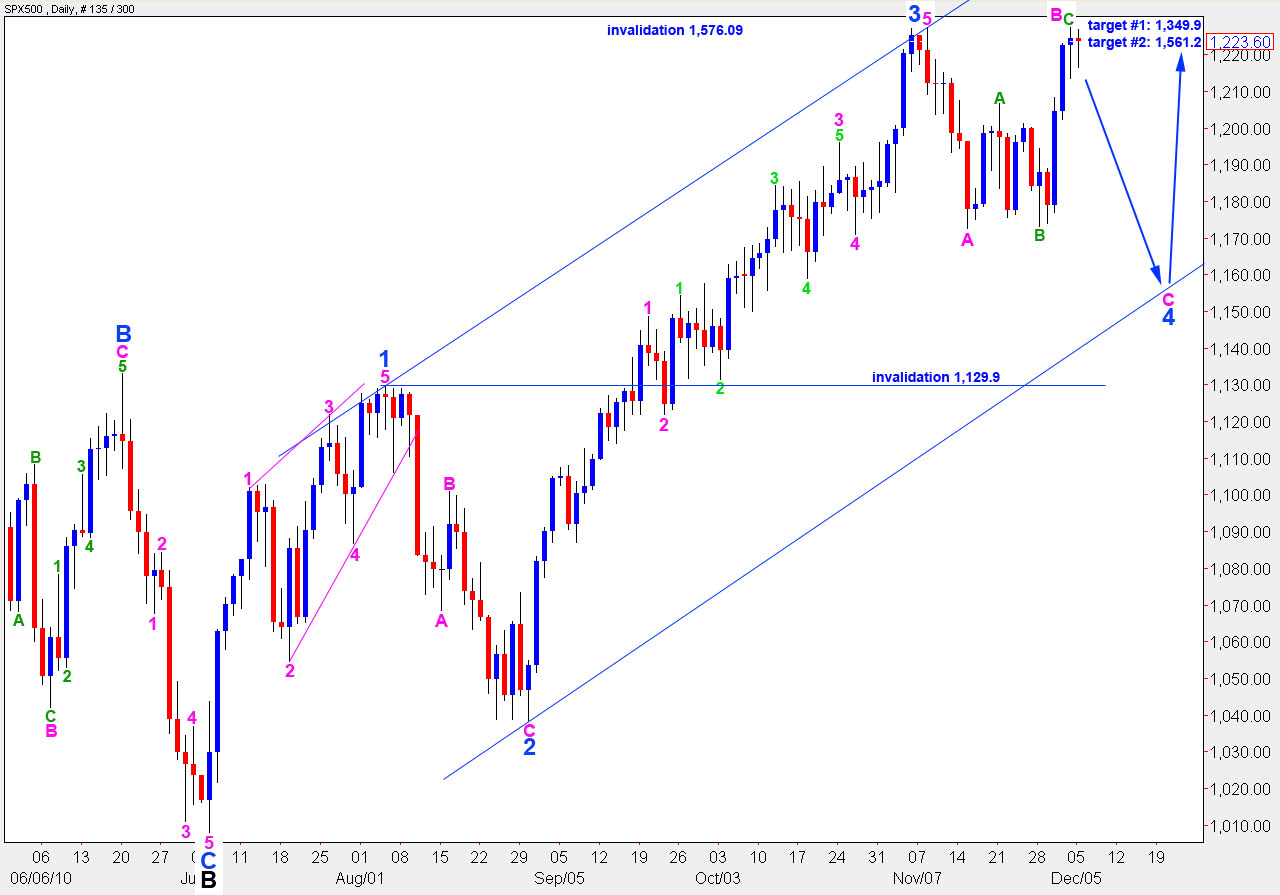
When we have an end to wave B pink then I can calculate a target for the end to wave C pink and, therefore, wave 4 blue for you. At this stage we should expect wave 4 to end about the lower end of the parallel channel containing wave C black to the upside.
Upward targets remain the same. I favour the higher target at 1,561.2 where wave C black will reach equality with wave A black as that is the most common relationship between the two within a zigzag.
Upward movement may not make a new high above 1,576.09.
With the strong looking triangle structure unfolding I have adjusted the wave count. The hourly chart presented yesterday remains valid, but is now looking much less likely. Therefore, I’ll only present this wave count for you today.
Within wave C green ratios are: wave 3 orange is 7.7 points longer than 2.618 the length of wave A orange.
Ratios within wave 3 orange of wave C green are: wave 3 purple is just 2.3 points short of 0.618 the length of wave 1 purple and wave 5 purple is just 0.4 points longer than 0.382 the length of wave 3 purple. These are remarkably good fibonacci ratios within this impulse, where the extension is the first wave.
Within this fourth wave triangle, if wave E purple ended at 1,220.1 it is just 0.1 short of 0.618 the length of wave D purple. We should expect one of the five waves of a triangle to be 0.618 the length of its predecessor, and none of the others are. We should also expect wave E to either undershoot or overshoot the A-C trend line, and here it has under shot by a small margin. It looks like it has just ended.
If the triangle ended at 1,220.1 then a target to the upside is at 1,234.1 to 1,237.6.
Movement below 1,216.6, if wave E of the triangle extends lower, will invalidate the triangle structure.
When the upwards thrust outside of the triangle is over we should expect the downward trend to resume. At that stage we will be looking for a point of differentiation between this main wave count and the first alternate daily wave count below.
Alternate Wave Count.
This wave count expects exactly the same movement next as described for the main wave count on the hourly chart.
Subsequent downwards movement will differentiate these two wave counts.
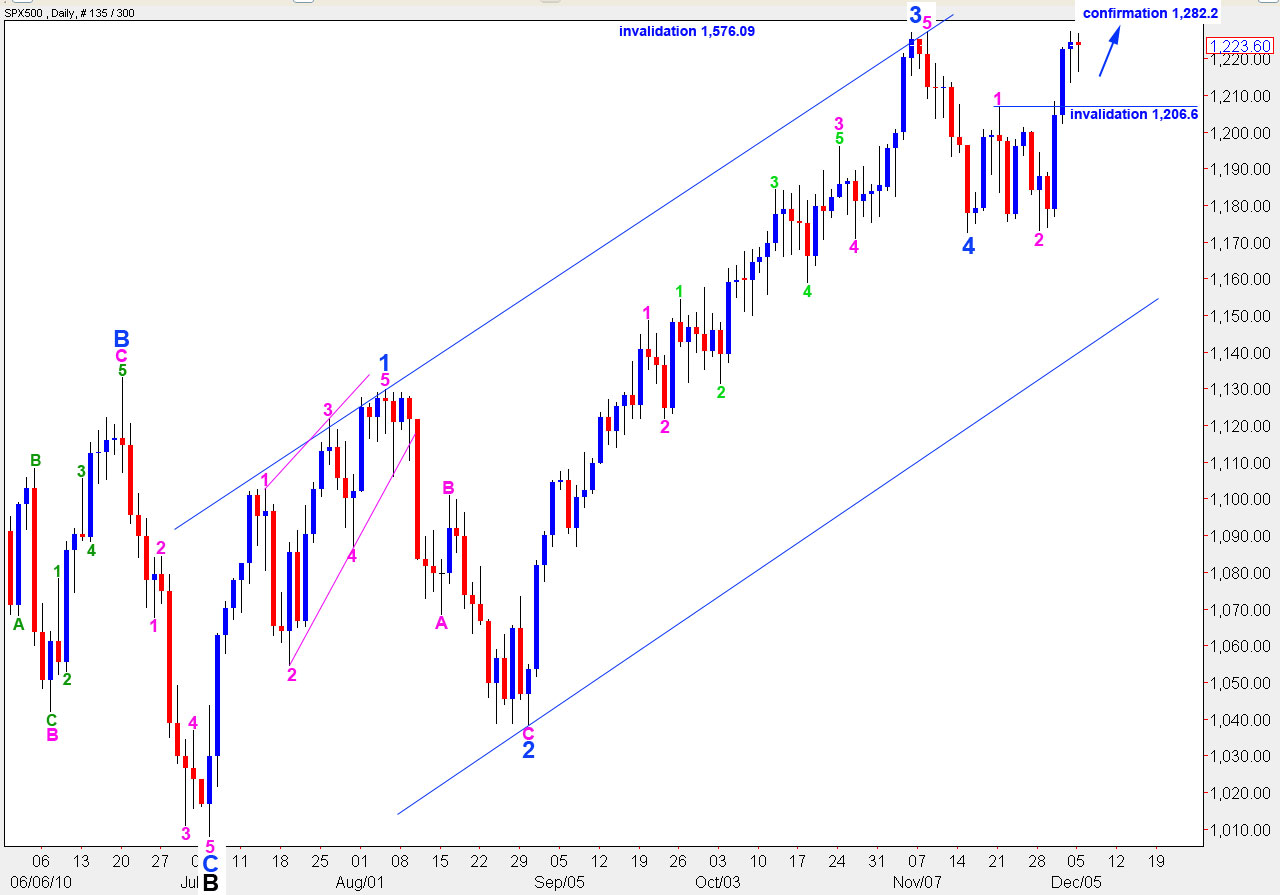
This alternate wave count is invalidated with movement below 1,206.6 as a subsequent wave 4 pink cannot move into wave 1 pink price territory. This is our important point of differentiation between these two wave counts.
If price remains above 1,206.6 for a downward correction, and turns strongly back upward, we shall expect continuing upward movement toward 1,349.9 and more likely to 1,561.2 to end this wave C at intermediate degree, and, therefore, end primary wave 2.
Alternate Daily Wave Count.
If analysis of the hourly chart is correct then this wave count will be invalidated very soon.
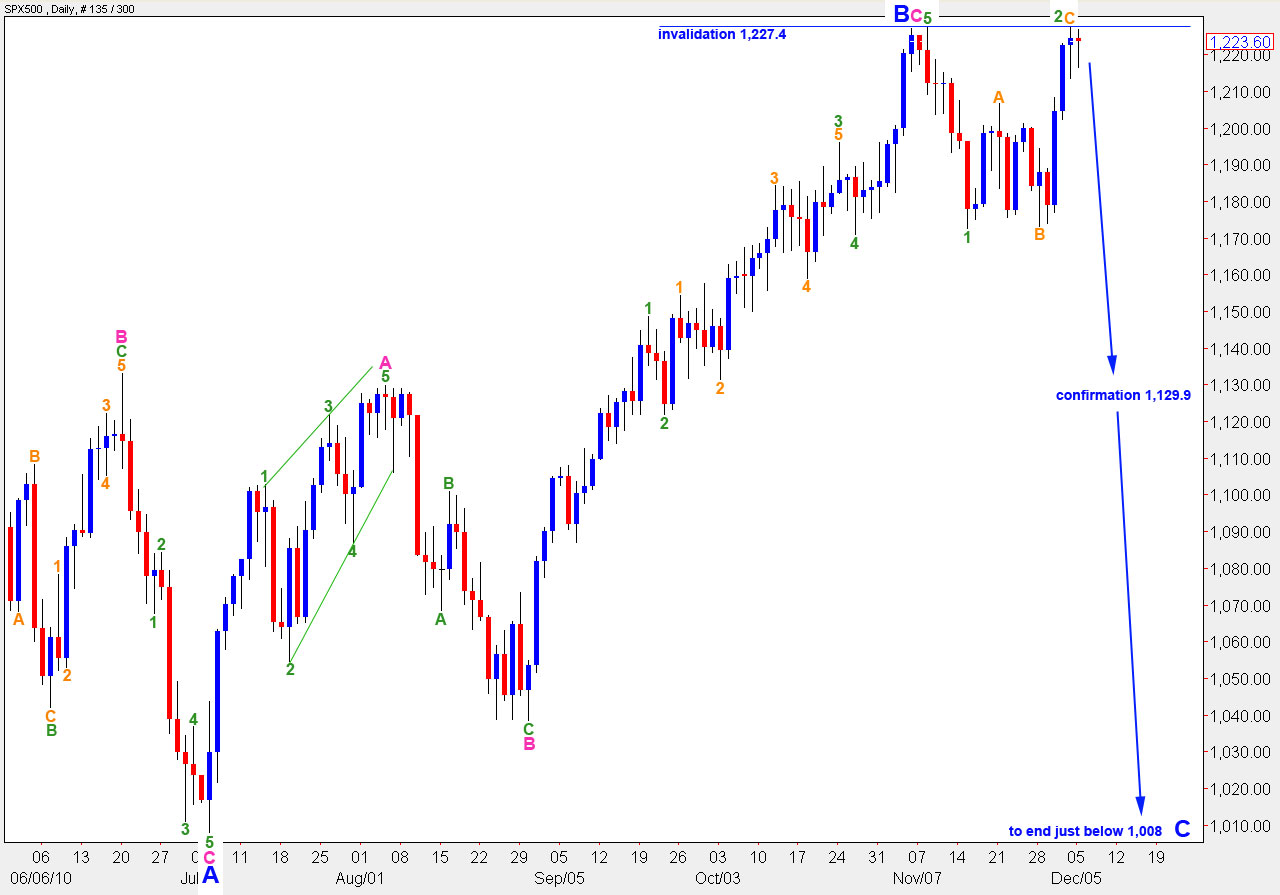
This alternate wave count expects wave B black is still unfolding as a regular flat correction within primary wave 2.
Wave B blue was 103% the length of wave A blue. Therefore, this structure is a regular flat correction and wave C blue is most likely to end just beyond the end of wave A blue, just below 1,008.
If the main wave count is invalidated with movement below 1,129.9 this alternate wave count will be correct. At that stage we may expect there is a very high probability of downward movement continuing and ending only below 1,008.
Wave 2 green may not move beyond the end of wave 1 green. Therefore, this wave count is invalidated with movement above 1,227.4.


