
S&P 500: Elliott Wave and Technical Analysis | Charts – July 15, 2021
Yesterday’s analysis warned members that downwards movement for this session may end about 4,353.83. A downwards session found a low at 4,340.70.
Summary: The primary trend remains up. Pullbacks are a normal and to be expected part of a bull market.
Targets for the Elliott wave count: mid term 4,922 and long term 5,468.
Three scenarios for the short term (in order of probability) are:
1 – The pullback is over at today’s low.
2 – The pullback may continue lower to about 4,329.22.
3 – The consolidation may be deeper and longer lasting, continuing for another two weeks or so to about 4,235.51 or 4,137.65.
There is still a cluster of bearish signals from the AD line and inverted VIX that should now be noted. The market may be increasingly vulnerable to a stronger or deeper pullback coming soon.
Risk management advice: Only the most experienced traders should attempt to trade against the larger trend. Others would best see corrections as buying opportunities when price is close to or at support. The trend is your friend.
The biggest picture, Grand Super Cycle analysis, is here.
Monthly charts are last updated here with video here.
MAIN ELLIOTT WAVE COUNT
WEEKLY CHART
Click chart to enlarge.
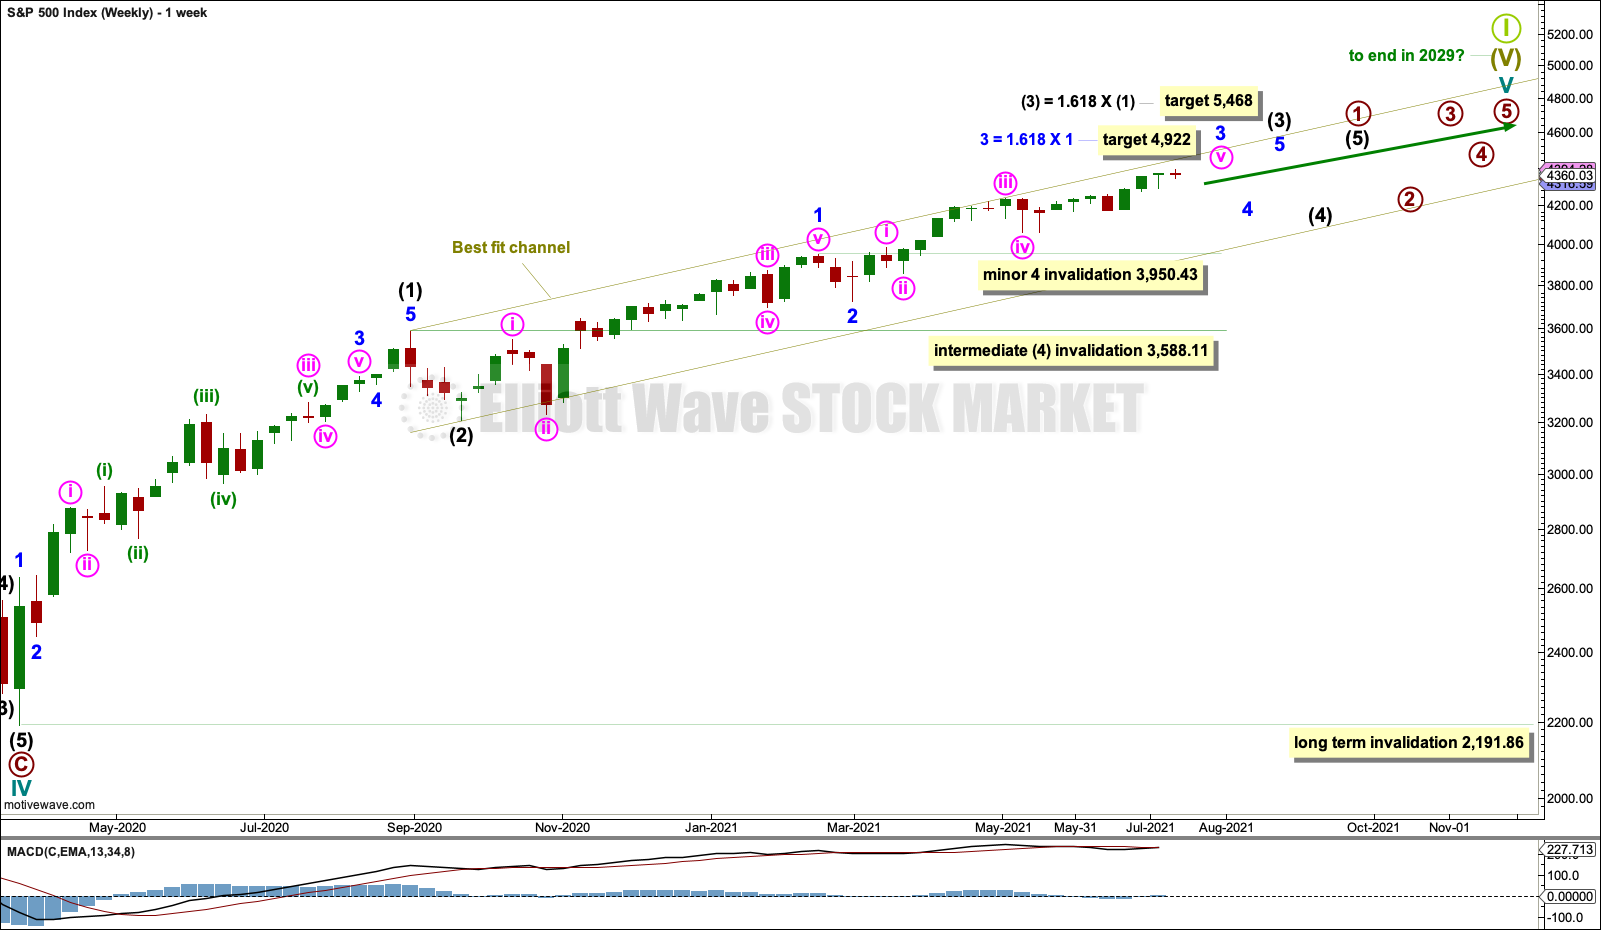
Cycle wave V may last from one to several years. So far it is in its sixteenth month.
This wave count may allow time for the AD line to diverge from price as price makes final highs before the end of the bull market. The AD line most commonly diverges a minimum of 4 months prior to the end of a bull market. A longer divergence is positively correlated with a deeper bear market. A shorter divergence is positively correlated with a more shallow bear market. With zero divergence at this stage, if a surprise bear market does develop here, then it would likely be shallow.
A longer divergence between price and the AD line would be expected towards the end of Grand Super Cycle wave I.
It is possible that cycle wave V may continue until 2029, if the 2020s mirror the 1920s. Either March or October 2029 may be likely months for the bull market to end.
Cycle wave V would most likely subdivide as an impulse. But if overlapping develops, then an ending diagonal should be considered. This chart considers the more common impulse.
There is already a Fibonacci ratio between cycle waves I and III within Super Cycle wave (V). The S&P500 often exhibits a Fibonacci ratio between two of its actionary waves but rarely between all three; it is less likely that cycle wave V would exhibit a Fibonacci ratio. The target for Super Cycle wave (V) to end would best be calculated at primary degree, but that cannot be done until all of primary waves 1, 2, 3 and 4 are complete.
Primary wave 1 within cycle wave V may be incomplete. This gives a very bullish wave count, expecting a long duration for cycle wave V which has not yet passed its middle strongest portion.
Within primary wave 1: Intermediate waves (1) and (2) may be complete, and intermediate wave (3) may now be approaching an end.
A target is calculated for intermediate wave (3) that expects a common Fibonacci ratio to intermediate wave (1).
Intermediate wave (4) may not move into intermediate wave (1) price territory below 3,588.11.
Within intermediate wave (3), minor waves 1 and 2 may be complete. A target is calculated for minor wave 3 to reach a common Fibonacci ratio to minor wave 1. At this stage, minor wave 3 is shorter than minor wave 1. This market has a strong bullish bias and a strong tendency to see extended third waves, so it is likely that minor wave 3 may continue higher.
A best fit channel is drawn about cycle wave V. Draw the first trend line from the end of intermediate wave (1) to the end of minute wave iii within minor wave 3, then place a parallel copy on the end of intermediate wave (2). The channel may need to be redrawn as price continues higher. The channel may show where price may find resistance and support along the way up.
When primary wave 1 may be complete, then a multi-month pullback or consolidation may unfold for primary wave 2. It is possible that primary wave 2 may meet the technical definition of a bear market; it may correct to 20% or more of market value.
Primary wave 2 may not move beyond the start of primary wave 1 below 2,191.86.
DAILY CHART
Click chart to enlarge.
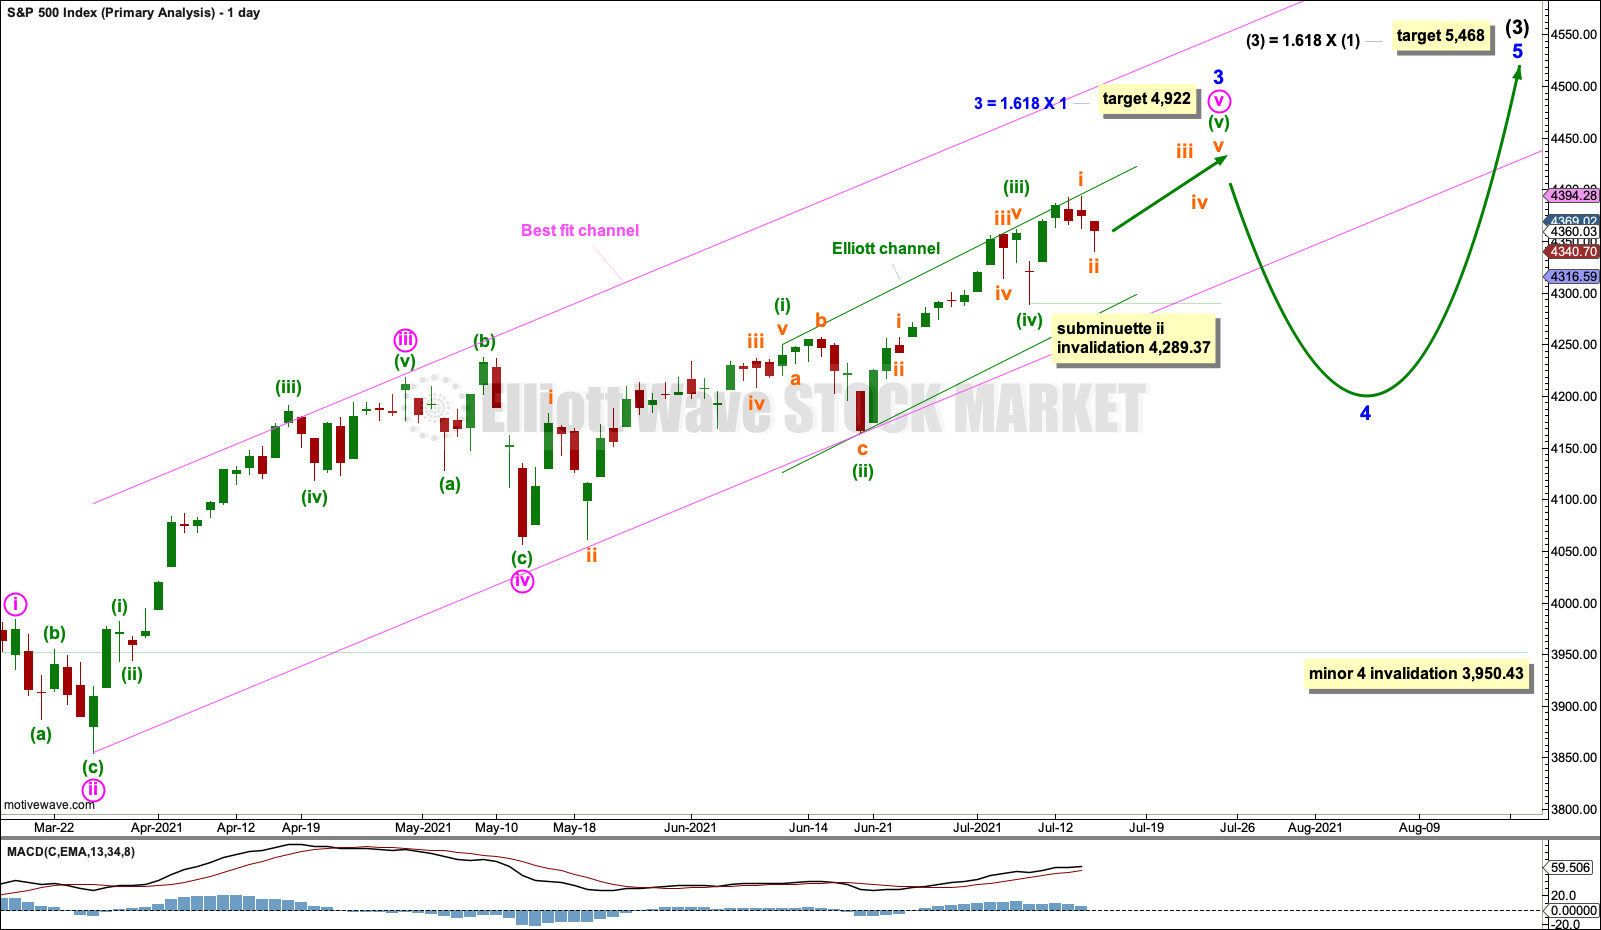
The daily chart focusses on minor wave 3 within intermediate wave (3). This labelling fits with MACD.
Within minor wave 3: Minute waves i, ii, iii and iv may all be complete, and minute wave v may be extending.
Minuette waves (i) through to (iv) within minute wave v may be complete. Minuette wave (ii) is labelled as an expanded flat. Minuette wave (iii) is slightly longer than equality in length with minuette wave (i). Minuette wave (iv) may be complete as a quick sharp zigzag; there is alternation between the flat of minuette wave (ii) and a possible zigzag of minuette wave (iv).
Within minuette wave (v), subminuette wave ii may not move beyond the start of subminuette wave i below 4,289.37.
Draw a best fit channel about minor wave 3. Draw the first trend line from the end of minute wave ii to the low of minuette wave (ii) within minute wave v, then place a parallel copy on the end of minute wave iii. Along the way up, the lower edge of this channel may provide support. Minute wave v may end about the upper edge.
Draw a smaller Elliott channel about minute wave v using Elliott’s first technique. Draw the first trend line from the ends of minuette waves (i) to (iii), then place a parallel copy on the end of minuette wave (ii). If minuette wave (iv) continues lower, then it may find support at the lower edge of this channel.
HOURLY CHART
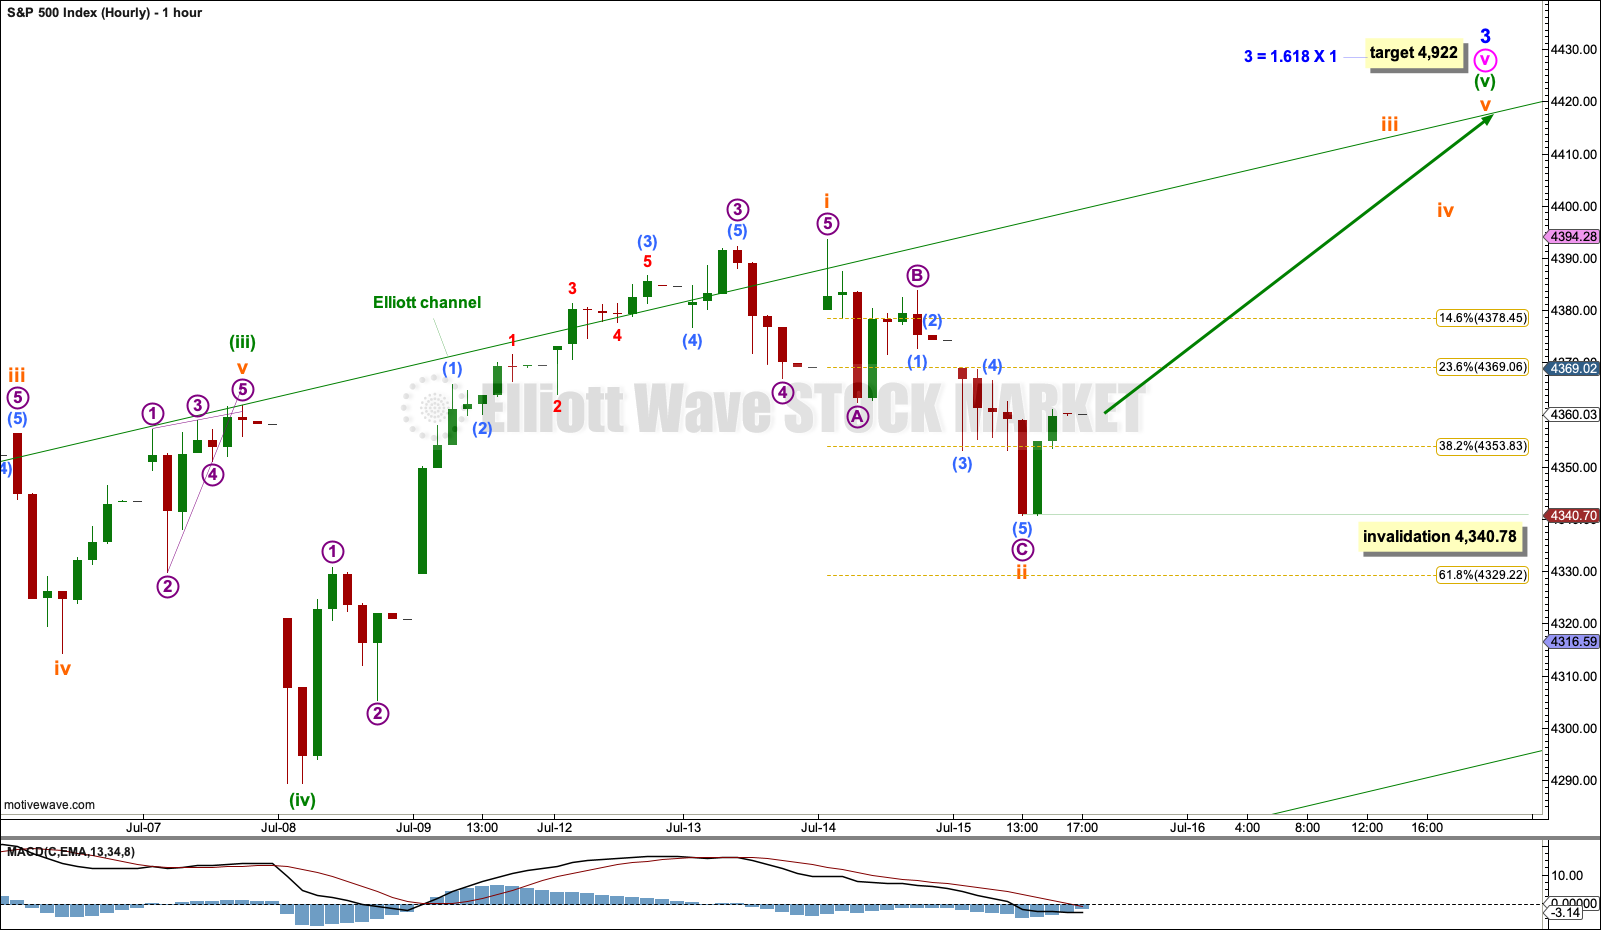
Click chart to enlarge.
Subminuette wave ii may be a complete single zigzag. Subminuette wave iii may have begun at today’s low.
Subminuette wave iii may only subdivide as an impulse. Within subminuette wave iii, no second wave correction may move beyond its start below 4,340.78.
ALTERNATE HOURLY CHART
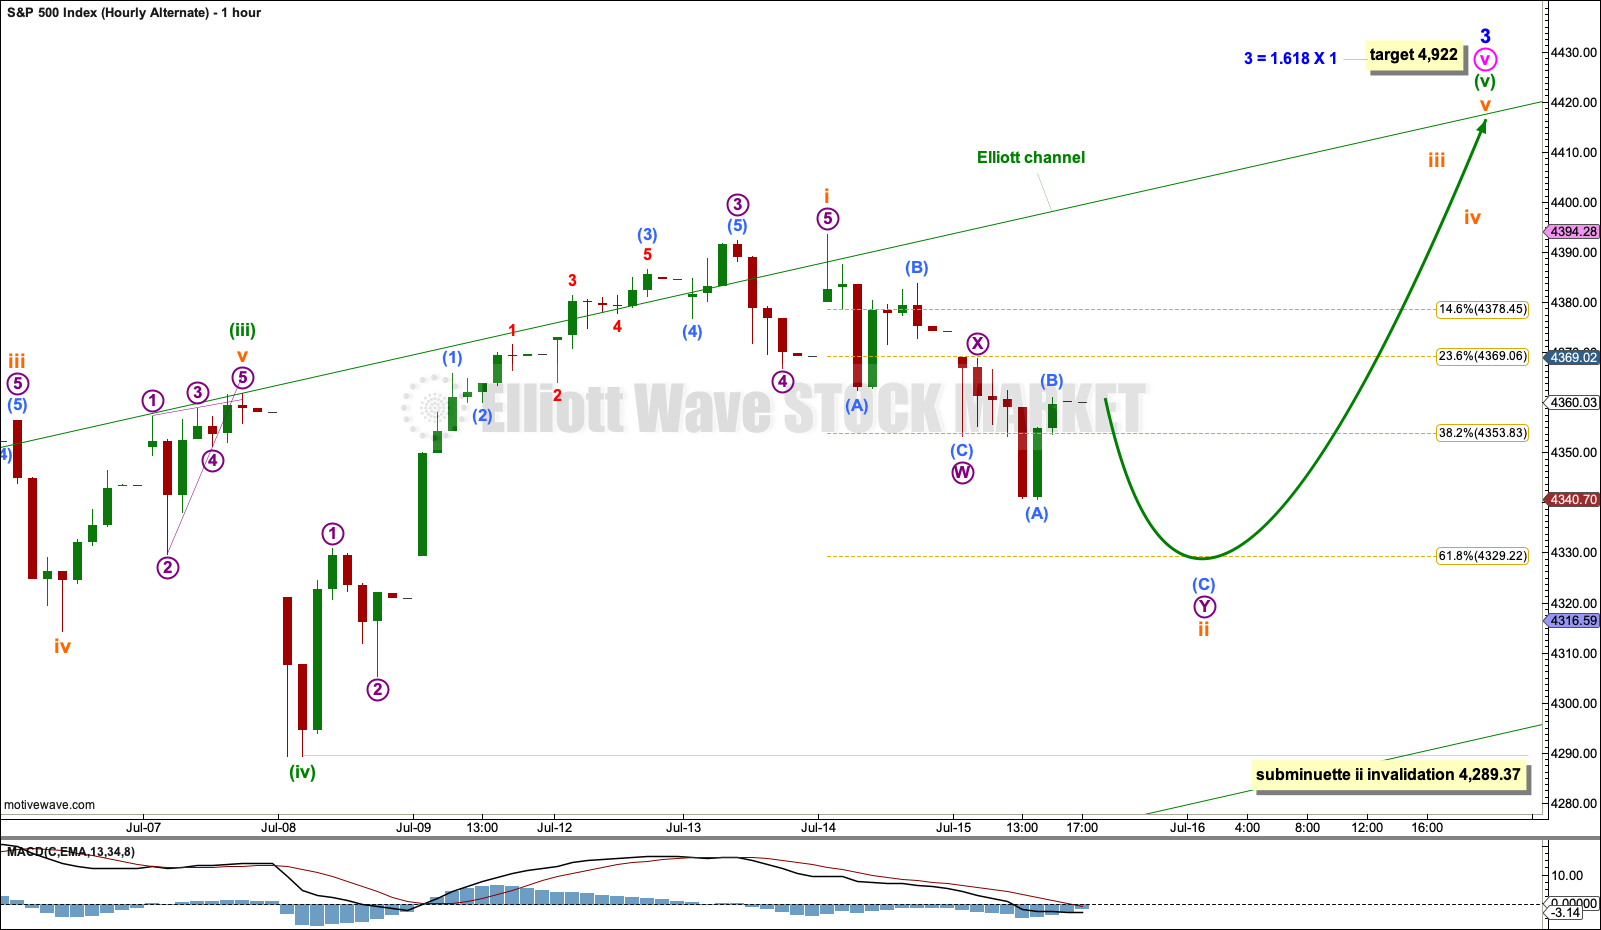
Click chart to enlarge.
Subminuette wave ii may continue a little lower tomorrow to end closer to the 0.618 Fibonacci ratio of subminuette wave i at 4,329.22.
Subminuette wave ii may not move beyond the start of subminuette wave i below 4,289.37.
SECOND ALTERNATE HOURLY CHART
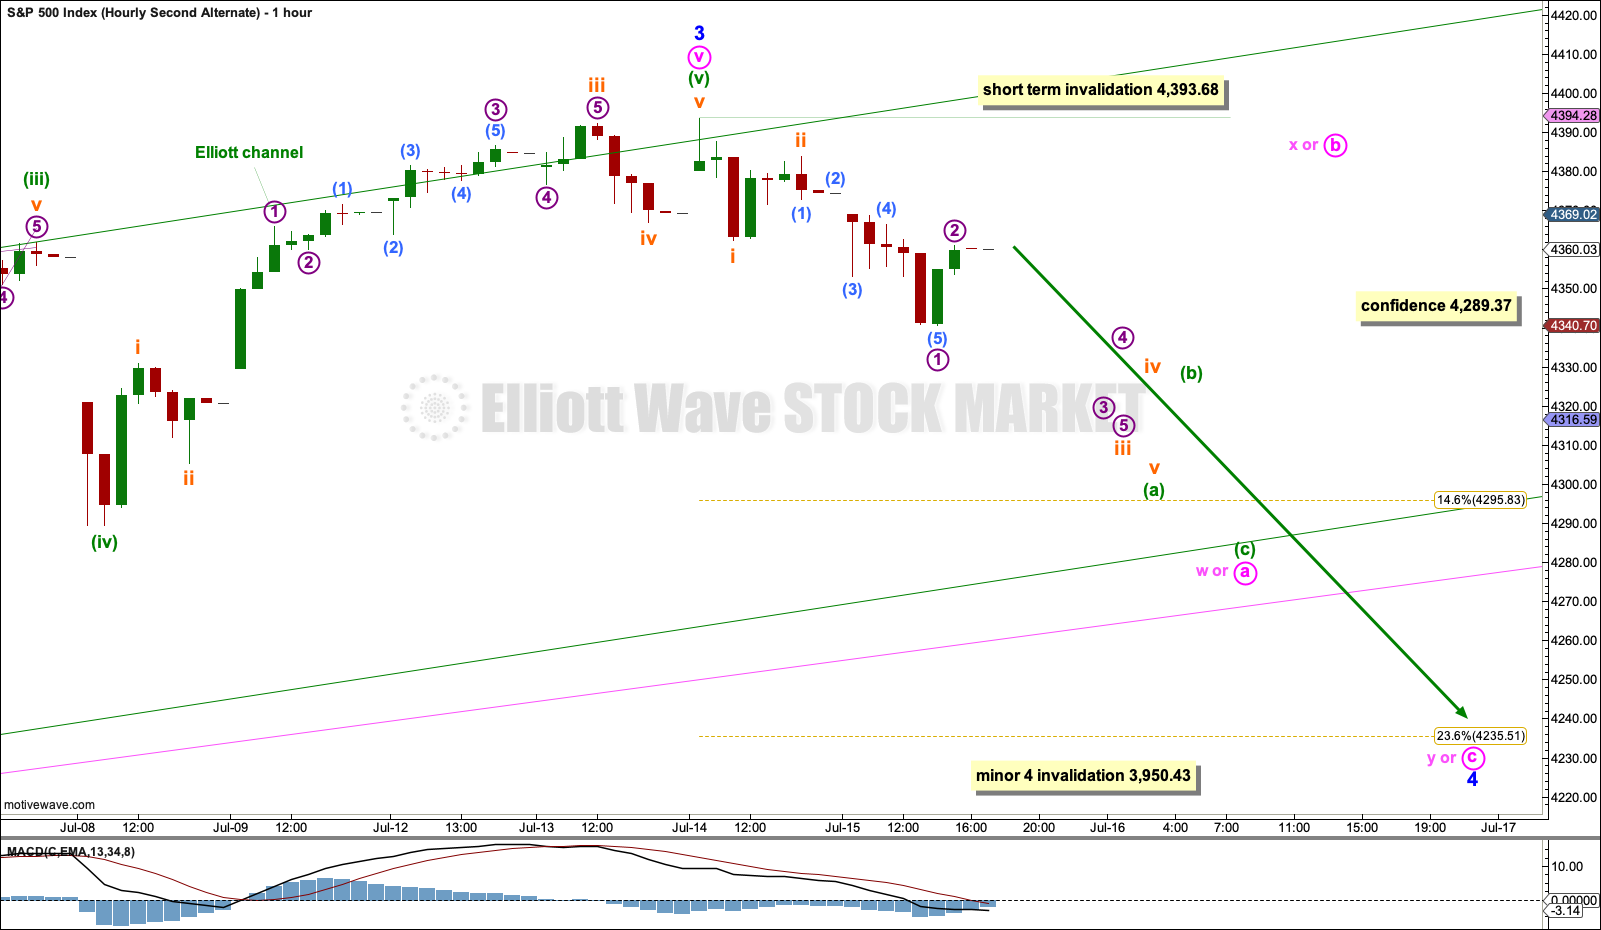
Click chart to enlarge.
The degree of labelling within minuette wave (v) is moved up one degree. It is possible that minuette wave (v) may be over, and so minute wave v and minor wave 3 may be over. If minor wave 3 is over, then it would be 70.64 points shorter than minor wave 1. This is highly unusual for the S&P, so this alternate wave count has a low probability.
Minor wave 2 lasted 2 weeks and subdivided as a double zigzag. Minor wave 4 may last about 2 to 4 weeks and would most likely subdivide as a flat, triangle or combination. Within these structures, minute wave a or w would most likely subdivide as a zigzag.
Within the zigzag of minute wave a or w, minuette wave (b) may not move beyond the start of minuette wave (a).
A first target for support for minor wave 4 may be the 0.236 Fibonacci ratio of minor wave 3 at 4,235.51 and thereafter the 0.382 Fibonacci ratio of minor wave 3 at 4,137.65.
If minor wave 4 subdivides as a triangle, combination or flat, then it would take the form of a choppy sideways consolidation. It is impossible to know which of many structures minor wave 4 may subdivide as; alternate wave counts would be required. Focus should be not on identifying a structure early and identifying each smaller swing within it, but on identifying when a structure for minor wave 4 may be complete and an upwards breakout expected.
TECHNICAL ANALYSIS
WEEKLY CHART
Click chart to enlarge. Chart courtesy of StockCharts.com.
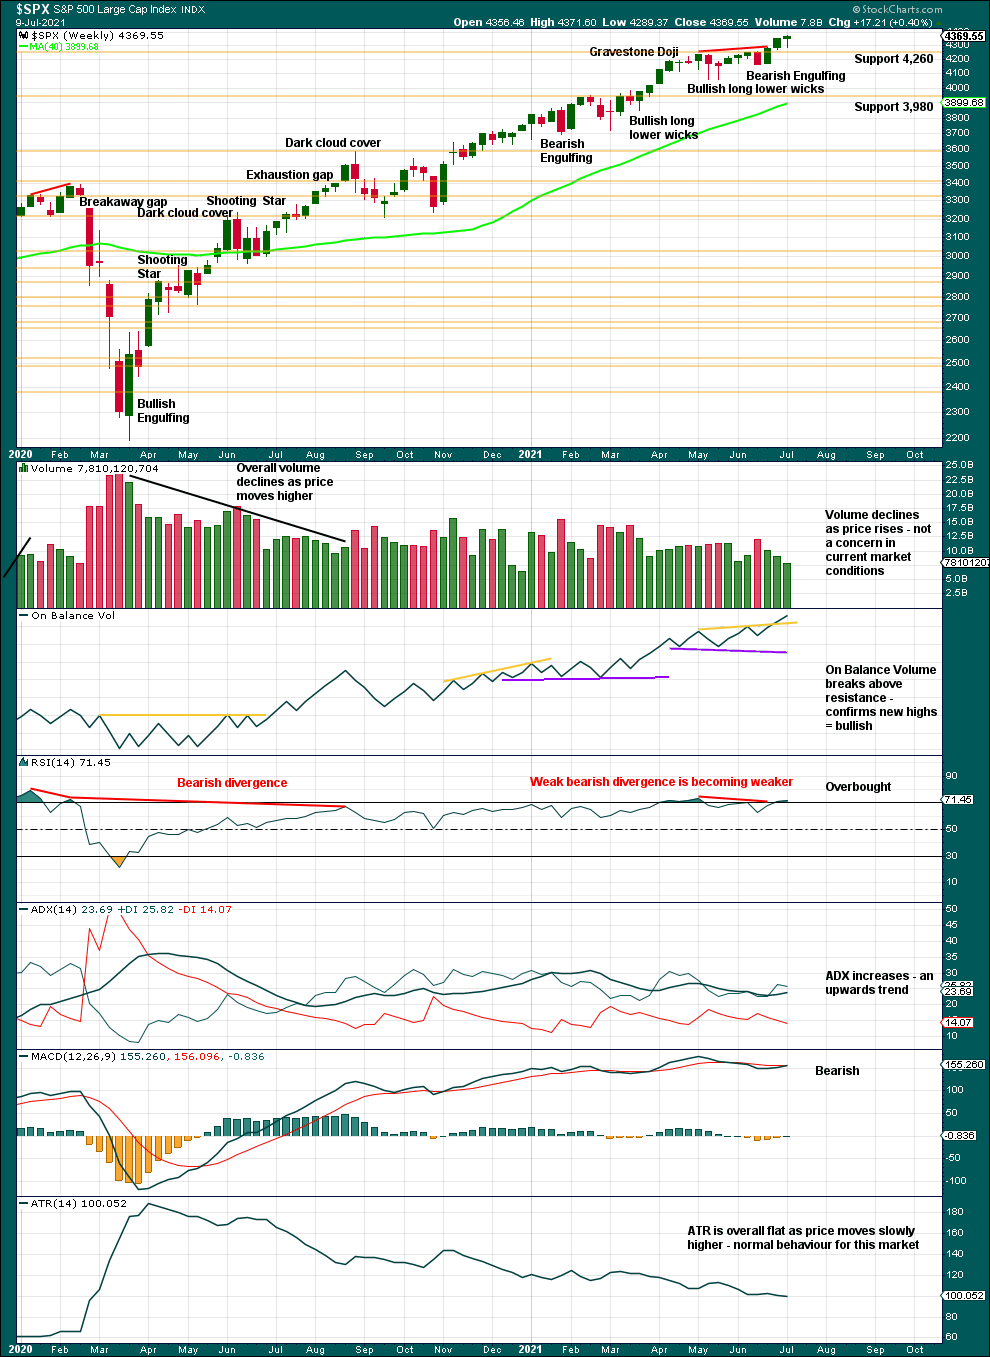
A series of higher highs and higher lows off the low of March 2020 continues. The last short-term swing low is now 4,164.40 on the 18th of June. While this remains intact, the dominant view should be of an upwards trend. There is a long way for this trend to run before conditions may become extreme.
On Balance Volume and ADX are bullish.
RSI is now overbought again, but this indicator may reach extremely overbought and remain there for a long time when this market has a strong bullish trend. With no clear and strong bearish divergence between the last two swing highs in price and RSI, it looks unlikely that a larger pullback may occur here.
DAILY CHART
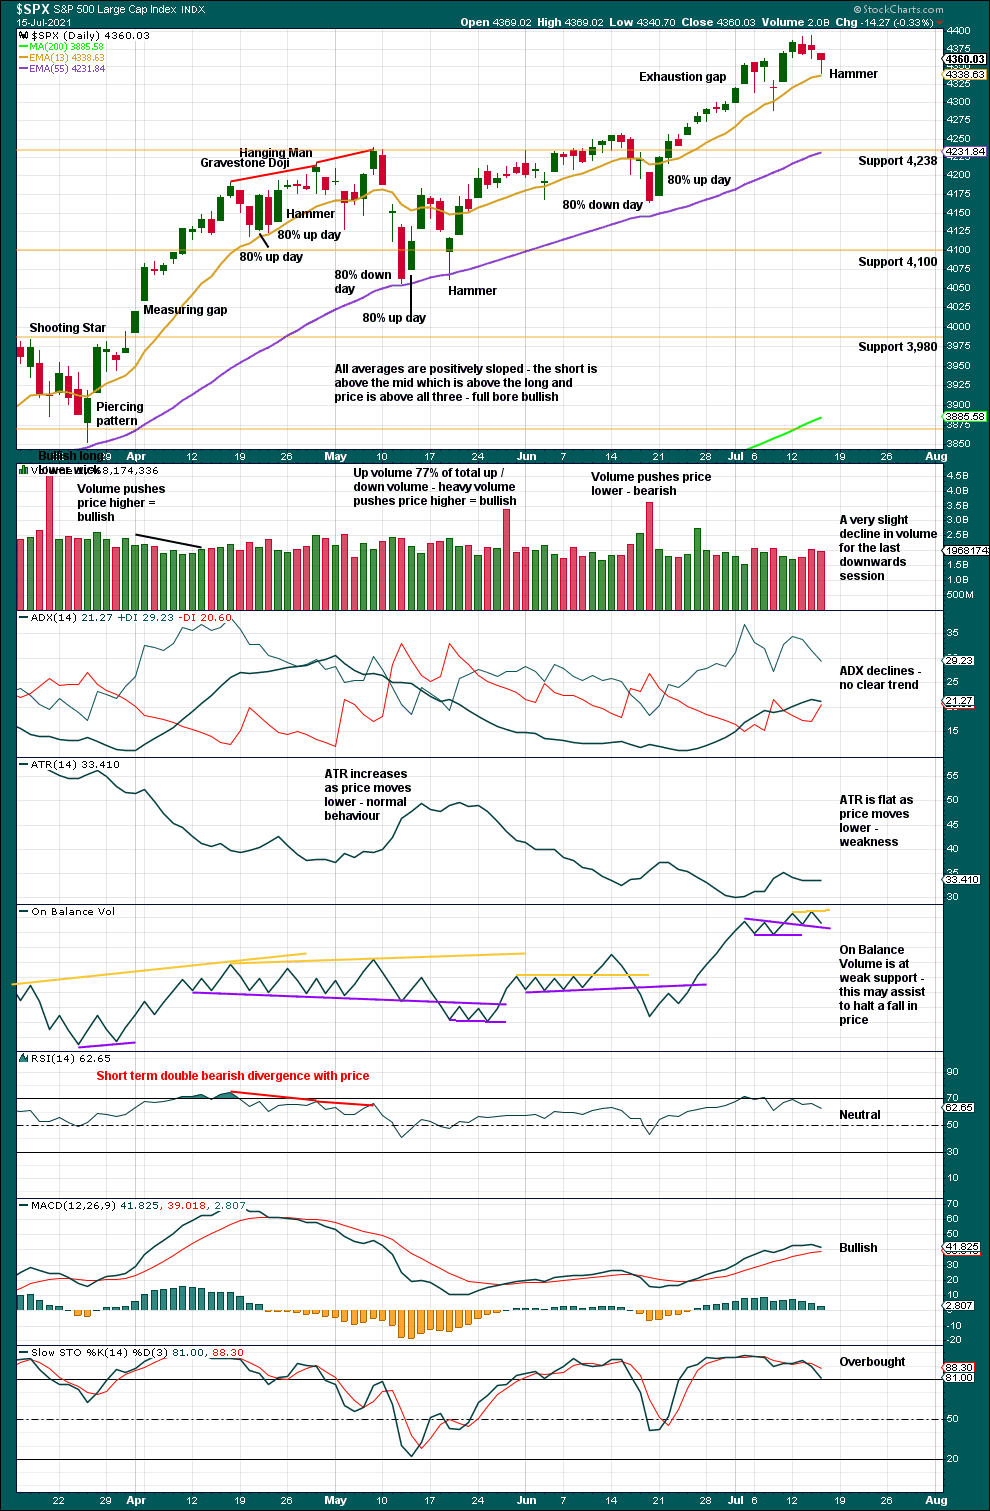
Click chart to enlarge. Chart courtesy of StockCharts.com.
Downwards volume is again modest at only 61% of total up / down volume, and volume today has declined. This in conjunction with the bullish Hammer pattern on today’s candlestick supports the main hourly Elliott wave count.
Overall, this chart remains bullish. There are warning signs that a larger pullback may arrive, but it may not arrive for a few more days to possibly even weeks.
BREADTH – AD LINE
WEEKLY CHART
Click chart to enlarge. Chart courtesy of StockCharts.com. So that colour blind members are included, bearish signals will be noted with blue and bullish signals with yellow.
Breadth should be read as a leading indicator.
Lowry’s Operating Companies Only AD line has made a new all time high on the 8th of June. There is now a month of bearish divergence between the OCO AD line and price.
Large caps all time high: 4,393.68 on Jul 14, 2021.
Mid caps all time high: 2,780.08 on May 10, 2021.
Small caps all time high: 1,417.45 on June 8, 2021.
This rise is led by large caps, which is a feature of an aged bull market. This fits the Elliott wave count that sees a fifth wave to end a third wave completing. This may continue for some time before a larger pullback arrives.
Last week price has moved higher, but the AD line has moved lower. There is now a single week instance of bearish divergence.
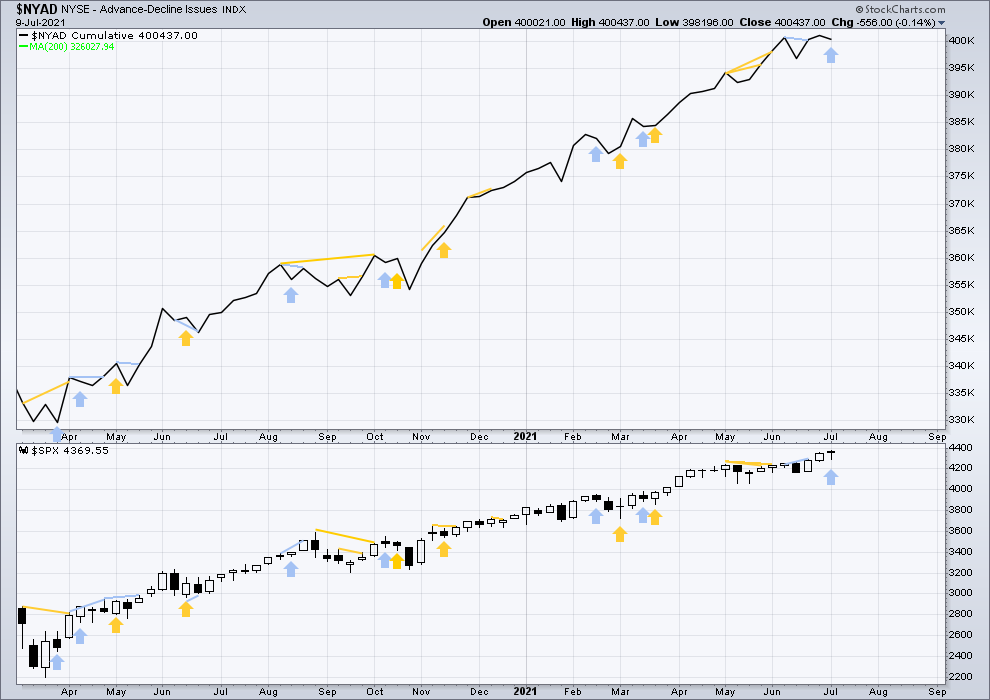
DAILY CHART
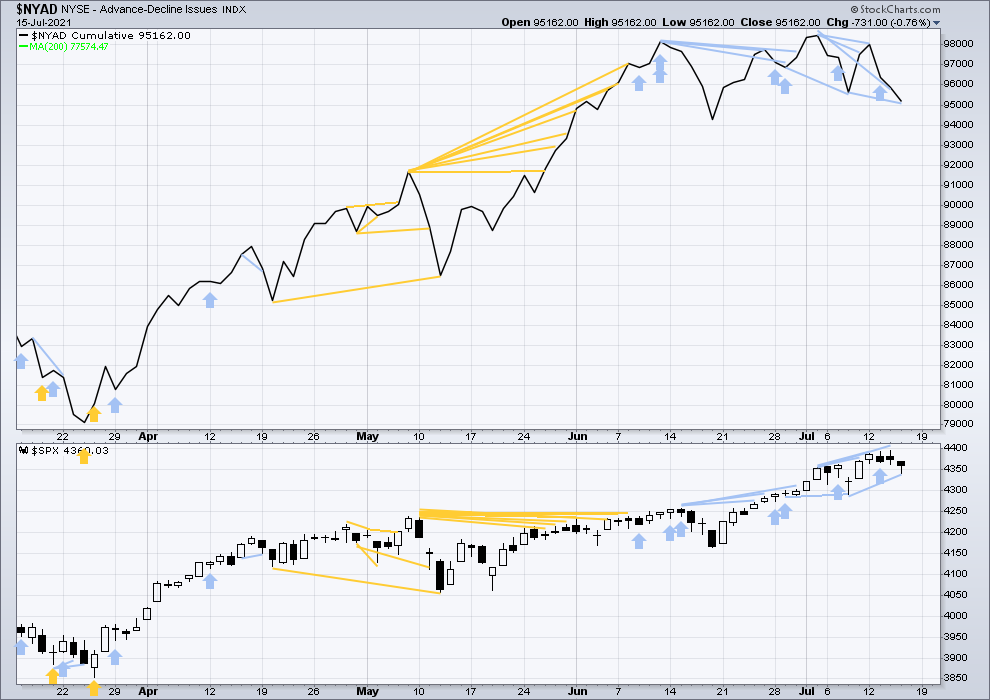
Click chart to enlarge. Chart courtesy of StockCharts.com. So that colour blind members are included, bearish signals will be noted with blue and bullish signals with yellow.
Today both price and the AD line have moved lower. The AD line has made a new short-term swing low below the prior low of the 8th of July, but price has not. This divergence is bearish and supports either of the alternate hourly Elliott wave counts.
Large caps led the last rise. Mid and small caps have been weaker since May / June. This supports the second alternate Elliott wave count.
VOLATILITY – INVERTED VIX CHART
WEEKLY CHART
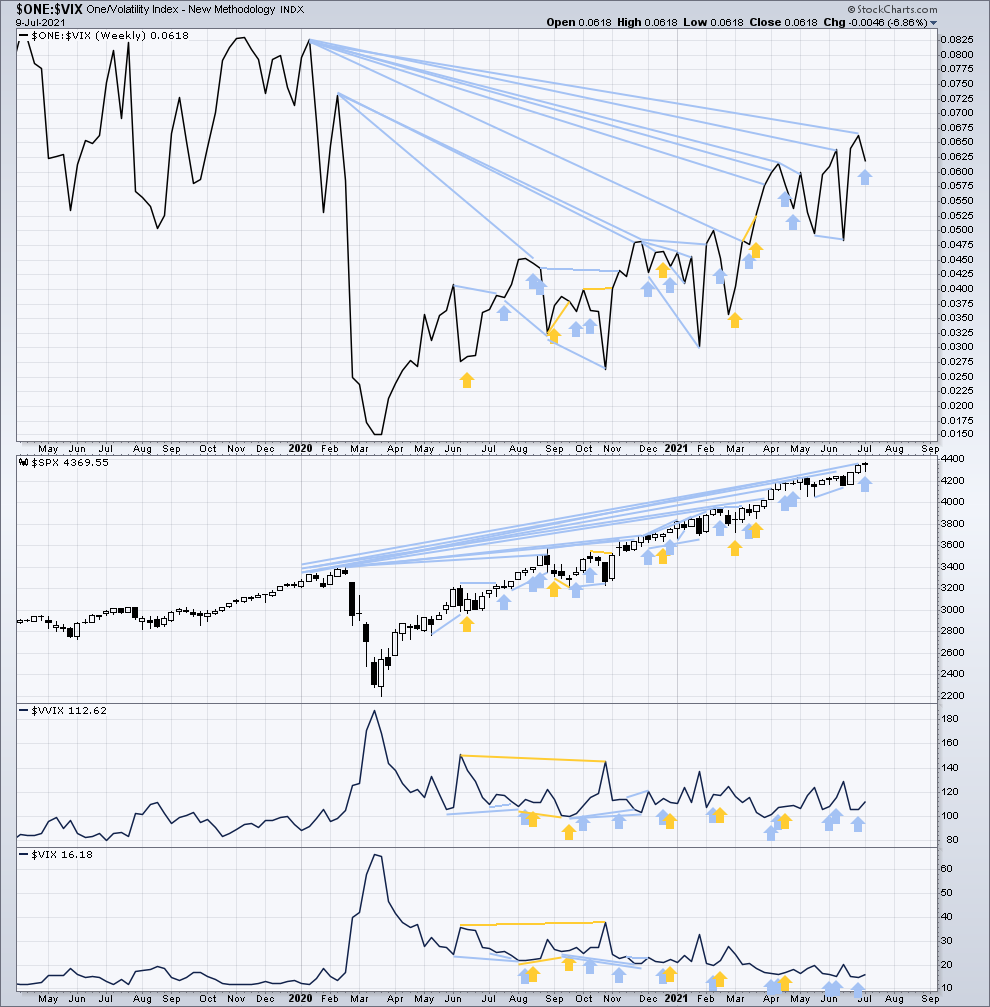
Click chart to enlarge. Chart courtesy of StockCharts.com. So that colour blind members are included, bearish signals will be noted with blue and bullish signals with yellow.
Inverted VIX remains well below all time highs. The all time high for inverted VIX was in the week beginning October 30, 2017. There is over 3 years of bearish divergence between price and inverted VIX. This bearish divergence may develop further before the bull market ends. It may be a very early indicator of an upcoming bear market, but it is not proving to be useful in timing.
Last week price has moved higher, but inverted VIX has moved lower. This is a single week instance of bearish divergence. Mid-term bearish divergence remains.
Comparing VIX and VVIX at the weekly chart level:
Last week both VIX and VVIX have moved higher. There is no new short-term divergence.
DAILY CHART
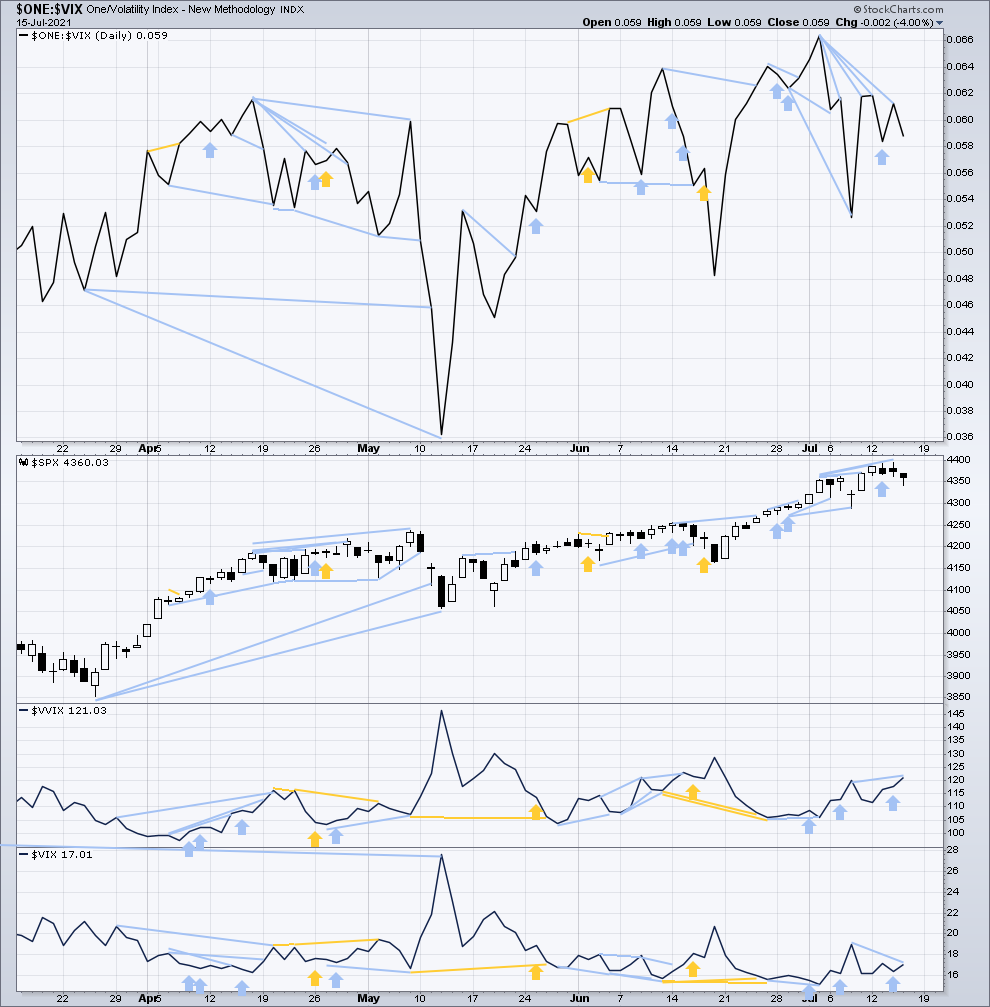
Click chart to enlarge. Chart courtesy of StockCharts.com. So that colour blind members are included, bearish signals will be noted with blue and bullish signals with yellow.
Today both price and inverted VIX have moved lower. Neither have made new short-term swing lows. This supports the main hourly Elliott wave count.
A cluster of short-term bearish divergence remains and supports either of the alternate hourly Elliott wave counts.
Comparing VIX and VVIX at the daily chart level:
Both VIX and VVIX have moved higher today. VVIX has made a new short-term high above the prior swing high of the 8th of July, but VIX has not. Volatility of VIX is elevated. This supports either of the alternate hourly Elliott wave counts.
On 2nd July VIX made a new short-term low below the 25th of June, but VVIX did not. This divergence is bearish for price for the short term, but it is reasonably weak.
DOW THEORY
Dow Theory confirms a new bull market with new highs made on a closing basis:
DJIA: 29,568.57 – closed above on 16th November 2020.
DJT: 11,623.58 – closed above on 7th October 2020.
Most recently, on 10th May 2021 both DJIA and DJT have made new all time highs. An ongoing bull market is again confirmed by Dow Theory.
Adding in the S&P and Nasdaq for an extended Dow Theory, confirmation of a bull market would require new highs made on a closing basis:
S&P500: 3,393.52 – closed above on 21st August 2020.
Nasdaq: 9,838.37 – closed above on June 8, 2020.
The following major swing lows would need to be seen on a closing basis for Dow Theory to confirm a change from bull to a bear market:
DJIA: 18,213.65
DJT: 6,481.20
Adding in the S&P and Nasdaq for an extended Dow Theory, confirmation of a new bear market would require new lows on a closing basis:
S&P500: 2,191.86
Nasdaq: 6,631.42
Published @ 07:58 p.m. ET.
—
Careful risk management protects your trading account(s).
Follow my two Golden Rules:
1. Always trade with stops.
2. Risk only 1-5% of equity on any one trade.
—
New updates to this analysis are in bold.
—