
S&P 500: Elliott Wave and Technical Analysis | Charts – June 25, 2021
The main Elliott wave count is slightly changed and is in line with the primary trend.
Summary: The primary trend remains up.
Two wave counts will still be used this week.
The main wave count assumes the trend remains the same and expects upwards movement; short-term invalidation points are at 4,271.20 and more importantly at 4,256.60. If price breaches these points early next week, then that would indicate the alternate may be correct. The next minor degree correction is expected to come before a limit at 4,690.27. Use the upper edge of the channel for resistance. A longer term target is at 5,468.
The alternate wave count expects a fourth wave expanded flat may move lower next week to a target at 4,136 to 4,131.
The biggest picture, Grand Super Cycle analysis, is here.
Monthly charts are last updated here with video here.
MAIN ELLIOTT WAVE COUNT
WEEKLY CHART
Click chart to enlarge.
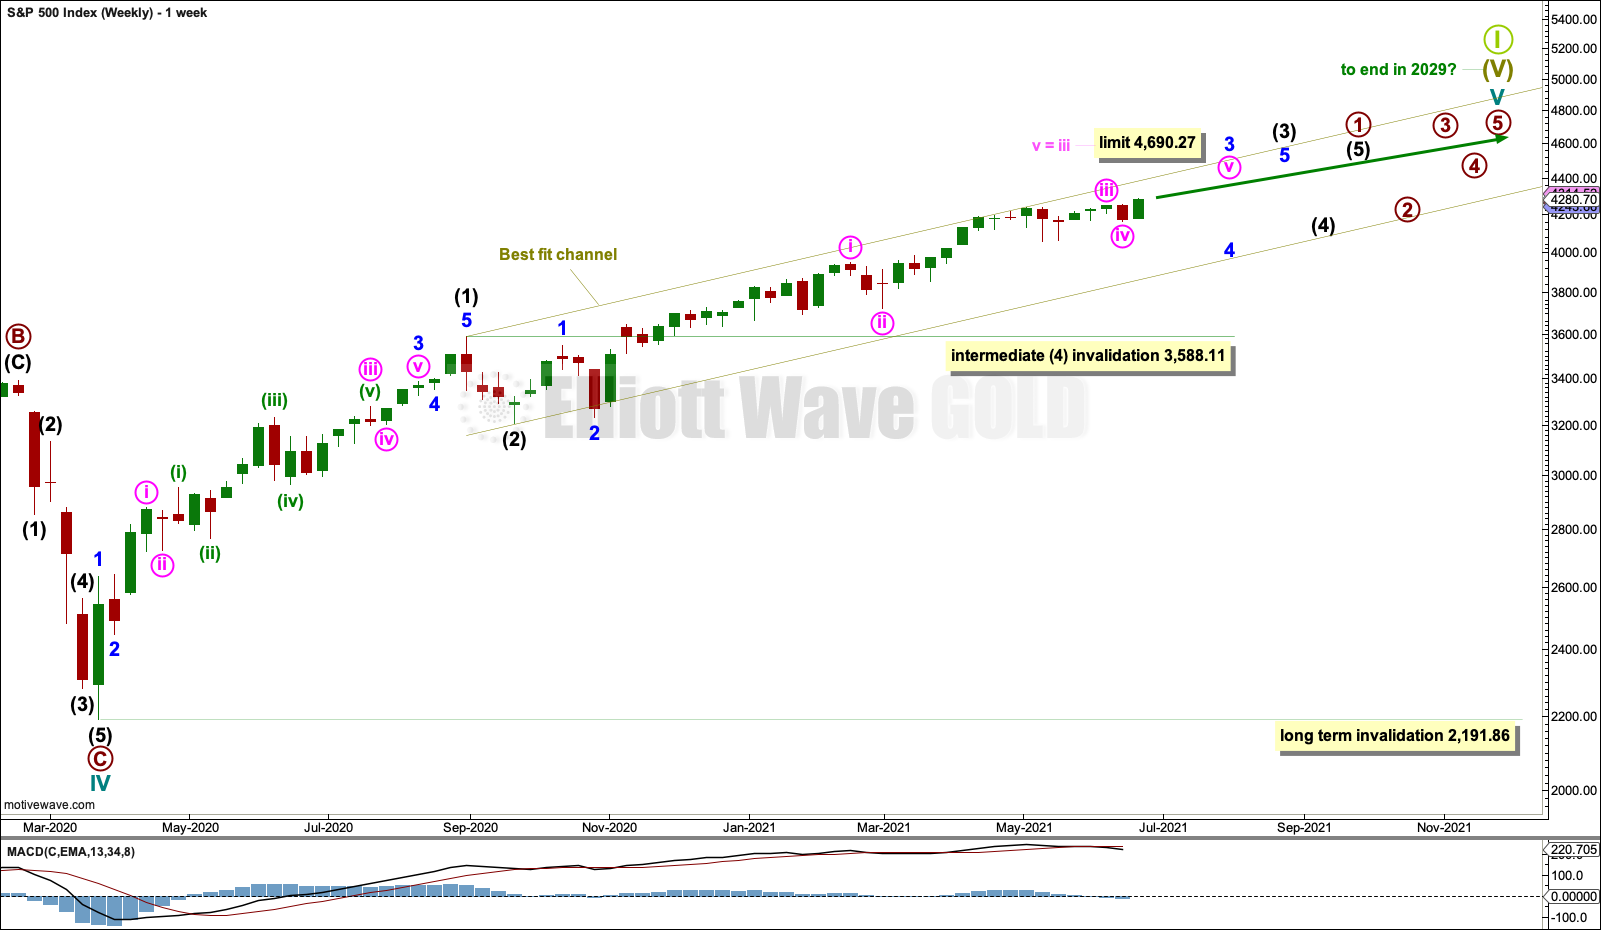
Cycle wave V may last from one to several years. So far it is in its fifteenth month.
This wave count may allow time for the AD line to diverge from price as price makes final highs before the end of the bull market. The AD line most commonly diverges a minimum of 4 months prior to the end of a bull market. A longer divergence is positively correlated with a deeper bear market. A shorter divergence is positively correlated with a more shallow bear market. With zero divergence at this stage, if a surprise bear market does develop here, then it would likely be shallow.
A longer divergence between price and the AD line would be expected towards the end of Grand Super Cycle wave I.
It is possible that cycle wave V may continue until 2029, if the 2020s mirror the 1920s. Either March or October 2029 may be likely months for the bull market to end.
Cycle wave V would most likely subdivide as an impulse. But if overlapping develops, then an ending diagonal should be considered. This chart considers the more common impulse.
There is already a Fibonacci ratio between cycle waves I and III within Super Cycle wave (V). The S&P500 often exhibits a Fibonacci ratio between two of its actionary waves but rarely between all three; it is less likely that cycle wave V would exhibit a Fibonacci ratio. The target for Super Cycle wave (V) to end would best be calculated at primary degree, but that cannot be done until all of primary waves 1, 2, 3 and 4 are complete.
Primary wave 1 within cycle wave V may be incomplete. This gives a very bullish wave count, expecting a long duration for cycle wave V which has not yet passed its middle strongest portion.
Within primary wave 1: Intermediate waves (1) and (2) may be complete, and intermediate wave (3) may now be approaching an end.
Minor waves 1 and 2 within intermediate wave (3) may be complete.
Intermediate wave (4) may not move into intermediate wave (1) price territory below 3,588.11.
A best fit channel is drawn about cycle wave V. Draw the first trend line from the end of intermediate wave (1) to the last high, then place a parallel copy on the end of intermediate wave (2). The channel may need to be redrawn as price continues higher. The channel may show where price may find resistance and support along the way up.
When primary wave 1 may be complete, then a multi-month pullback or consolidation may unfold for primary wave 2. It is possible that primary wave 2 may meet the technical definition of a bear market; it may correct to 20% or more of market value.
Primary wave 2 may not move beyond the start of primary wave 1 below 2,191.86.
DAILY CHART
Click chart to enlarge.
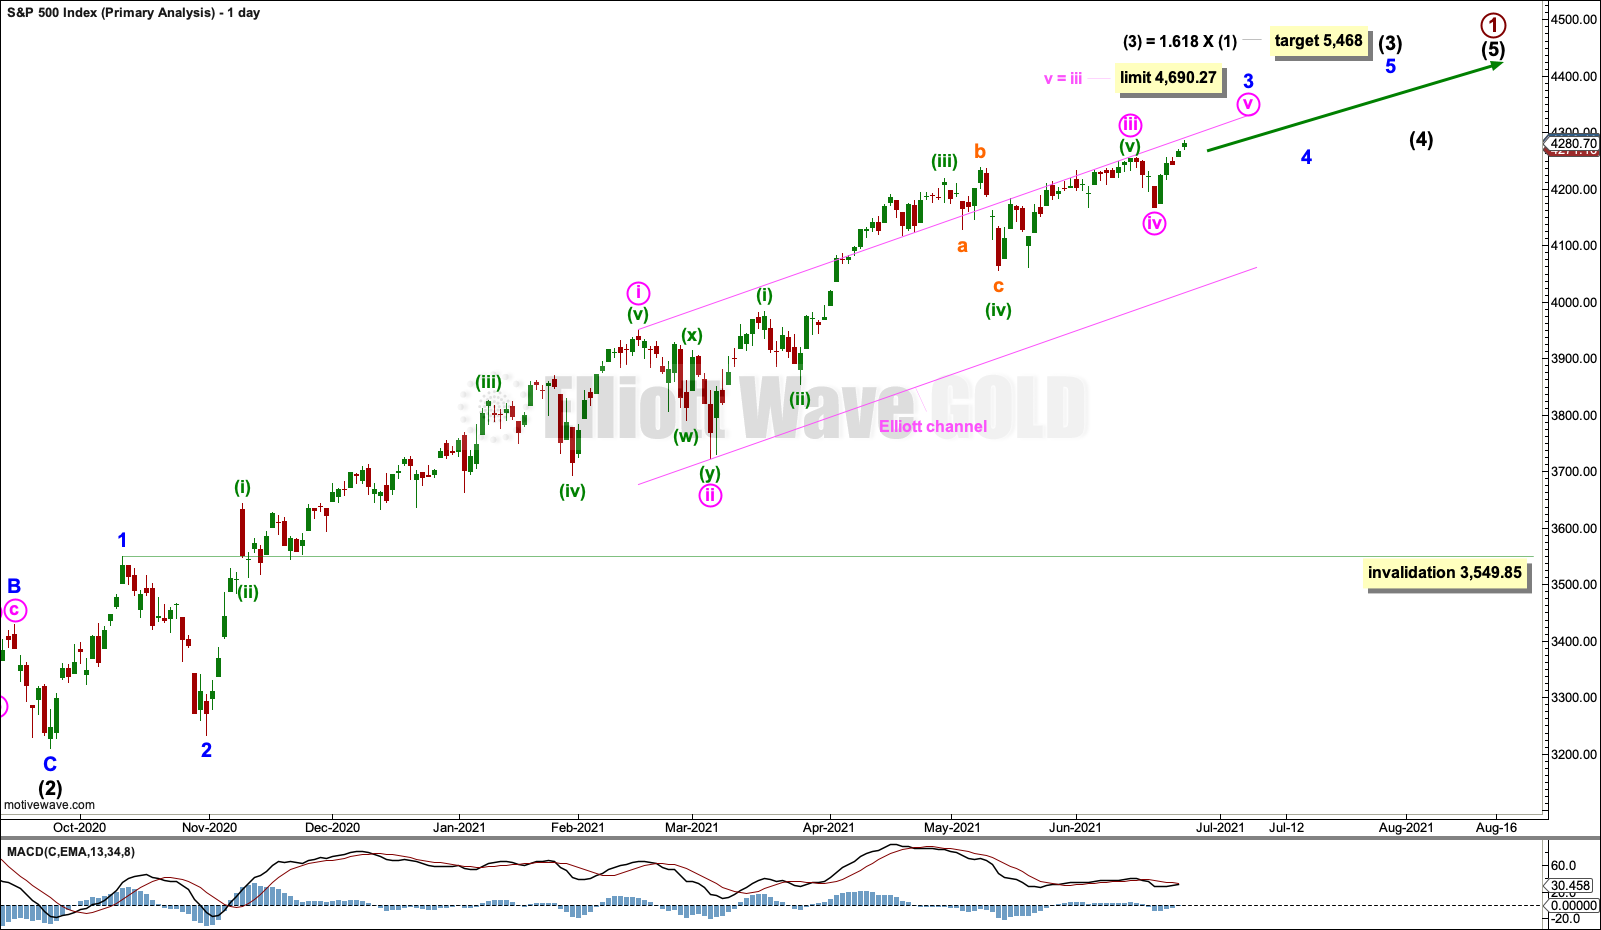
Draw a channel about minor wave 3 using Elliott’s first technique. Draw the first trend line from the ends of minute waves i to iii, then place a parallel copy on the end of minute wave ii. Minute wave iv may have ended midway within the channel.
A target is calculated for intermediate wave (3) that expects a common Fibonacci ratio to intermediate wave (1).
Intermediate wave (3) may only subdivide as an impulse. Minor wave 3 within intermediate wave (3) may be nearing an end. When minor wave 4 arrives, then it may last about three weeks and may not move into minor wave 1 price territory below 3,549.85.
HOURLY CHART
Click chart to enlarge.
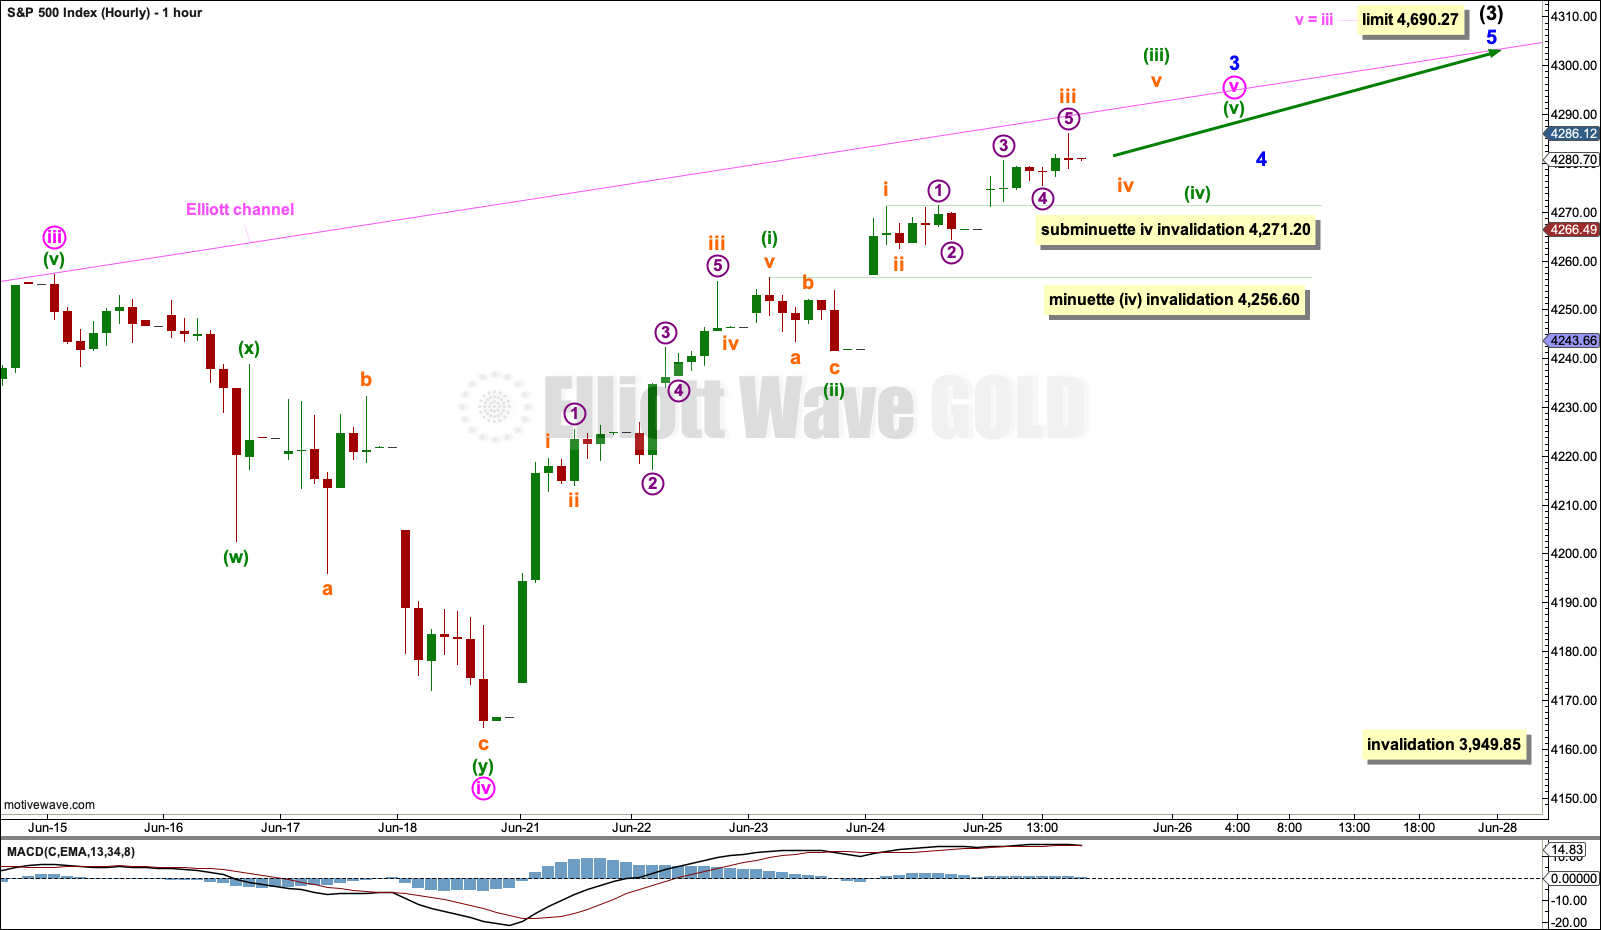
Minute wave v within minor wave 3 may be underway.
Within minute wave v: Minuette waves (i) and (ii) may be complete, and minuette wave (iii) may be incomplete.
ALTERNATE WAVE COUNT
DAILY CHART
Click chart to enlarge.
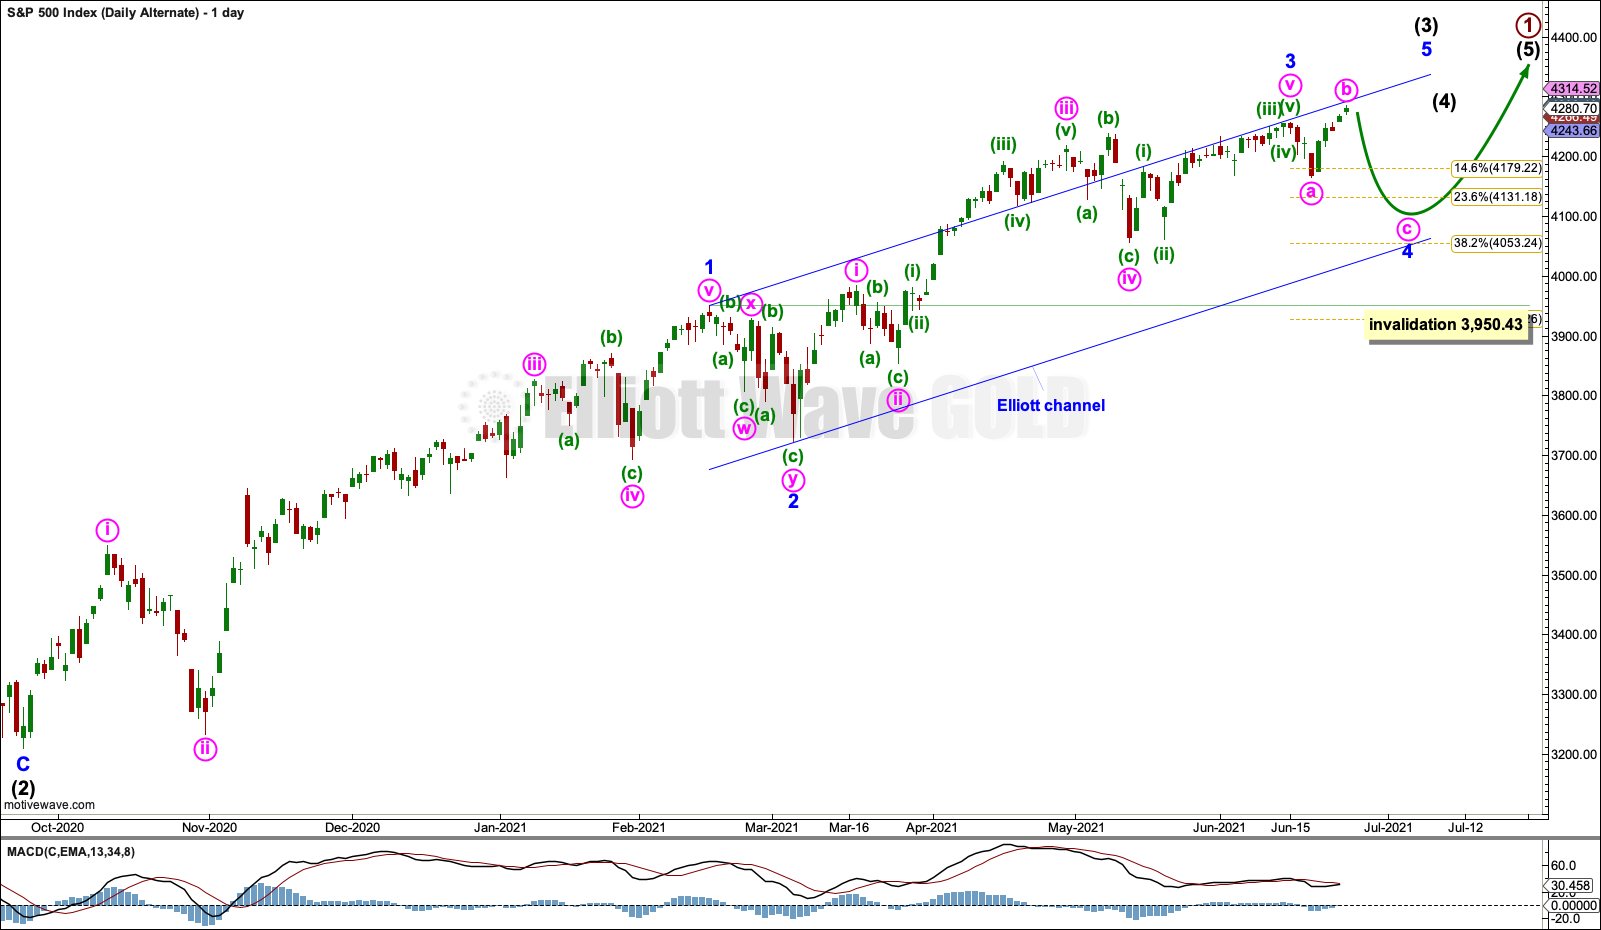
This alternate wave count labels intermediate wave(3) differently. It is possible that minor wave 3 is over and minor wave 4 may now continue lower as an expanded flat or running triangle. A target is calculated for minor wave 4. If this target is wrong, then it may be too low. If minor wave 4 continues as a triangle, then it may continue for a few more sessions in a sideways movement with ever decreasing range, and it may not make a new low below 4,165.30.
Minor wave 4 may not move into minor wave 1 price territory below 3,950.43.
HOURLY CHART
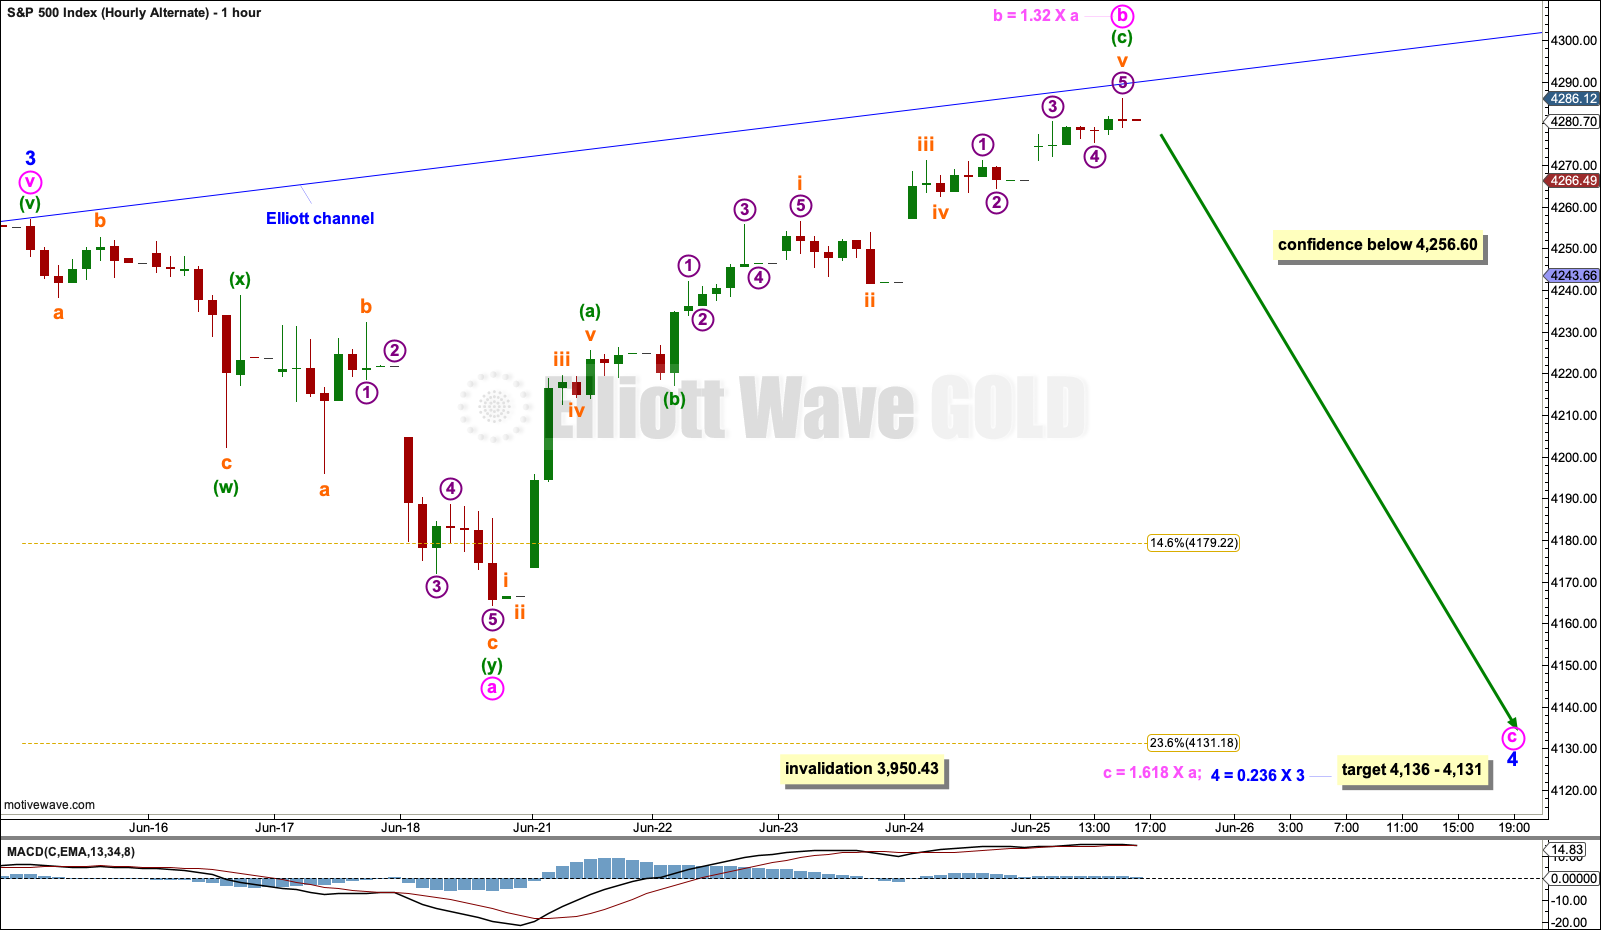
Click chart to enlarge.
If minor wave 4 is continuing as an expanded flat, then within it minute wave b is a 1.32 length of minute wave a. This is within the common range of up to 1.38.
A target is calculated for minute wave c.
If minor wave 4 is continuing as a running triangle, then within it minute wave c may not move beyond the end of minute wave a below 4,165.30.
TECHNICAL ANALYSIS
WEEKLY CHART
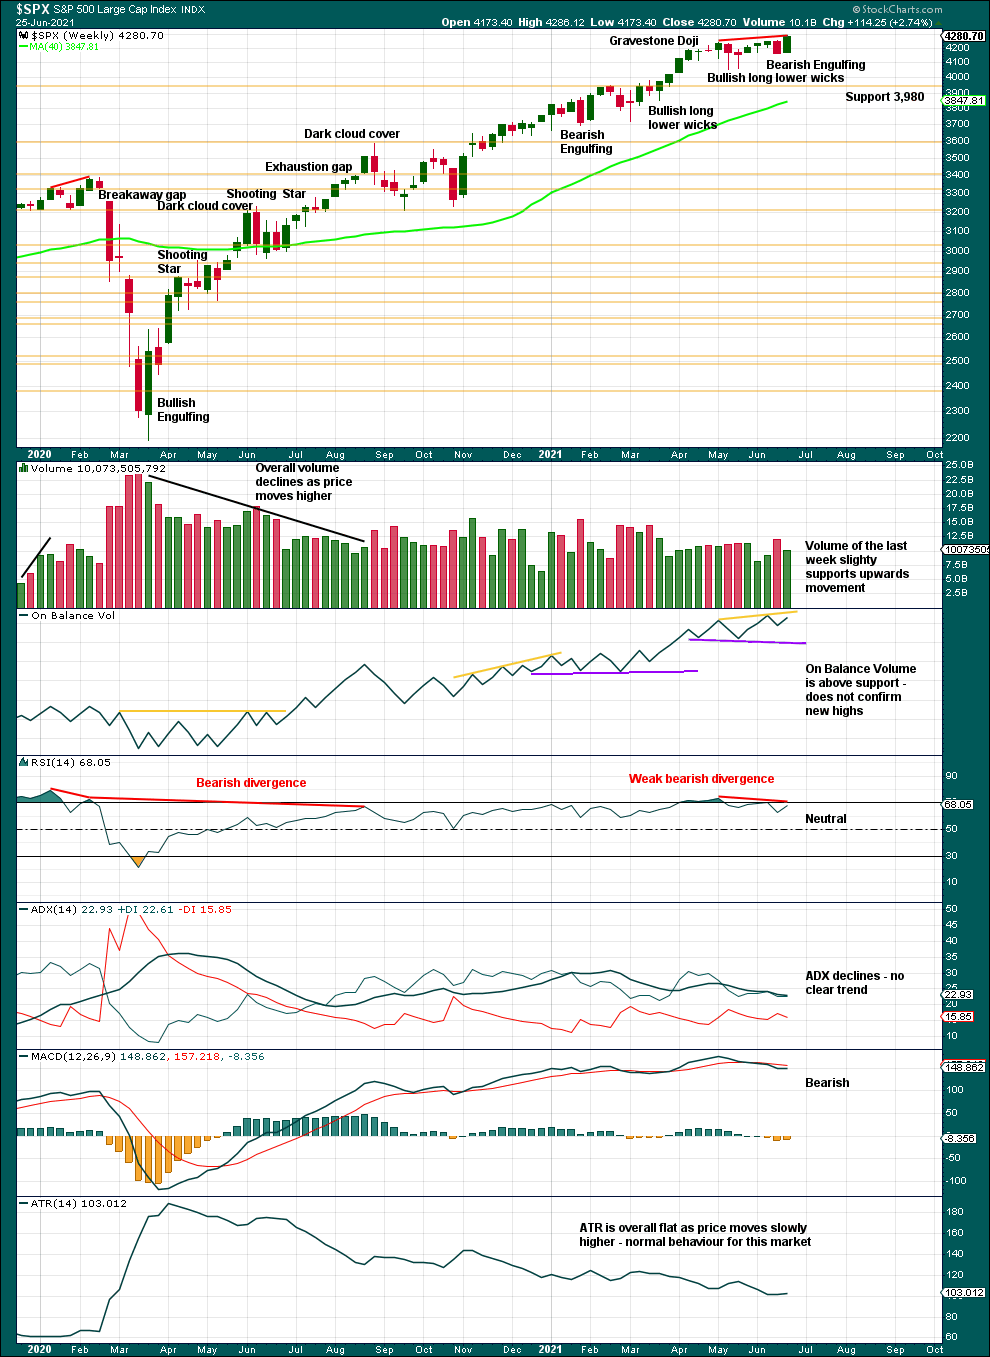
Click chart to enlarge. Chart courtesy of StockCharts.com.
A series of higher highs and higher lows off the low of March 2020 continues. The last short-term swing low is now at 4,056.88. While this remains intact, the dominant view should be of an upwards trend. There is a long way for this trend to run before conditions may become extreme.
Again, a strong Bearish Engulfing pattern in last week’s candlestick has not been followed by any further downwards movement. Now a strong bullish candlestick negates this bearishness.
DAILY CHART
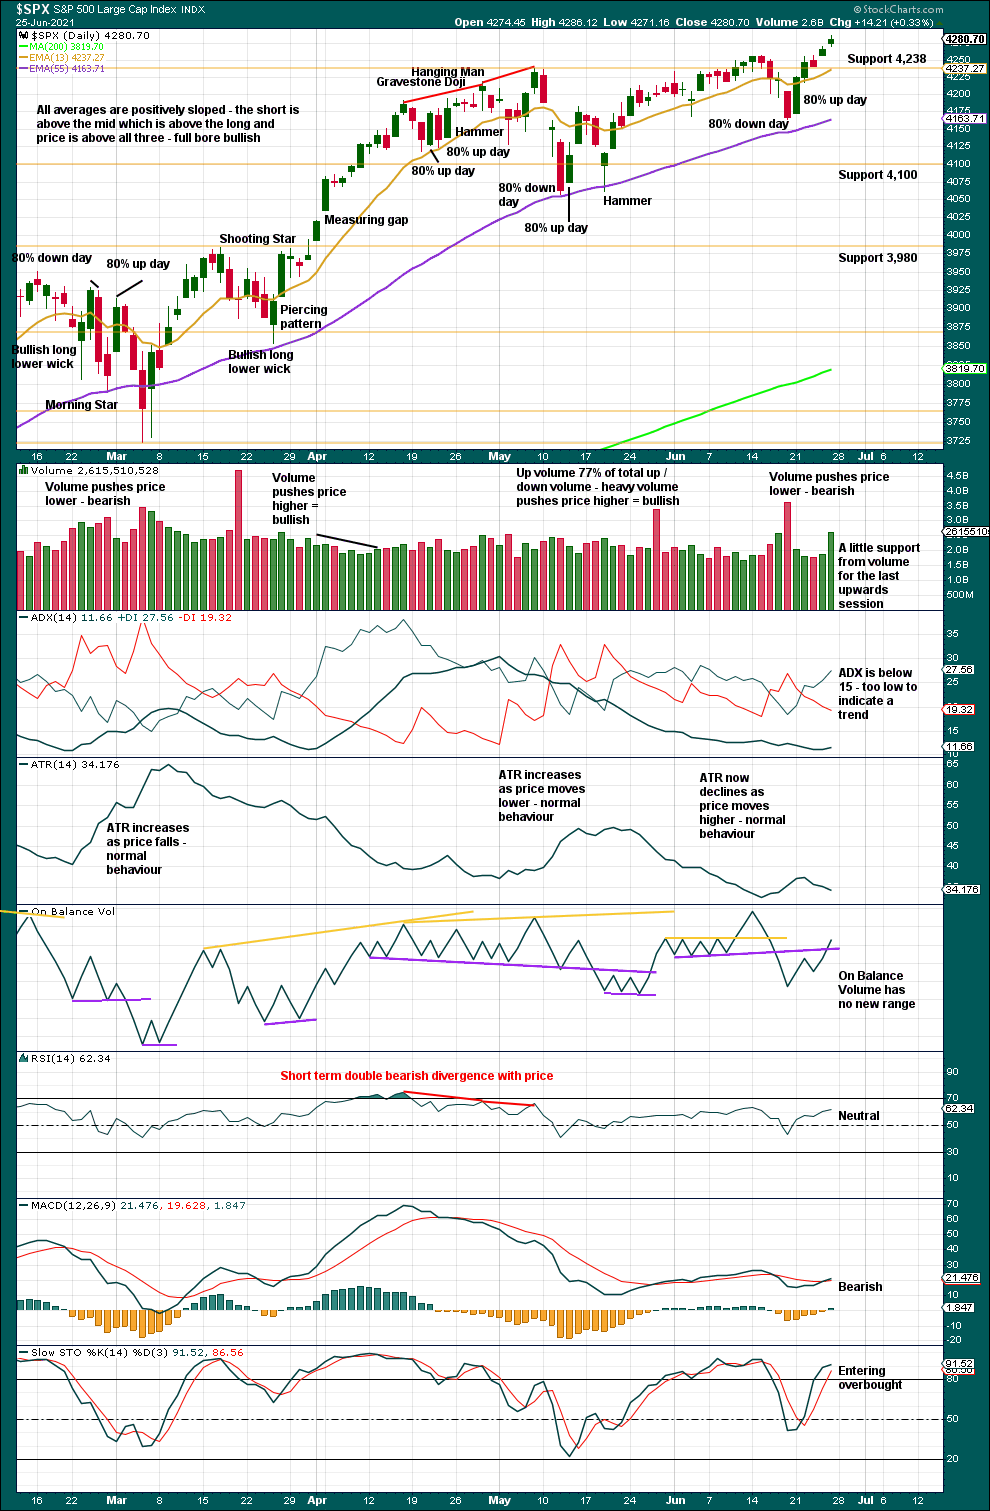
Click chart to enlarge. Chart courtesy of StockCharts.com.
The last swing low is at 4,056.88 on the 12th of May. While price remains above this point, then a series of higher highs and higher lows would remain intact, the basic definition of an upwards trend.
Thursday and Friday have both closed to new all time highs. Friday now has support from volume, which supports the main Elliott wave count.
BREADTH – AD LINE
WEEKLY CHART
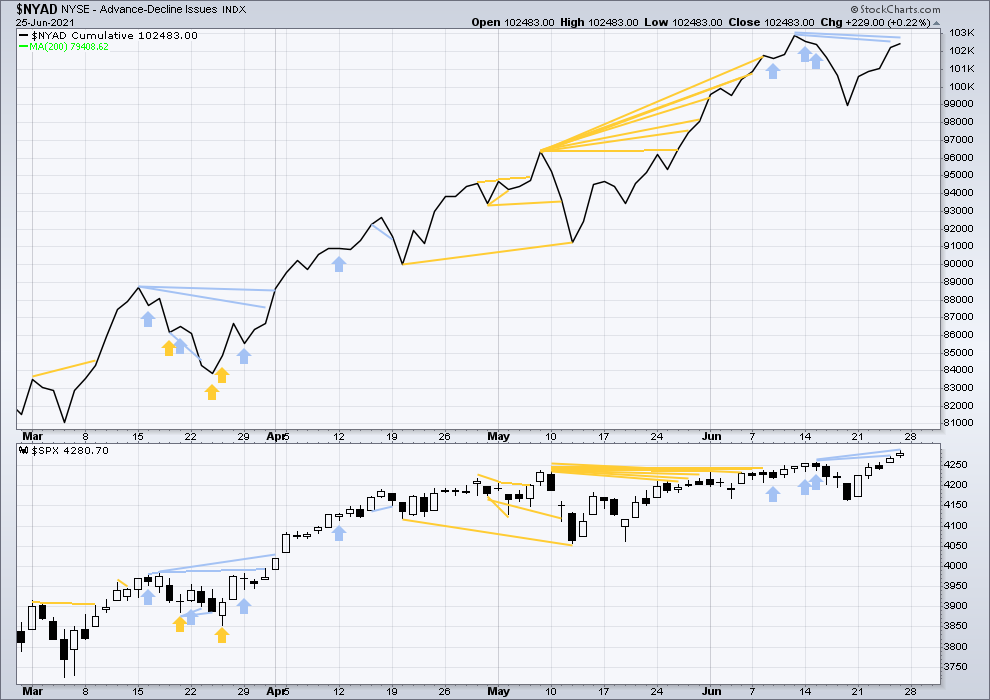
Click chart to enlarge. Chart courtesy of StockCharts.com. So that colour blind members are included, bearish signals will be noted with blue and bullish signals with yellow.
Breadth should be read as a leading indicator.
Lowry’s Operating Companies Only AD line has made a new all time high on the 8th of June. With zero bearish divergence at the last high, any pullbacks here would most likely be short term in nature. Pullbacks in a relatively healthy bull market may be used as buying opportunities.
Large caps all time high: 4,286.12 on Jun 25, 2021.
Mid caps all time high: 2,778.84 on April 29, 2021.
Small caps all time high: 1,417.45 on June 8, 2021.
So far in this pullback it is mid caps which are weakest.
This week price has made new all time highs, but the AD line has not. This divergence is bearish, but it is very weak. There are two prior examples of short-term weak bearish divergence failing: on the weeks beginning April 27th and May 18th, 2020.
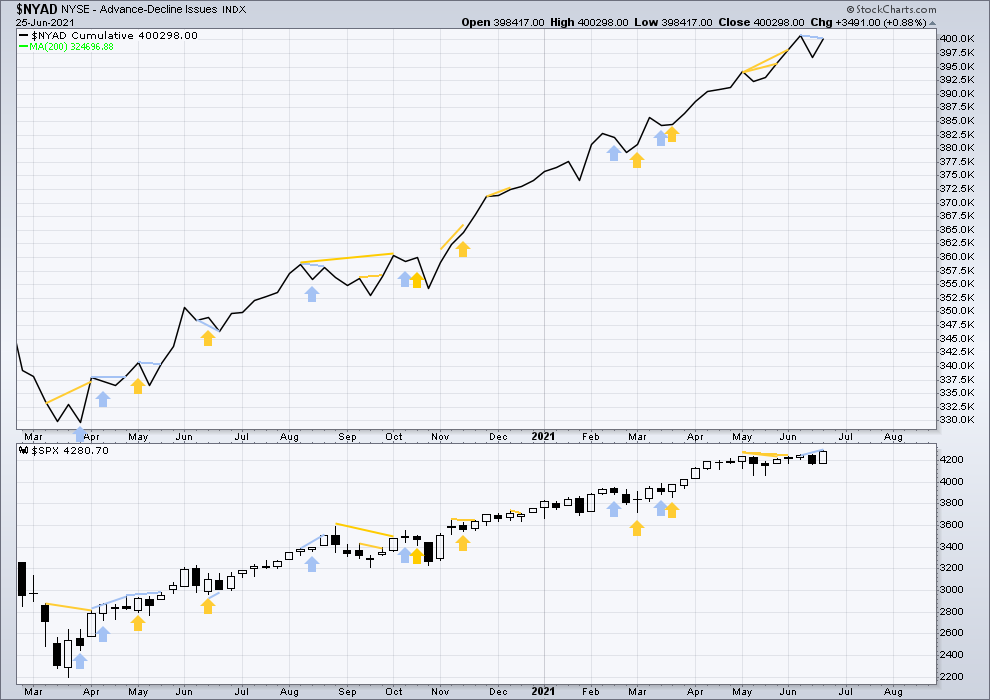
DAILY CHART
Click chart to enlarge. Chart courtesy of StockCharts.com. So that colour blind members are included, bearish signals will be noted with blue and bullish signals with yellow.
For two days in a row now price has made a new high, but the AD line has not. This upwards movement lacks support from breadth. This divergence is bearish and supports the alternate Elliott wave count.
On Friday only large caps made new all time highs. A rise led by large caps is bearish for an aged market. This still fits the main Elliott wave count that sees a fifth wave unfolding.
VOLATILITY – INVERTED VIX CHART
WEEKLY CHART
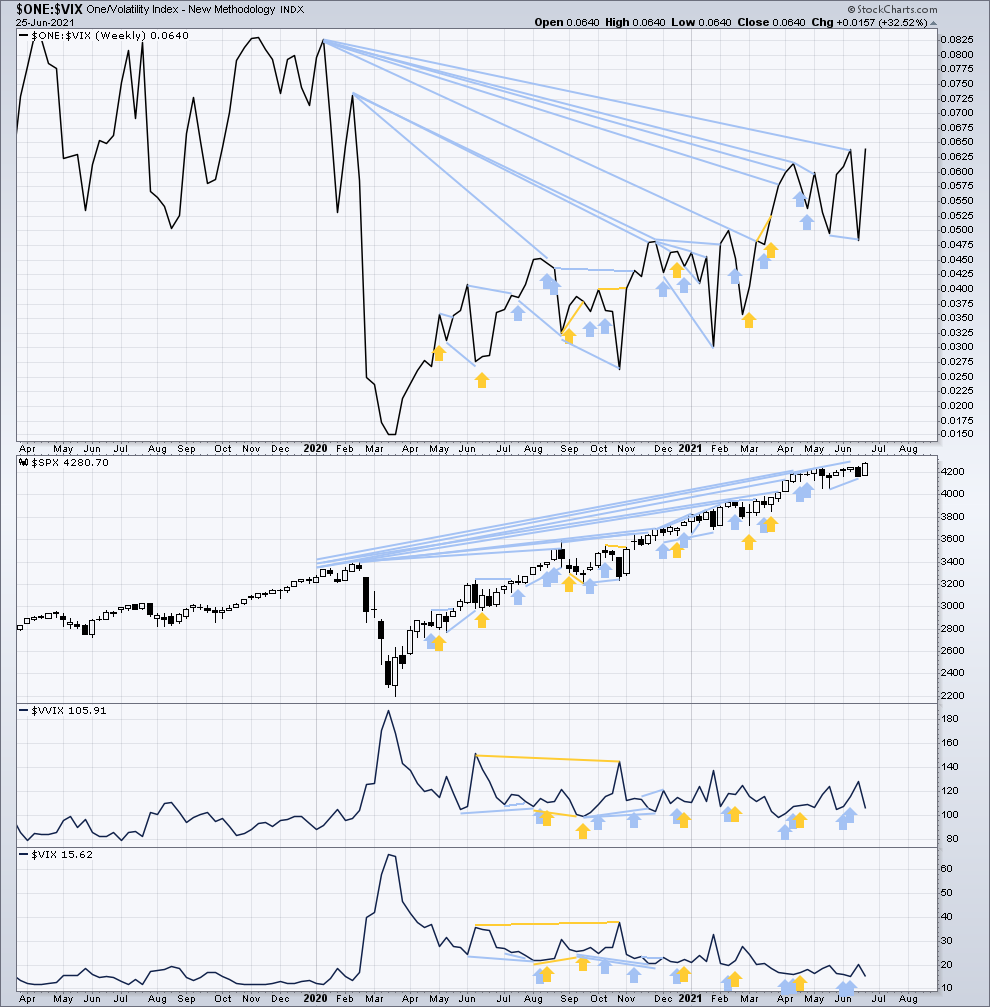
Click chart to enlarge. Chart courtesy of StockCharts.com. So that colour blind members are included, bearish signals will be noted with blue and bullish signals with yellow.
Inverted VIX remains well below all time highs. The all time high for inverted VIX was in the week beginning October 30, 2017. There is over 3 years of bearish divergence between price and inverted VIX. This bearish divergence may develop further before the bull market ends. It may be a very early indicator of an upcoming bear market, but it is not proving to be useful in timing.
This week both price and inverted VIX have moved higher. Mid-term bearish divergence remains.
Comparing VIX and VVIX at the weekly chart level:
Last week both VIX and VVIX have moved higher. There is no new short-term divergence.
DAILY CHART
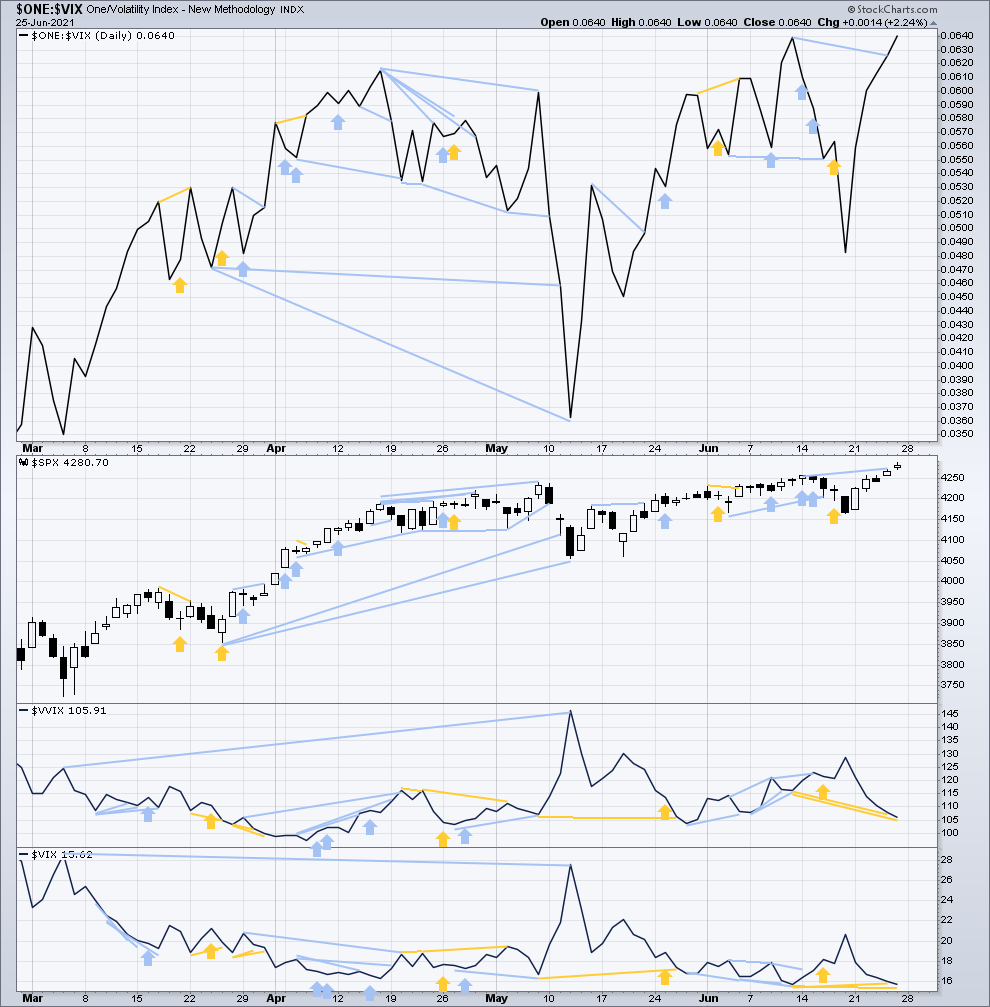
Click chart to enlarge. Chart courtesy of StockCharts.com. So that colour blind members are included, bearish signals will be noted with blue and bullish signals with yellow.
Both price and inverted VIX have made new short-term highs on Friday. There is no longer short-term divergence. Because inverted VIX does not agree with the AD line today and divergence from the AD line is weak, overall this will be read as neutral.
Comparing VIX and VVIX at the daily chart level:
Both VIX and VVIX have moved lower today. VVIX has made another new short-term swing low below the prior low of the 11th of June, but VIX has not. Volatility of VIX is declining faster than VIX. This divergence is bullish for price for the short term and supports the main Elliott wave count.
DOW THEORY
Dow Theory confirms a new bull market with new highs made on a closing basis:
DJIA: 29,568.57 – closed above on 16th November 2020.
DJT: 11,623.58 – closed above on 7th October 2020.
Most recently, on 10th May 2021 both DJIA and DJT have made new all time highs. An ongoing bull market is again confirmed by Dow Theory.
Adding in the S&P and Nasdaq for an extended Dow Theory, confirmation of a bull market would require new highs made on a closing basis:
S&P500: 3,393.52 – closed above on 21st August 2020.
Nasdaq: 9,838.37 – closed above on June 8, 2020.
The following major swing lows would need to be seen on a closing basis for Dow Theory to confirm a change from bull to a bear market:
DJIA: 18,213.65
DJT: 6,481.20
Adding in the S&P and Nasdaq for an extended Dow Theory, confirmation of a new bear market would require new lows on a closing basis:
S&P500: 2,191.86
Nasdaq: 6,631.42
Published @ 08:56 p.m. ET.
—
Careful risk management protects your trading account(s).
Follow my two Golden Rules:
1. Always trade with stops.
2. Risk only 1-5% of equity on any one trade.
—
New updates to this analysis are in bold.
—