
S&P 500: Elliott Wave and Technical Analysis | Charts – May 28, 2021
Last week’s analysis expected upwards movement overall to continue, and it has. Although this week failed to make a new all time high, price has moved higher and closed green with a slight increase in volume.
Summary: The trend is up. The next target for the next wave up is at 4,900.
For the short term, price has been consolidating for four weeks with resistance at 4,238 and support at 4,058. While price remains above 4,182.52, it would be most likely that an upwards breakout from the consolidation may occur soon.
A new low below 4,182.52 though may indicate another downwards swing within the consolidation, which may end about either 4,177 or 4,155.
The biggest picture, Grand Super Cycle analysis, is here.
Monthly charts are last updated here with video here.
ELLIOTT WAVE COUNT
WEEKLY CHART
Click chart to enlarge.
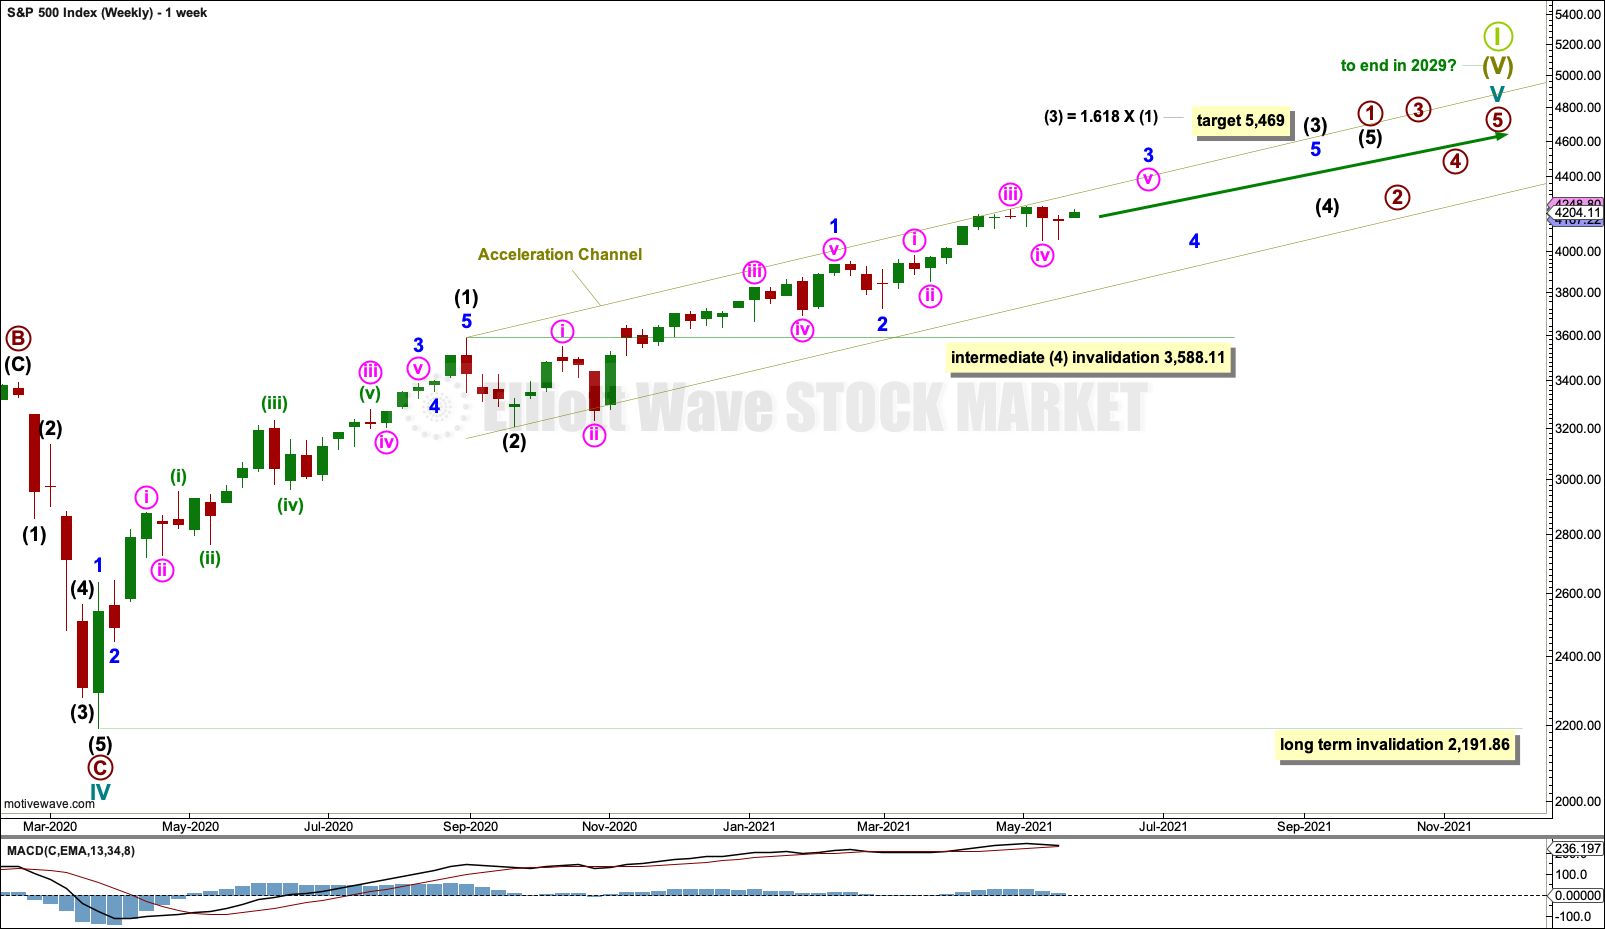
Cycle wave V may last from one to several years. So far it is in its fourteenth month.
This wave count may allow time for the AD line to diverge from price as price makes final highs before the end of the bull market. The AD line most commonly diverges a minimum of 4 months prior to the end of a bull market. A longer divergence is positively correlated with a deeper bear market. A shorter divergence is positively correlated with a more shallow bear market. With zero divergence at this stage, if a surprise bear market does develop here, then it would likely be shallow.
A longer divergence between price and the AD line would be expected towards the end of Grand Super Cycle wave I.
It is possible that cycle wave V may continue until 2029, if the 2020s mirror the 1920s. Either March or October 2029 may be likely months for the bull market to end.
Cycle wave V would most likely subdivide as an impulse. But if overlapping develops, then an ending diagonal should be considered. This chart considers the more common impulse.
There is already a Fibonacci ratio between cycle waves I and III within Super Cycle wave (V). The S&P500 often exhibits a Fibonacci ratio between two of its actionary waves but rarely between all three; it is less likely that cycle wave V would exhibit a Fibonacci ratio. The target for Super Cycle wave (V) to end would best be calculated at primary degree, but that cannot be done until all of primary waves 1, 2, 3 and 4 are complete.
Primary wave 1 within cycle wave V may be incomplete. This gives a very bullish wave count, expecting a long duration for cycle wave V which has not yet passed its middle strongest portion.
Within primary wave 1: Intermediate waves (1) and (2) may be complete, and intermediate wave (3) may now be nearing an end.
Within intermediate wave (3): Minor waves 1 and 2 may be complete, and minor wave 3 may be nearing an end.
Intermediate wave (4) may not move into intermediate wave (1) price territory below 3,588.11.
An acceleration channel is drawn about cycle wave V. Draw the first trend line from the end of intermediate wave (1) to the last high, then place a parallel copy on the end of intermediate wave (2). Keep redrawing the channel as price continues higher. When primary wave 1 is complete, then this channel would be drawn using Elliott’s first technique. The channel may then be used to provide confidence that primary wave 1 may be over and primary wave 2 may have arrived; when the channel is breached by downwards movement it would indicate a trend change.
When primary wave 1 may be complete, then a multi-month pullback or consolidation may unfold for primary wave 2. It is possible that primary wave 2 may meet the technical definition of a bear market; it may correct to 20% or more of market value.
Primary wave 2 may not move beyond the start of primary wave 1 below 2,191.86.
DAILY CHART
Click chart to enlarge.
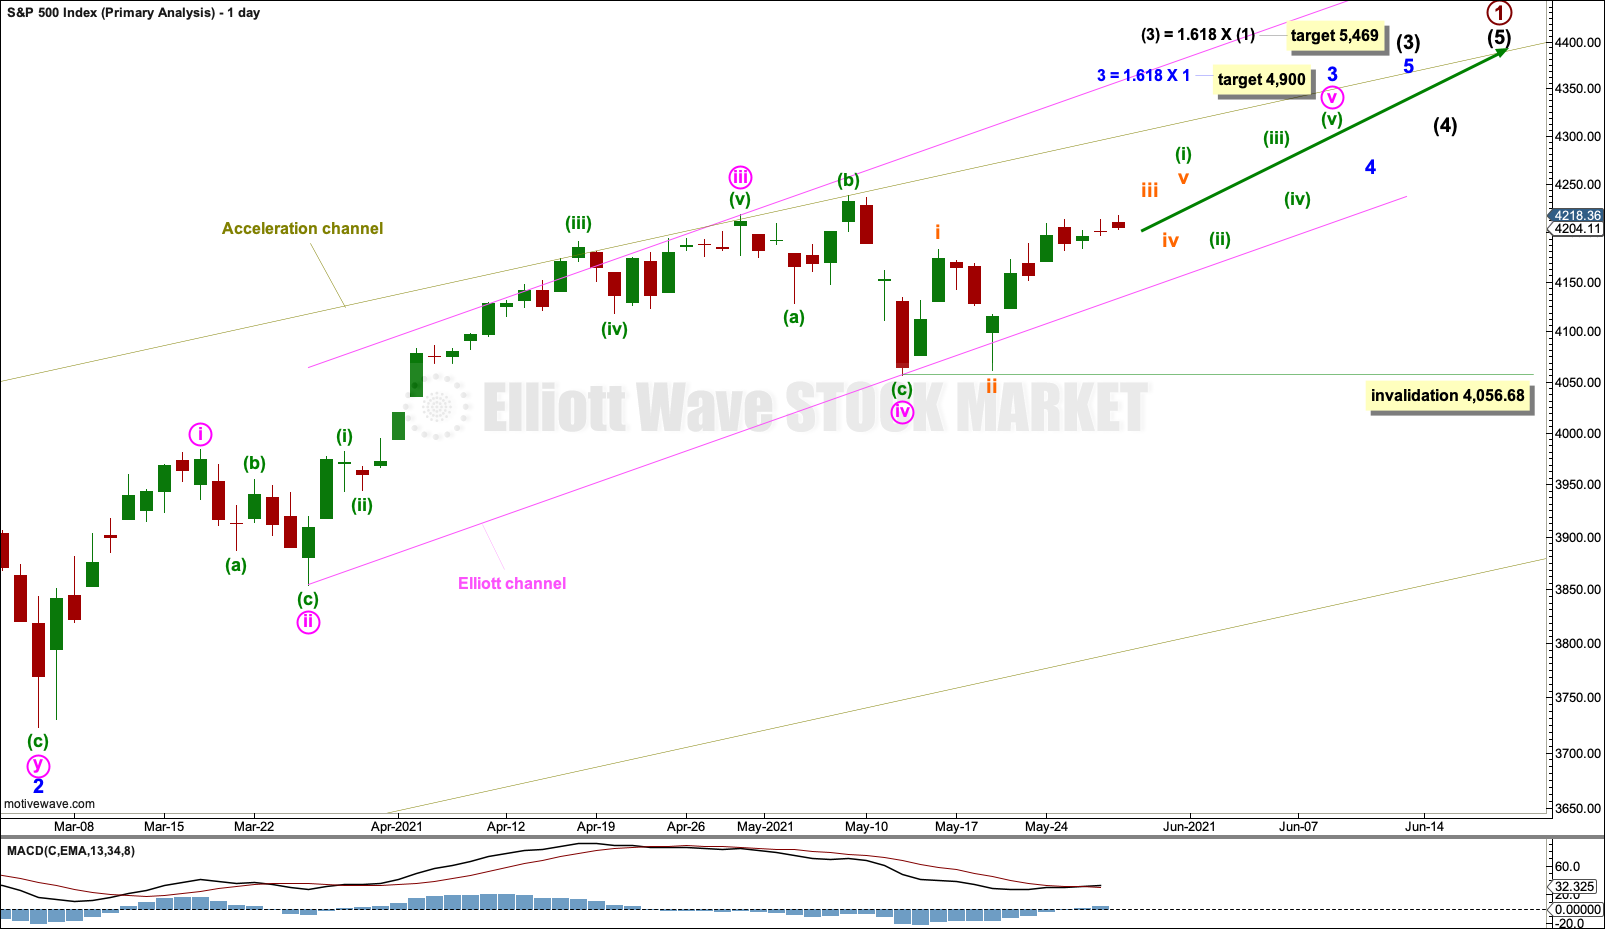
The daily chart focusses on minor wave 3 within intermediate wave (3).
Intermediate wave (3) may be extending. Third waves are most commonly extended for the S&P500, so this wave count follows a common tendency. A target is calculated for minor wave 3, which is also expected to be extending.
No second wave correction within minute wave v may move beyond its start below 4,056.68.
Now that minute wave iv may be complete, as it overshot a channel drawn using Elliott’s first technique, redraw the channel now using Elliott’s second technique. Draw the first trend line from the ends of minute waves ii to iv, then place a parallel copy on the end of minute wave iii. This redrawn channel may show where minute wave v may end, either mid way within the channel or about the upper edge. It may then be used to confirm a subsequent trend change, when it is breached by downwards movement.
The channel is overshot, which for this market is acceptable, and price has moved back within the channel. This market does not always sit neatly within channels as its impulses come to an end. It is possible that as minor wave 3 ends channels may need to be redrawn.
HOURLY CHART
Click chart to enlarge.
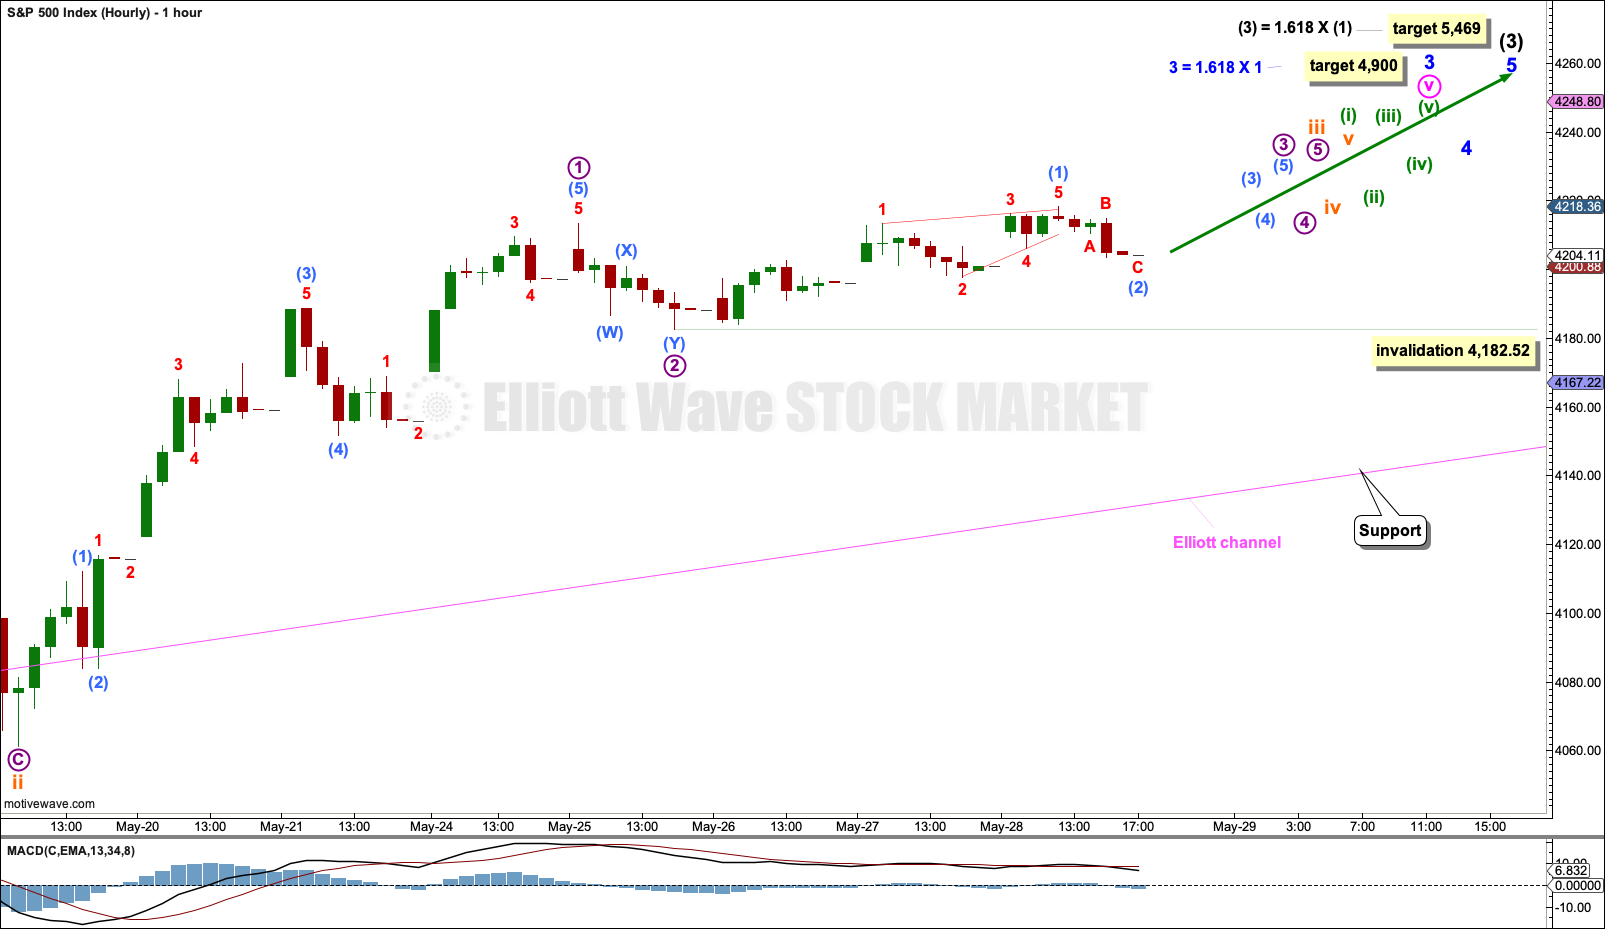
The target for minor wave 3 expects it to exhibit a common Fibonacci ratio to minor wave 1.
Minute wave v is expected to be a long extension. Minuette wave (i) within minute wave v may be incomplete and may be subdividing as an impulse or leading diagonal.
Within minuette wave (i): Subminuette waves i and ii may be complete, and subminuette wave iii may only subdivide as an impulse.
Within subminuette wave iii: Micro waves 1 and 2 may be complete, and micro wave 3 may now continue higher.
Sub-micro waves (1) and (2) within micro wave 3 may be complete. If sub-micro wave (2) moves lower, then it may not move beyond the start of sub-micro wave (1) below 4,182.52.
At this stage, this analysis expects a third wave up at three low degrees, within a first wave.
ALTERNATE HOURLY CHART
Click chart to enlarge.
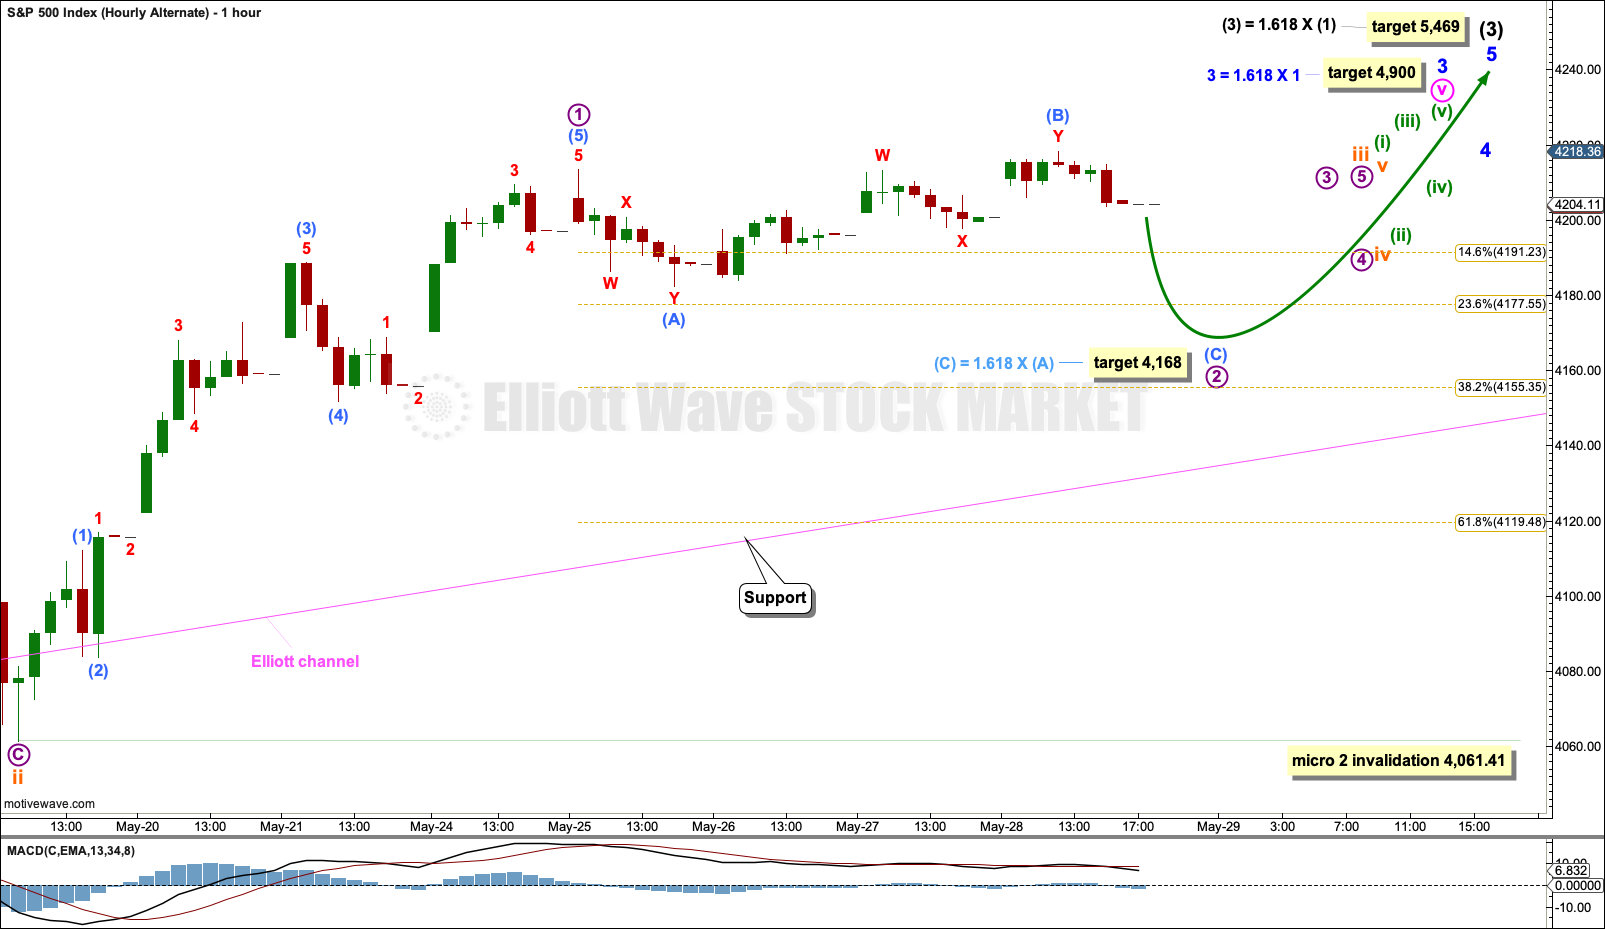
If the main hourly wave count is invalidated with a new low below 4,182.52, then this alternate may be used.
Within subminuette wave iii: Micro wave 1 may be complete, and micro wave 2 may continue a little lower next week.
Micro wave 2 may be unfolding as a flat. Sub-micro wave (B) within micro wave 2 has moved beyond the start of sub-micro wave (A). Sub-micro wave (B) is a 1.16 length of sub-micro wave (A), indicating micro wave 2 may be unfolding as an expanded flat. The most common Fibonacci ratio for sub-micro wave (C) to exhibit would be 1.618 the length of sub-micro wave (A) at 4,168.
Micro wave 2 may not move beyond the start of micro wave 1 below 4,061.41.
TECHNICAL ANALYSIS
MONTHLY CHART
Click chart to enlarge. Chart courtesy of StockCharts.com.
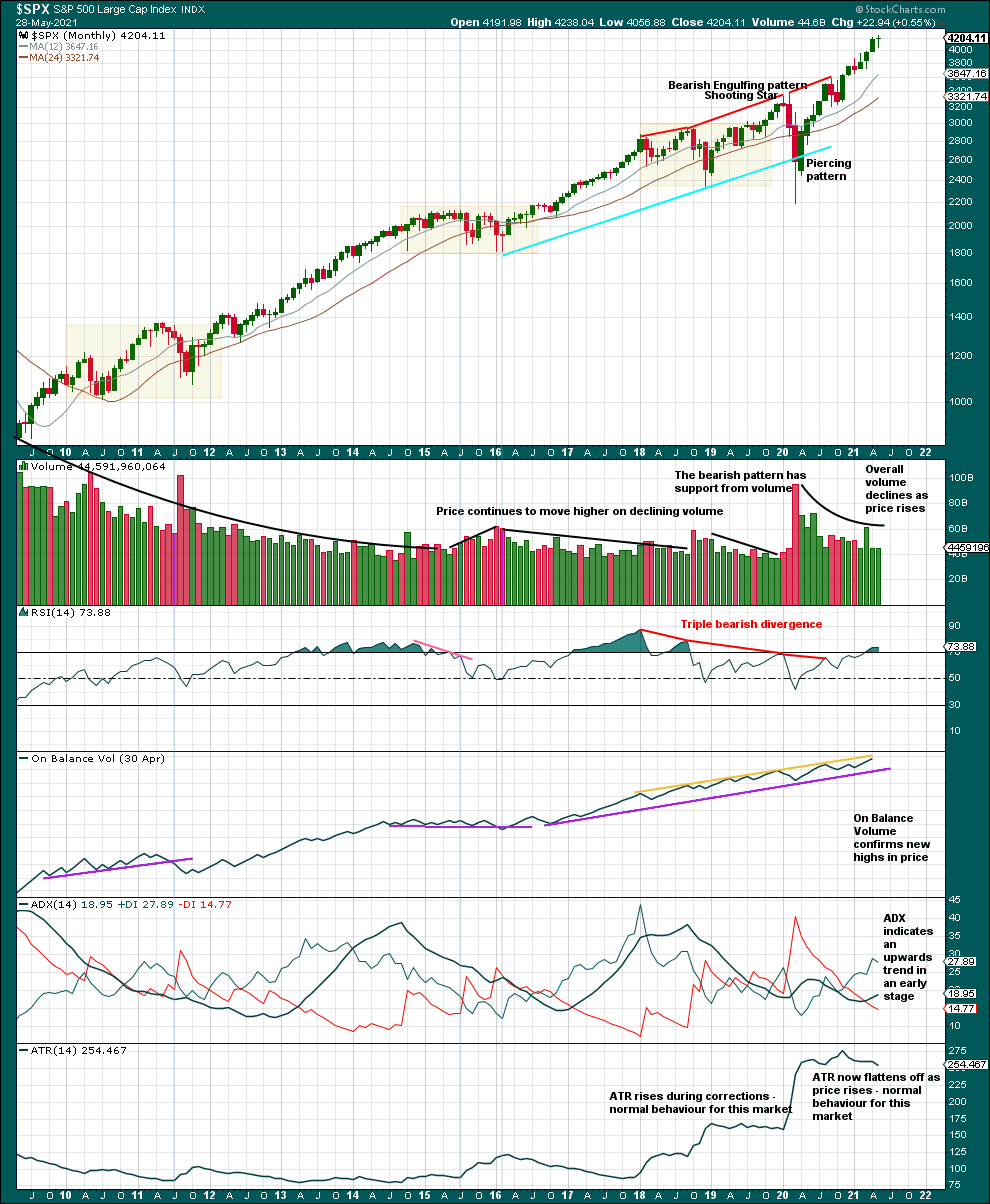
With the NYSE closed on Monday the 31st of May for Memorial Day, Friday is the last trading day of May for the S&P500.
May 2021 monthly candlestick closes as a small green doji. This on its own is not a bearish candlestick reversal pattern. This represents a pause, a balance of bulls and bears. There are six other monthly candlesticks on this chart that closed as doji within the context of an upwards trend; these are circled in yellow on the chart. Two of the six examples come near important highs, whereas the other four are either close to lows or within the body of the trend. This is pointed out here to illustrate that this month’s doji is not necessarily bearish, and that there is precedent in this chart where it has occurred before and was not a bearish signal.
Strong triple bearish divergence up to September 2020 led to only a very small pullback, before the upwards trend resumed. This is a good example of how divergence even when strong and over a reasonable period of time does not always lead to a bear market.
ADX is bullish. RSI is just recently overbought, but this may become more extreme and remain so for a long time. This market has a strong bullish bias.
WEEKLY CHART
Click chart to enlarge. Chart courtesy of StockCharts.com.
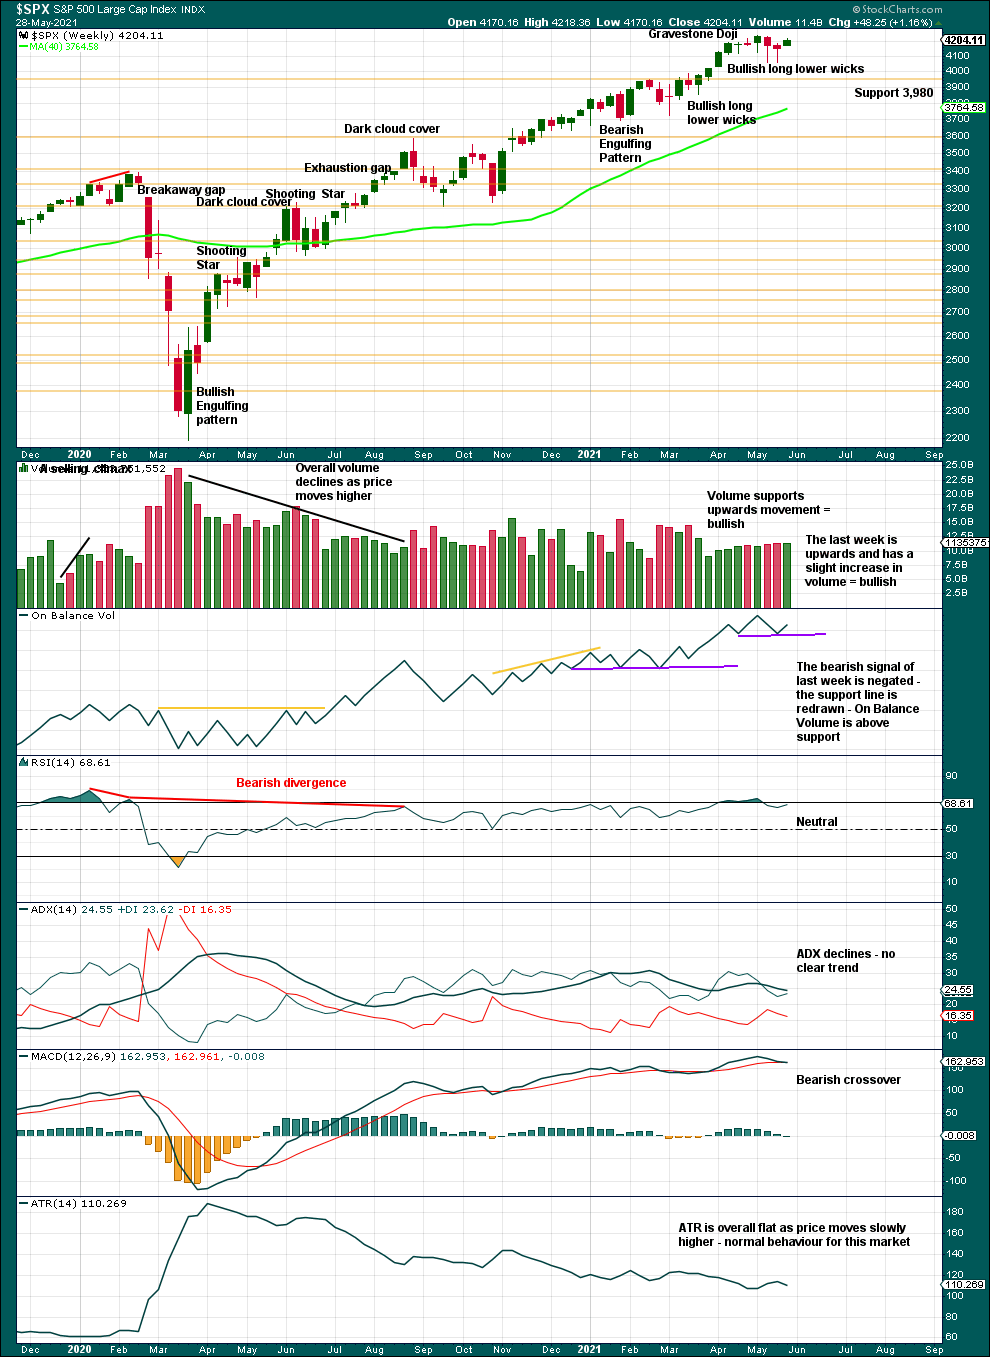
A series of higher highs and higher lows off the low of March 2020 continues. The last short-term swing low is now at 3,723.34. While this remains intact, the dominant view should be of an upwards trend. There is a long way for this trend to run before conditions may become extreme.
This chart has the look of a sustainable bull market in a relatively early stage; there is as yet no evidence that a larger correction should begin here. Although RSI very recently reached overbought, this market has a strong bullish bias and RSI can move deeply overbought and remain there for years prior to the bull market ending.
Now two long lower wicks on two weekly candlesticks are bullish for the short term.
For the short term, price looks to be in a small consolidation with support about 4,057 and resistance at the last all time high about 4,238. With the larger trend upwards, it would be most likely this consolidation may resolve with an upwards breakout.
DAILY CHART
Click chart to enlarge. Chart courtesy of StockCharts.com.
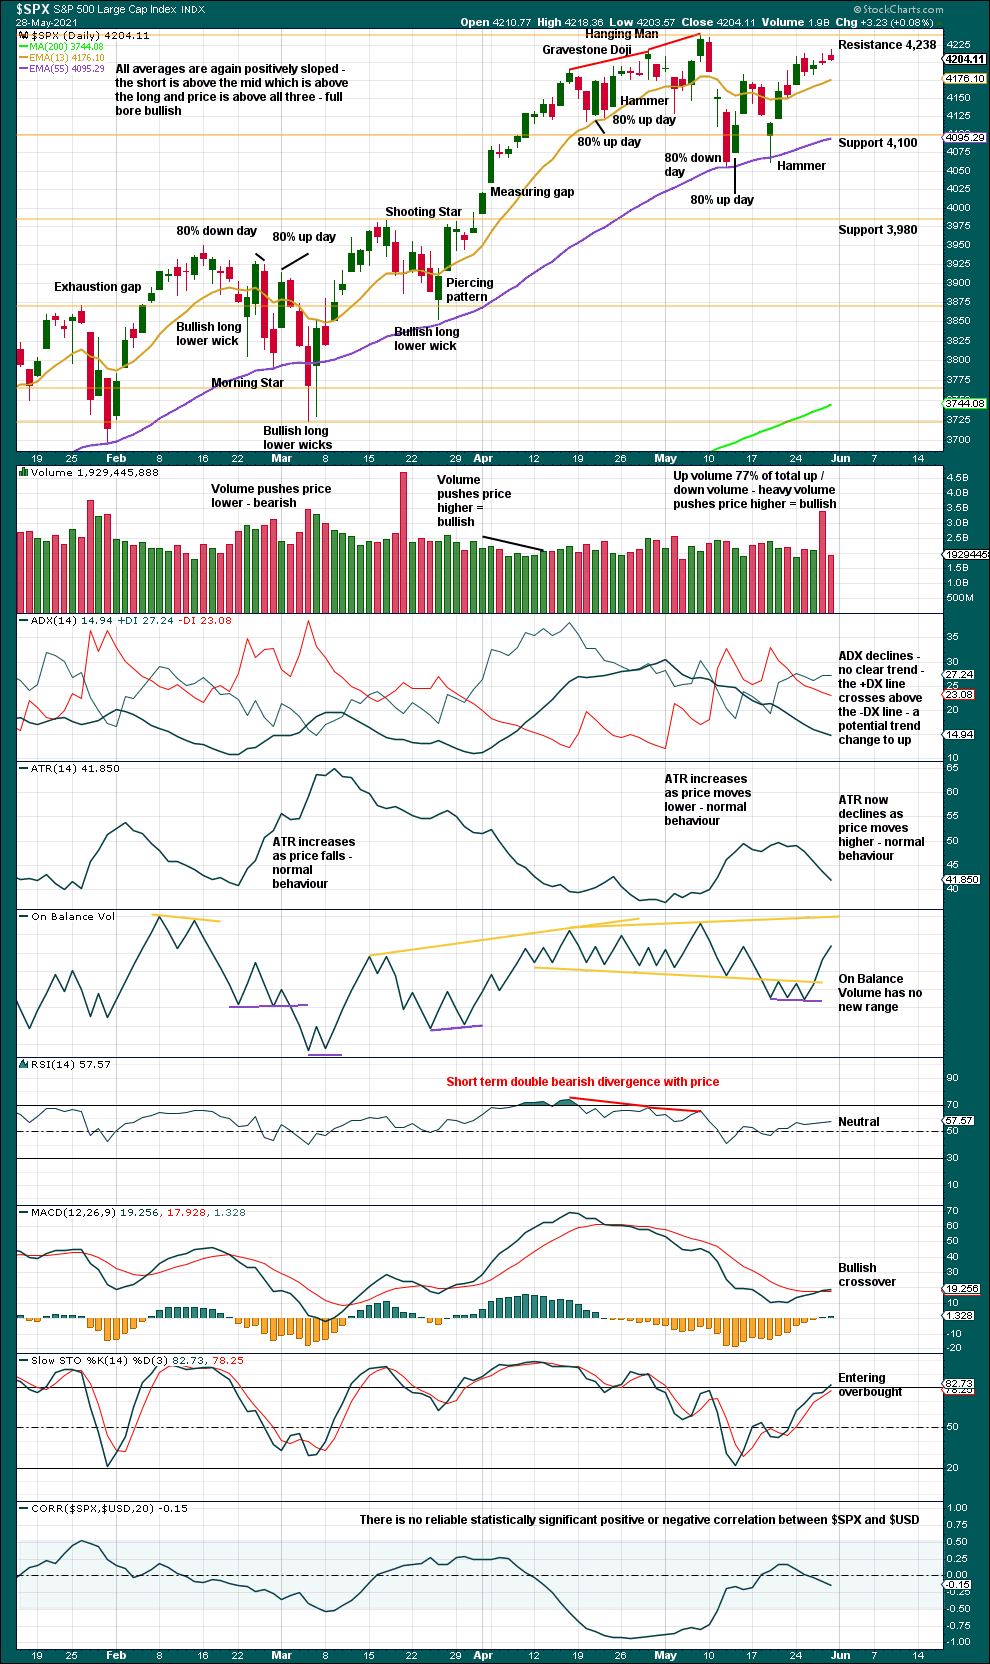
The series of higher highs and higher lows from the low of the 30th of October continues.
Pullbacks and consolidations are a normal and to be expected part of a bullish trend.
If the consolidation continues, then a downwards swing within it may develop about here. A close above resistance at 4,238.04 would constitute an upwards breakout from the consolidation; if that happens, then upwards momentum may show some increase.
BREADTH – AD LINE
WEEKLY CHART
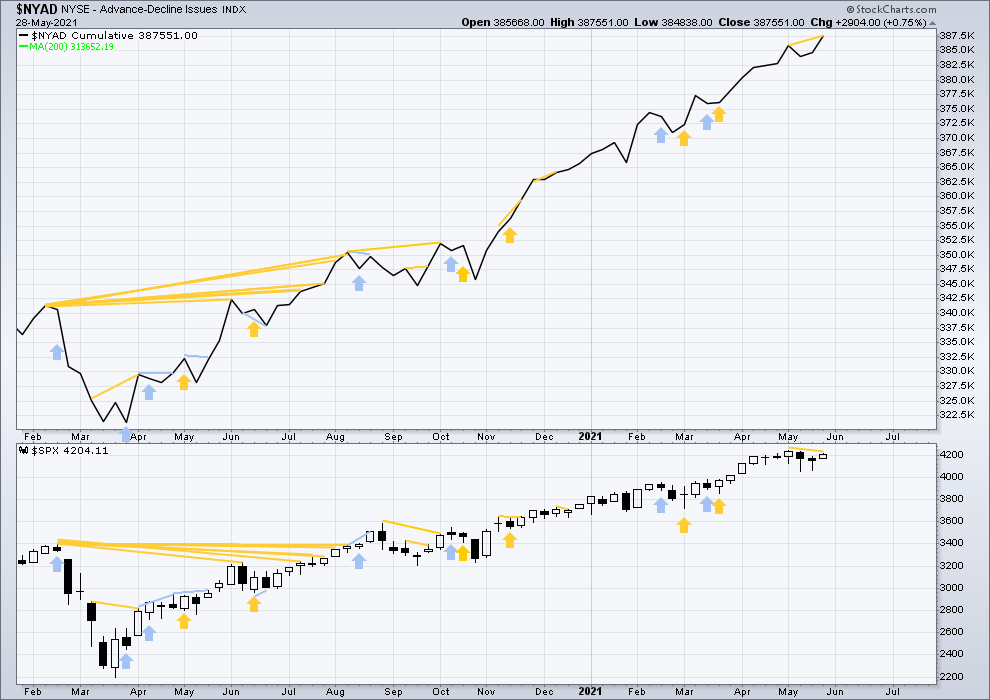
Click chart to enlarge. Chart courtesy of StockCharts.com. So that colour blind members are included, bearish signals will be noted with blue and bullish signals with yellow.
Breadth should be read as a leading indicator.
Lowry’s Operating Companies Only AD line has made a new all time high on the 27th of May. This supports the Elliott wave counts.
Large caps all time high: 4,238.04 on May 7, 2021.
Mid caps all time high: 2,778.84 on April 29, 2021.
Small caps all time high: 1,399.31 on March 12, 2021.
The last new high is found in large caps only. Small caps have been lagging since the 15th of March. Mid caps have been lagging since the 29th of April. This lag from small and mid caps is not precise in terms of timing when a pullback may begin, but it is an early warning sign of some developing weakness. It would be expected that as third waves come to an end some weakness should begin to develop; this situation may fit with the Elliott wave count.
This week the AD line has made a new all time high, but price has not. This is a strong bullish signal and supports the Elliott wave count.
DAILY CHART
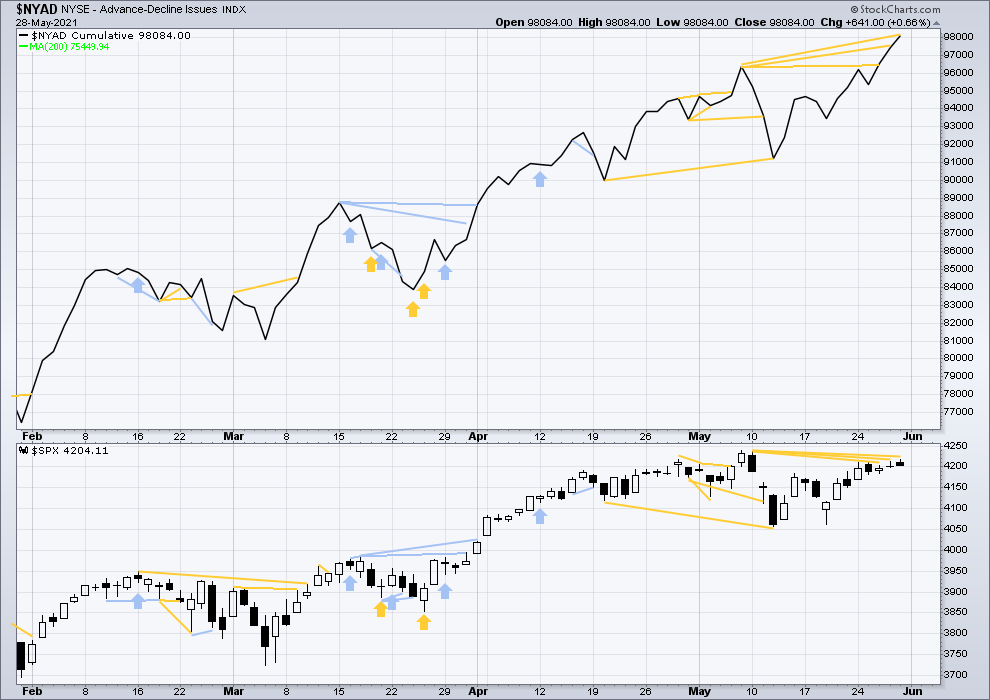
Click chart to enlarge. Chart courtesy of StockCharts.com. So that colour blind members are included, bearish signals will be noted with blue and bullish signals with yellow.
The NYSE all issues AD line has for the third day in a row made a new all time high. This is bullish and supports the Elliott wave count.
In addition, on the 27th of May it was small caps which were strongest. On the 27th of May small caps made a new high above their prior swing high of the 10th of May, but mid and large caps did not. This also supports the Elliott wave count. Strength in small caps is a feature of an early stage bull market.
VOLATILITY – INVERTED VIX CHART
WEEKLY CHART
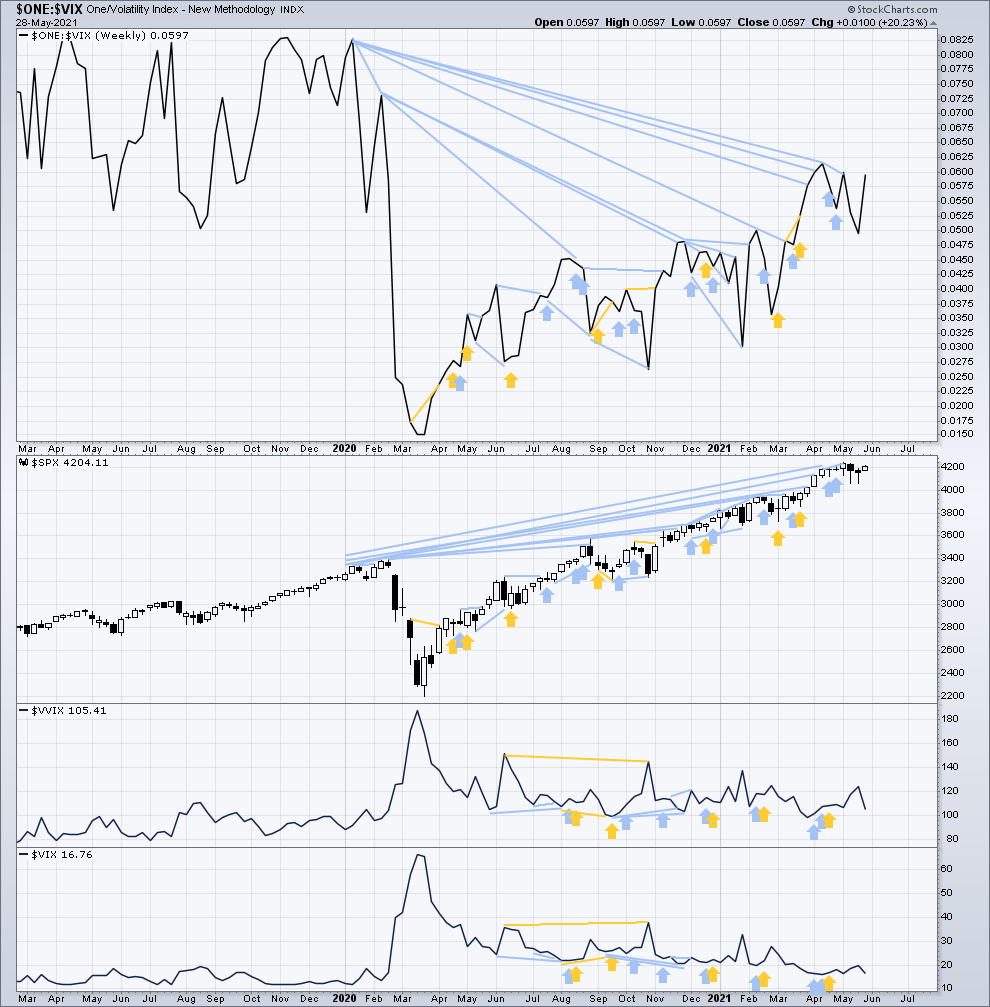
Click chart to enlarge. Chart courtesy of StockCharts.com. So that colour blind members are included, bearish signals will be noted with blue and bullish signals with yellow.
Inverted VIX remains well below all time highs. The all time high for inverted VIX was in the week beginning October 30, 2017. There is over 3 years of bearish divergence between price and inverted VIX. This bearish divergence may develop further before the bull market ends. It may be a very early indicator of an upcoming bear market, but it is not proving to be useful in timing.
This week both price and inverted VIX have moved higher. Upwards movement in price is coming with a normal corresponding decline in volatility. This supports the Elliott wave count.
Comparing VIX and VVIX at the weekly chart level:
This week both VIX and VVIX have moved lower. There is no new divergence.
DAILY CHART
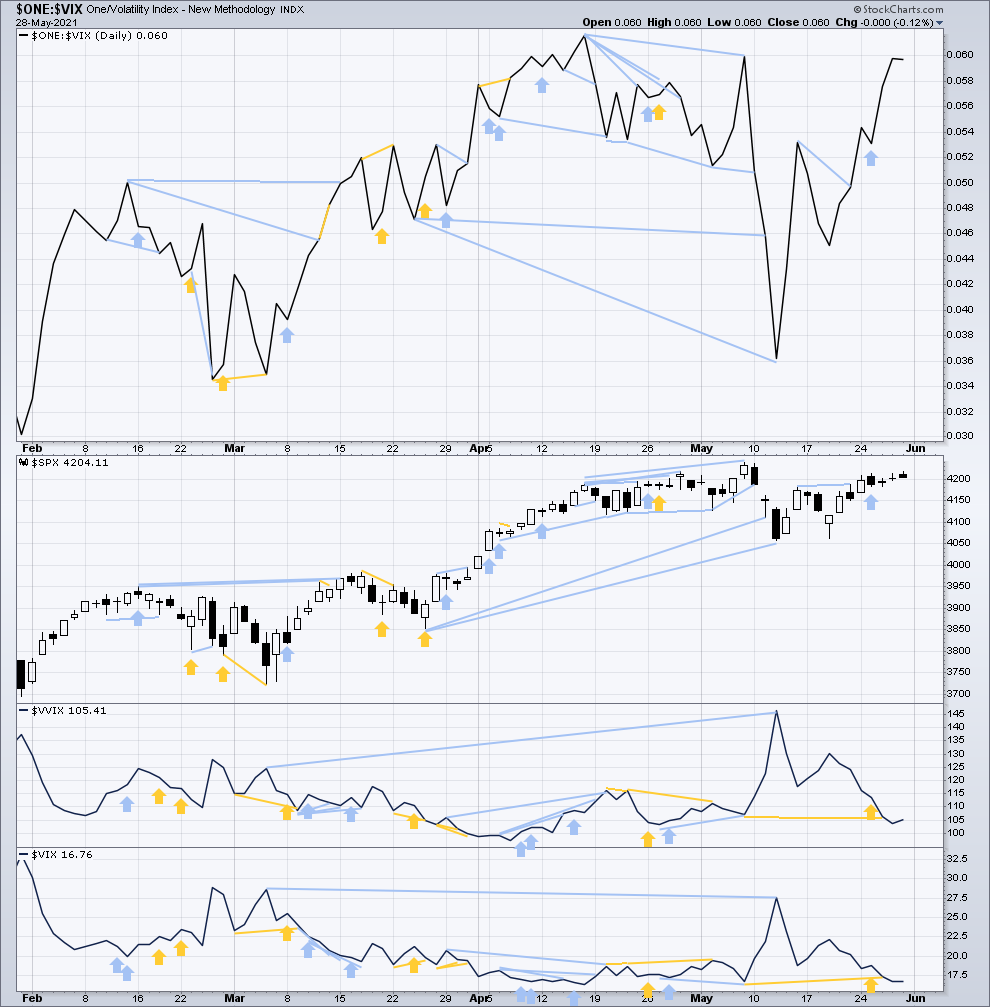
Click chart to enlarge. Chart courtesy of StockCharts.com. So that colour blind members are included, bearish signals will be noted with blue and bullish signals with yellow.
On Friday price has moved higher although the candlestick closed red. Inverted VIX is flat. This is not considered strong enough to note as divergence.
Comparing VIX and VVIX at the daily chart level:
To end the week both VIX and VVIX have moved lower. There is no new divergence.
DOW THEORY
Dow Theory confirms a new bull market with new highs made on a closing basis:
DJIA: 29,568.57 – closed above on 16th November 2020.
DJT: 11,623.58 – closed above on 7th October 2020.
Most recently, on 10th May 2021 both DJIA and DJT have made new all time highs. An ongoing bull market is again confirmed by Dow Theory.
Adding in the S&P and Nasdaq for an extended Dow Theory, confirmation of a bull market would require new highs made on a closing basis:
S&P500: 3,393.52 – closed above on 21st August 2020.
Nasdaq: 9,838.37 – closed above on June 8, 2020.
The following major swing lows would need to be seen on a closing basis for Dow Theory to confirm a change from bull to a bear market:
DJIA: 18,213.65
DJT: 6,481.20
Adding in the S&P and Nasdaq for an extended Dow Theory, confirmation of a new bear market would require new lows on a closing basis:
S&P500: 2,191.86
Nasdaq: 6,631.42
Published @ 08:40 p.m. ET.
—
Careful risk management protects your trading account(s).
Follow my two Golden Rules:
1. Always trade with stops.
2. Risk only 1-5% of equity on any one trade.
—
New updates to this analysis are in bold.
—