
S&P 500: Elliott Wave and Technical Analysis | Charts – April 30, 2021
Price has closed back within a prior consolidation zone.
The main Elliott wave count still has the same target. The alternate Elliott wave count remains valid.
Summary: The wave count expects a third wave at three large degrees may have moved through its middle and may now be completing.
A small correction may have been over at the last low and price may continue upwards from here to a target at 4,276.
The next mid-term target for the upwards trend is at 4,464 or 4,922. About one of these targets another multi-week pullback or consolidation may develop.
The biggest picture, Grand Super Cycle analysis, is here.
Monthly charts are last updated here with video here.
MAIN WAVE COUNT
WEEKLY CHART
Click chart to enlarge.
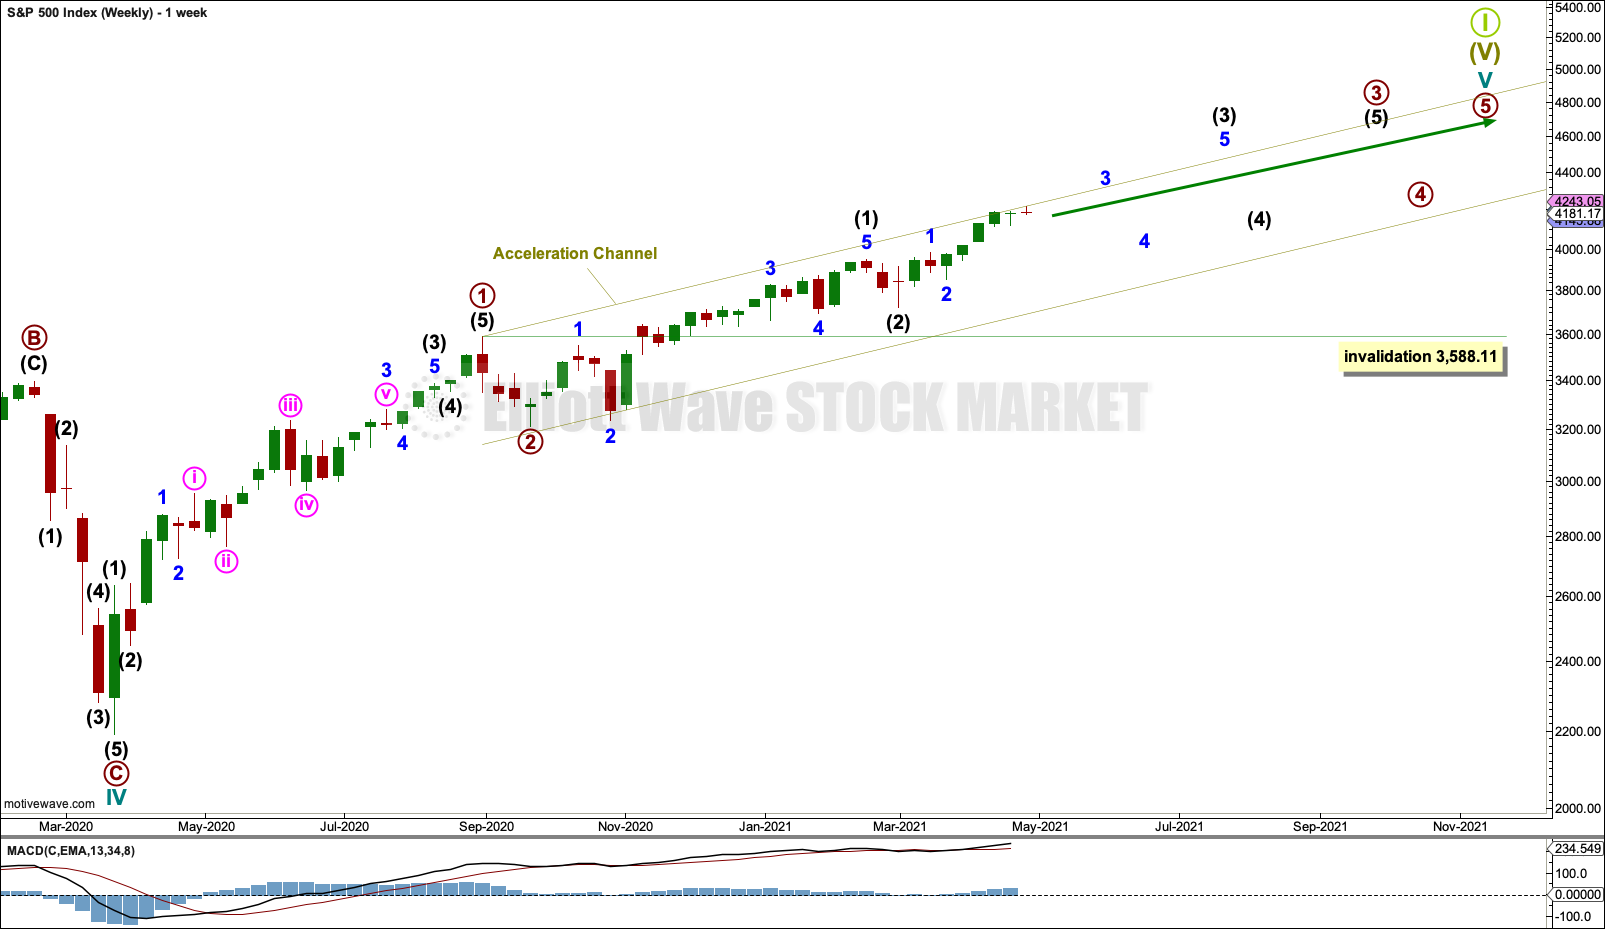
Cycle wave V may last from one to several years. So far it is in its thirteenth month.
This wave count may allow time for the AD line to diverge from price as price makes final highs before the end of the bull market. The AD line most commonly diverges a minimum of 4 months prior to the end of a bull market. A longer divergence is positively correlated with a deeper bear market. A shorter divergence is positively correlated with a more shallow bear market. With zero divergence at this stage, if a surprise bear market does develop here, then it would likely be shallow.
A longer divergence between price and the AD line would be expected towards the end of Grand Super Cycle wave I.
It is possible that cycle wave V may continue until 2029, if the 2020s mirror the 1920s (although the alternate weekly wave count fits this expectation better).
Cycle wave V would most likely subdivide as an impulse. But if overlapping develops, then an ending diagonal should be considered. This chart considers the more common impulse.
Primary waves 1 and 2 may be complete.
Primary wave 3 may only subdivide as an impulse.
Primary wave 3 has now moved well above the end of primary wave 1. Primary wave 4 may not move into primary wave 1 price territory below 3,588.11.
There is already a Fibonacci ratio between cycle waves I and III within Super Cycle wave (V). The S&P500 often exhibits a Fibonacci ratio between two of its actionary waves but rarely between all three; it is less likely that cycle wave V would exhibit a Fibonacci ratio. The target for Super Cycle wave (V) to end would best be calculated at primary degree, but that cannot be done until all of primary waves 1, 2, 3 and 4 are complete.
An acceleration channel is drawn about cycle wave V. Draw the first trend line from the end of primary wave 1 to the last high, then place a parallel copy on the end of primary wave 2. Keep redrawing the channel as price continues higher. When primary wave 3 is complete, then this channel would be drawn using Elliott’s first technique and may show were primary wave 4 may find support.
FIRST DAILY CHART
Click chart to enlarge.
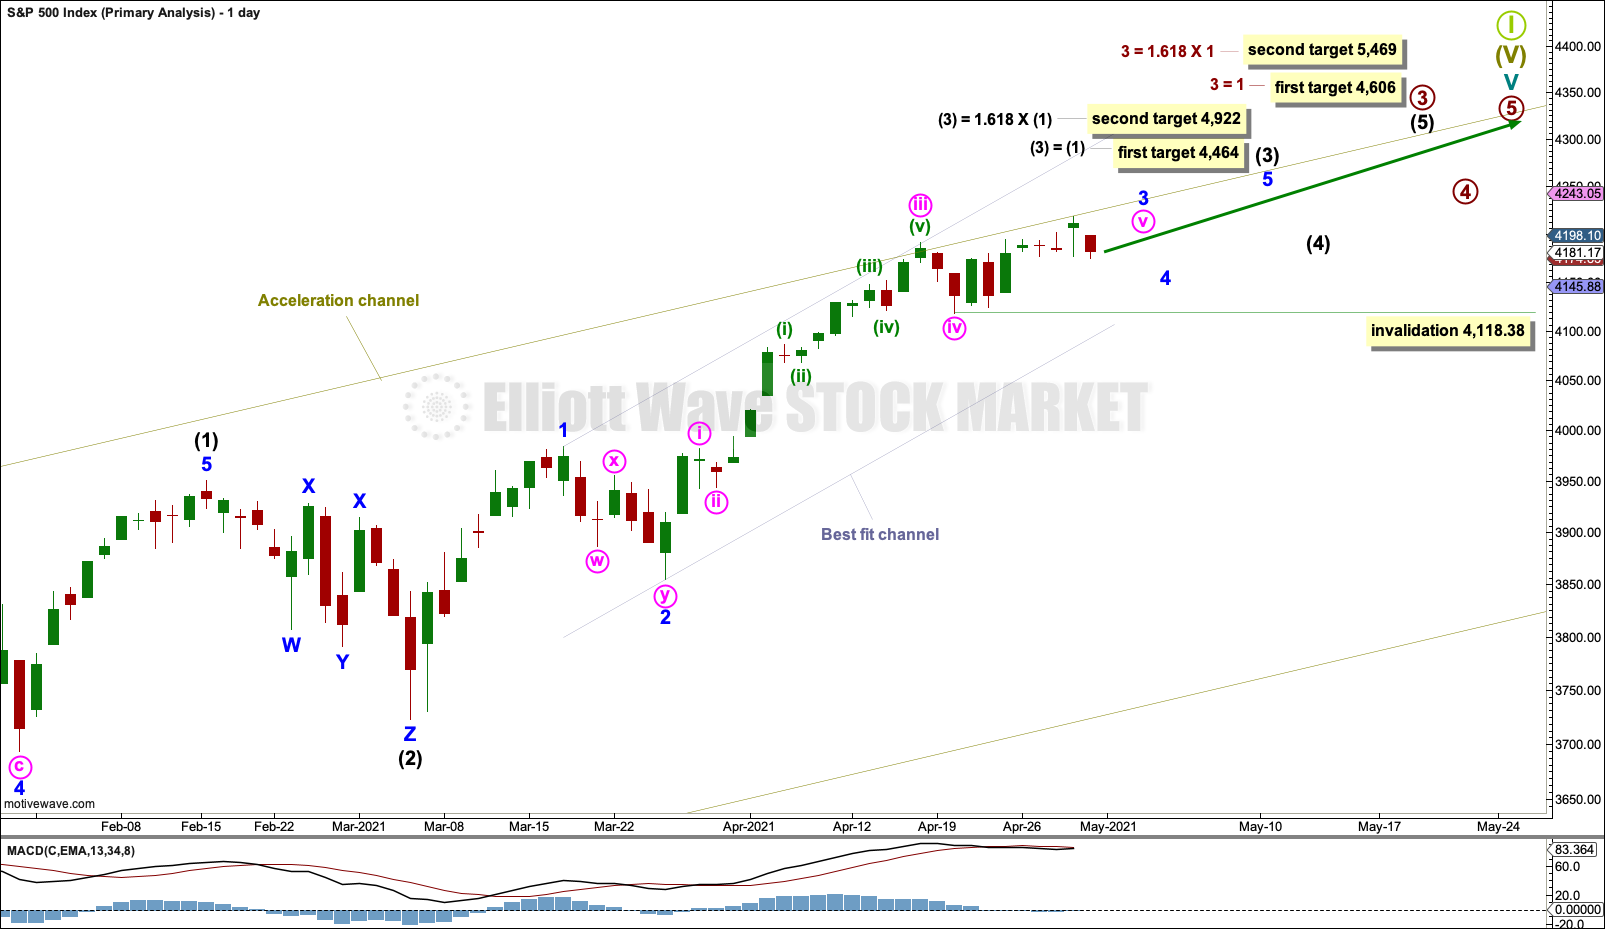
The daily chart focusses on the unfolding impulse of primary wave 3 from the end of intermediate wave (1) within it.
Intermediate wave (1) within primary wave 3 may be complete.
Intermediate wave (2) may also be complete as a triple zigzag.
Intermediate wave (3) within primary wave 3 may now be underway and may have passed its middle.
Minor waves 1 and 2 within intermediate wave (3) may now be complete. When it arrives, then minor wave 4 may last about one to two weeks and may not move into minor wave 1 price territory below 3,983.87. While minor wave 5 continues, then within it no second wave correction may move beyond its start below 4,118.38.
Targets are calculated for intermediate wave (3) and for primary wave 3. As price approaches the first target for intermediate wave (3) and if the structure is complete and technical analysis suggests a pullback may occur, then the target may be useful. But if price moves through the first target or the structure is incomplete, then the second target may be used.
When minor wave 4 may be complete, then the target for intermediate wave (3) may also be calculated at minor degree. At that stage, the target may widen to a zone or it may change.
Draw a best fit channel about intermediate wave (3) as shown. Draw the first trend line from the end of minor wave 1 to the end of minute wave iii, then place a parallel copy on the end of minor wave 2.
FIRST HOURLY CHART
Click chart to enlarge.
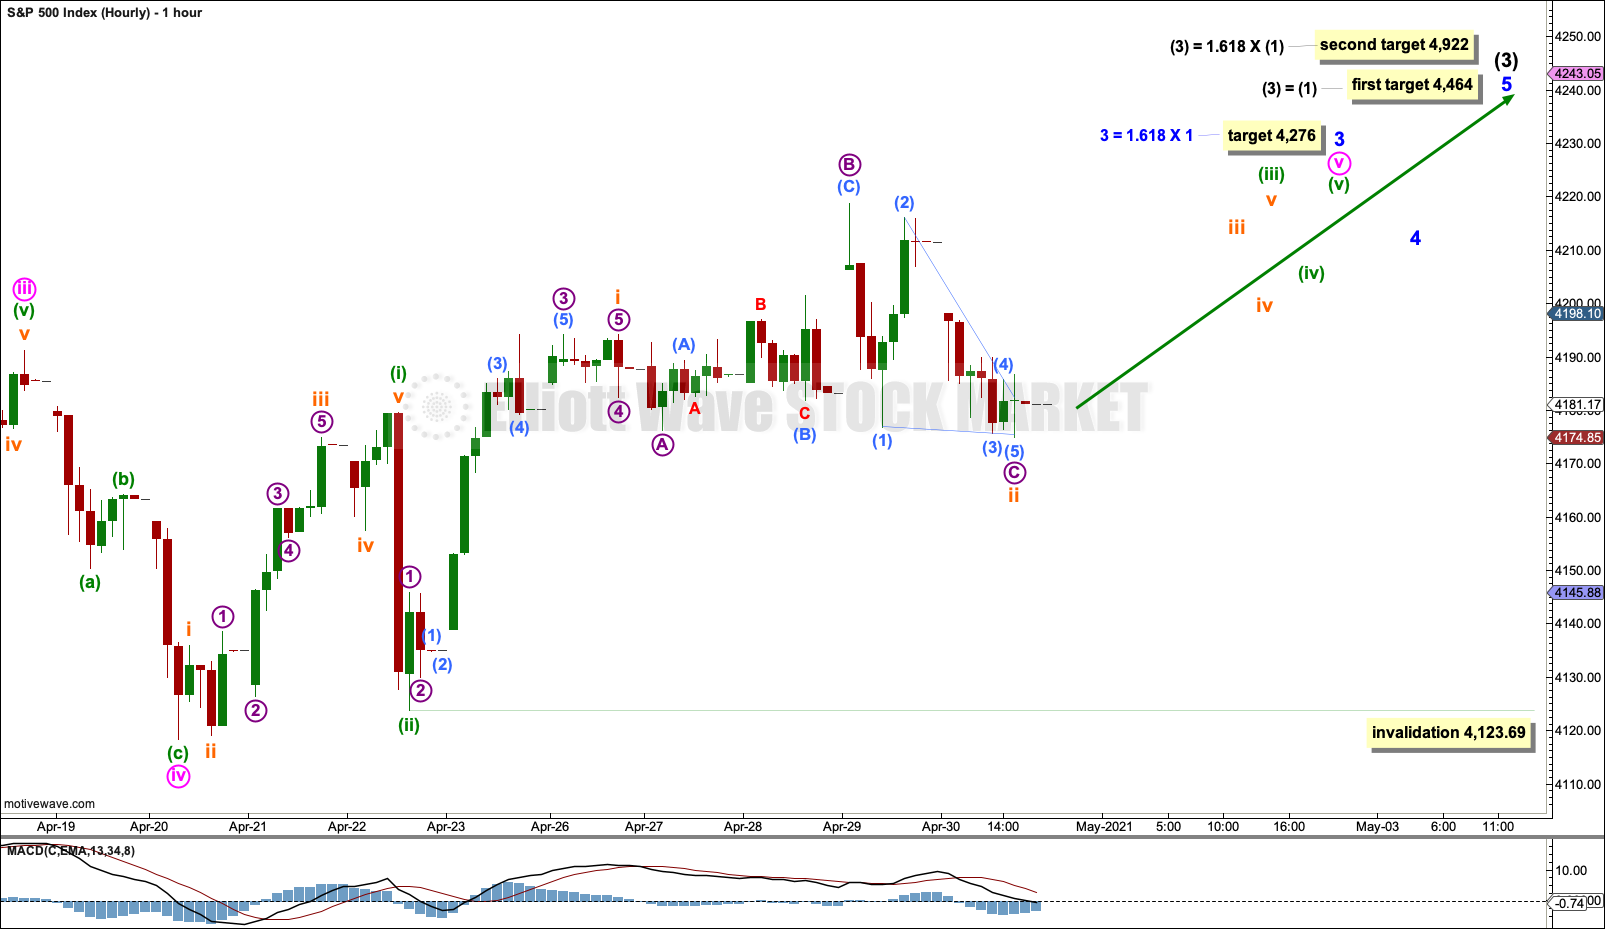
A target is calculated for minor wave 3 to reach a common Fibonacci ratio to minor wave 1.
Minuette waves (i) and (ii) within minute wave v may be complete. Subminuette waves i and ii within minuette wave (iii) may be complete. If subminuette wave ii moves lower, then it may not move beyond the start of subminuette wave i below 4,123.69.
This wave count now expects the middle of a third wave at two low degrees to unfold higher next week. An increase in upwards momentum is possible.
SECOND DAILY CHART
Click chart to enlarge.
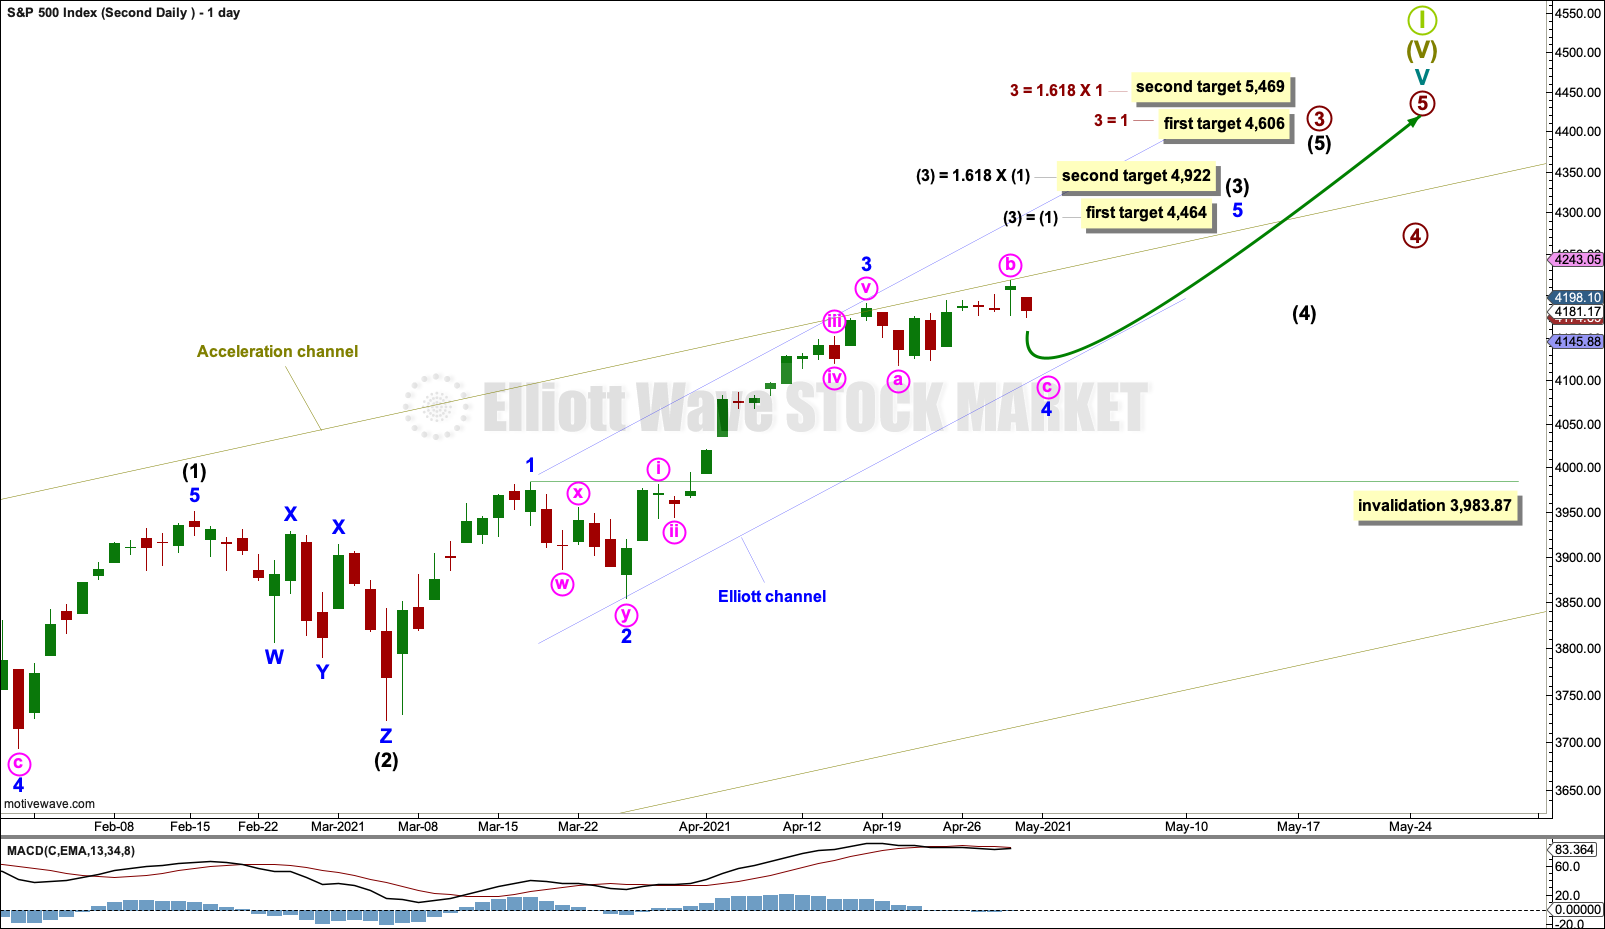
This wave count is now named as a second, rather than an alternate. The first and second wave counts may be of about even probability.
It remains possible that minor wave 3 may be over and minor wave 4 may continue further as an expanded flat. Minor wave 4 may not move into minor wave1 price territory below 3,983.87.
Minor wave 4 may continue for a few more days. It would be extremely likely that minute wave c would make at least a slight new low below the end of minute wave a at 4,118.38 to avoid a truncation and a very rare running flat.
SECOND HOURLY CHART
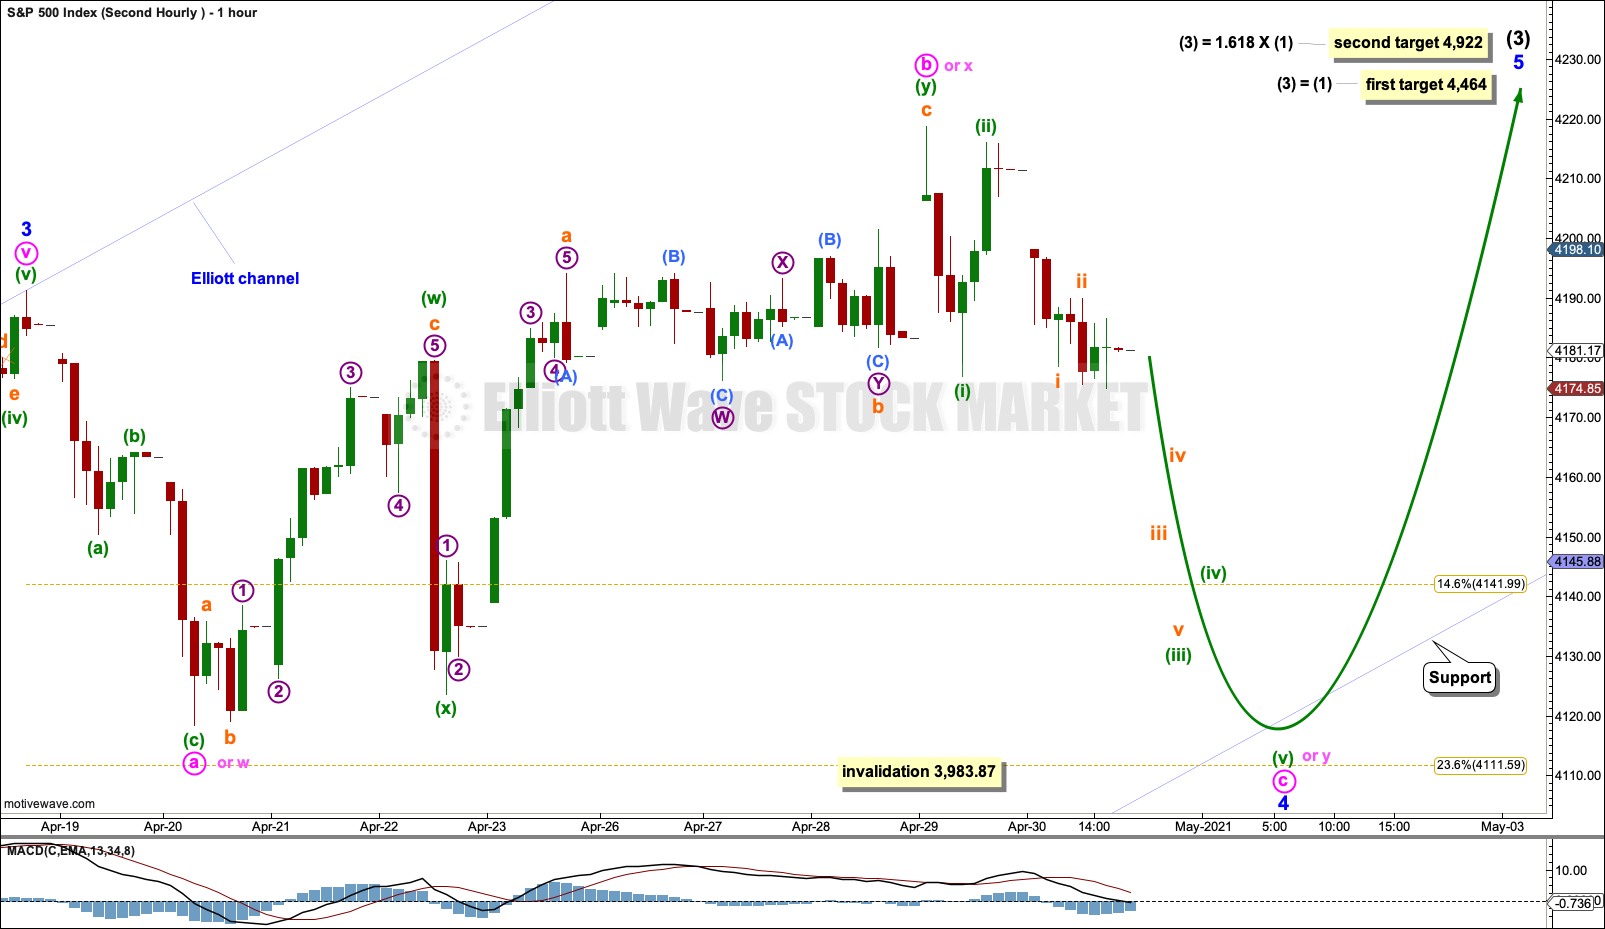
Click chart to enlarge.
If minor wave 4 has begun, then it may exhibit close proportion to minor wave 2 so that the wave count has the right look at higher time frames. Minor wave 2 was a shallow 0.50 double zigzag lasting 6 sessions. Minor wave 4 may be more shallow and may last about one to two weeks (possibly three). Minor wave 4 may exhibit alternation as a more time consuming triangle or combination, or it may exhibit alternation as a quicker flat. So far it has lasted 9 sessions.
Minor wave 4 may be unfolding as an expanded flat. Minute waves a and b may both be complete zigzags; minute wave b is now a 1.38 length of minute wave a. Minute wave c would be extremely likely to move at least slightly below the end of minute wave a at 4,118.38 to avoid a truncation and a very rare running flat. At 4,101 minute wave c would reach 1.618 the length of minute wave a; this may see minor wave 4 end about support at the lower edge of the blue Elliott channel, which is copied over from the daily chart.
If minor wave 4 is unfolding as a double combination, then the first structure in a double may be a complete zigzag, labelled minute wave w. The double may now be joined by a complete three in the opposite direction, a double zigzag labelled minute wave x. The second structure in a double, labelled minute wave y, may now continue sideways as a flat or triangle, to end about the same level as the first at 4,118.38.
If minor wave 4 is unfolding as a triangle, then waves a and b may be complete. Minute wave b may have moved higher today to make another new high above the start of minute wave a indicating a running triangle. Wave c downwards may now unfold and may not move below the end of wave a at 4,118.38. Wave d upwards may then unfold and may not move beyond the end of wave b at 4,218.78. Wave e downwards may then unfold and may not move below the end of wave c. Sideways movement in an ever decreasing range may continue for another one to two weeks.
As minor wave 4 continues, alternate hourly wave counts may be required to outline the different structural possibilities. It is still not possible to know which structure minor wave 4 may be.
Minor wave 4 may not move into minor wave 1 price territory below 3,983.87.
ALTERNATE WAVE COUNT
WEEKLY CHART
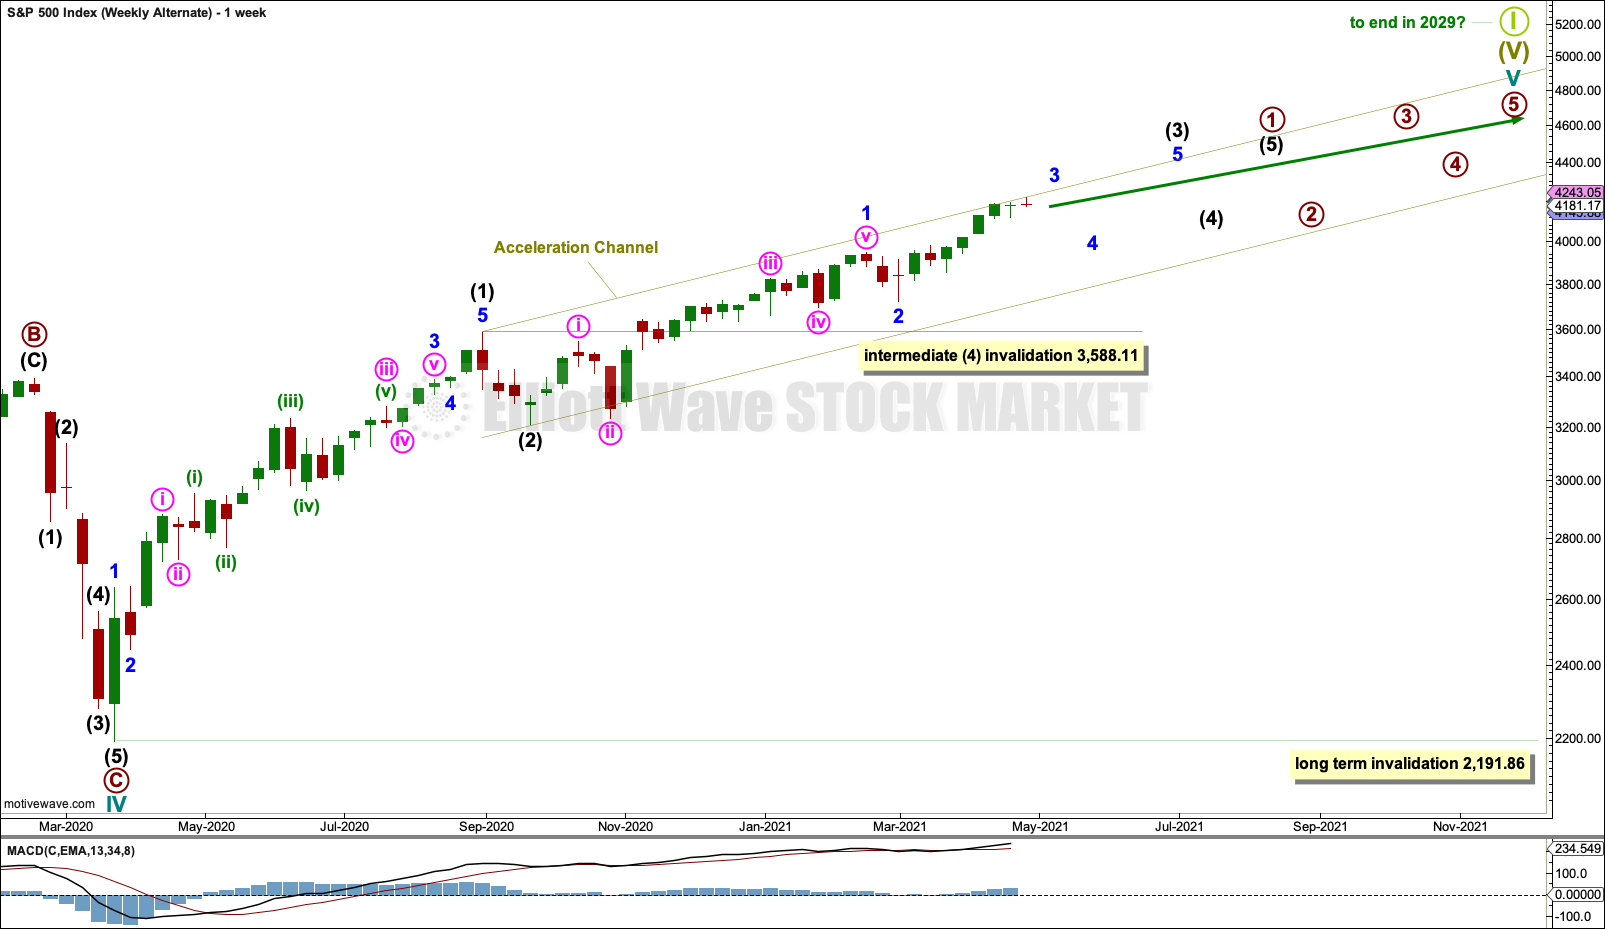
Click chart to enlarge.
This wave count sees subdivisions within cycle wave V the same except the degree of labelling is moved down one degree. Primary wave 1 within cycle wave V may be incomplete.
Within primary wave 1: Intermediate waves (1) and (2) may be complete, intermediate wave (3) may be extending, and intermediate wave (4) may not move into intermediate wave (1) price territory below 3,588.11.
When primary wave 1 may be complete (in several months time), then a deeper and longer lasting pullback for primary wave 2 may unfold. Primary wave 2 may not move beyond the start of primary wave 1 below 2,191.86.
TECHNICAL ANALYSIS
WEEKLY CHART
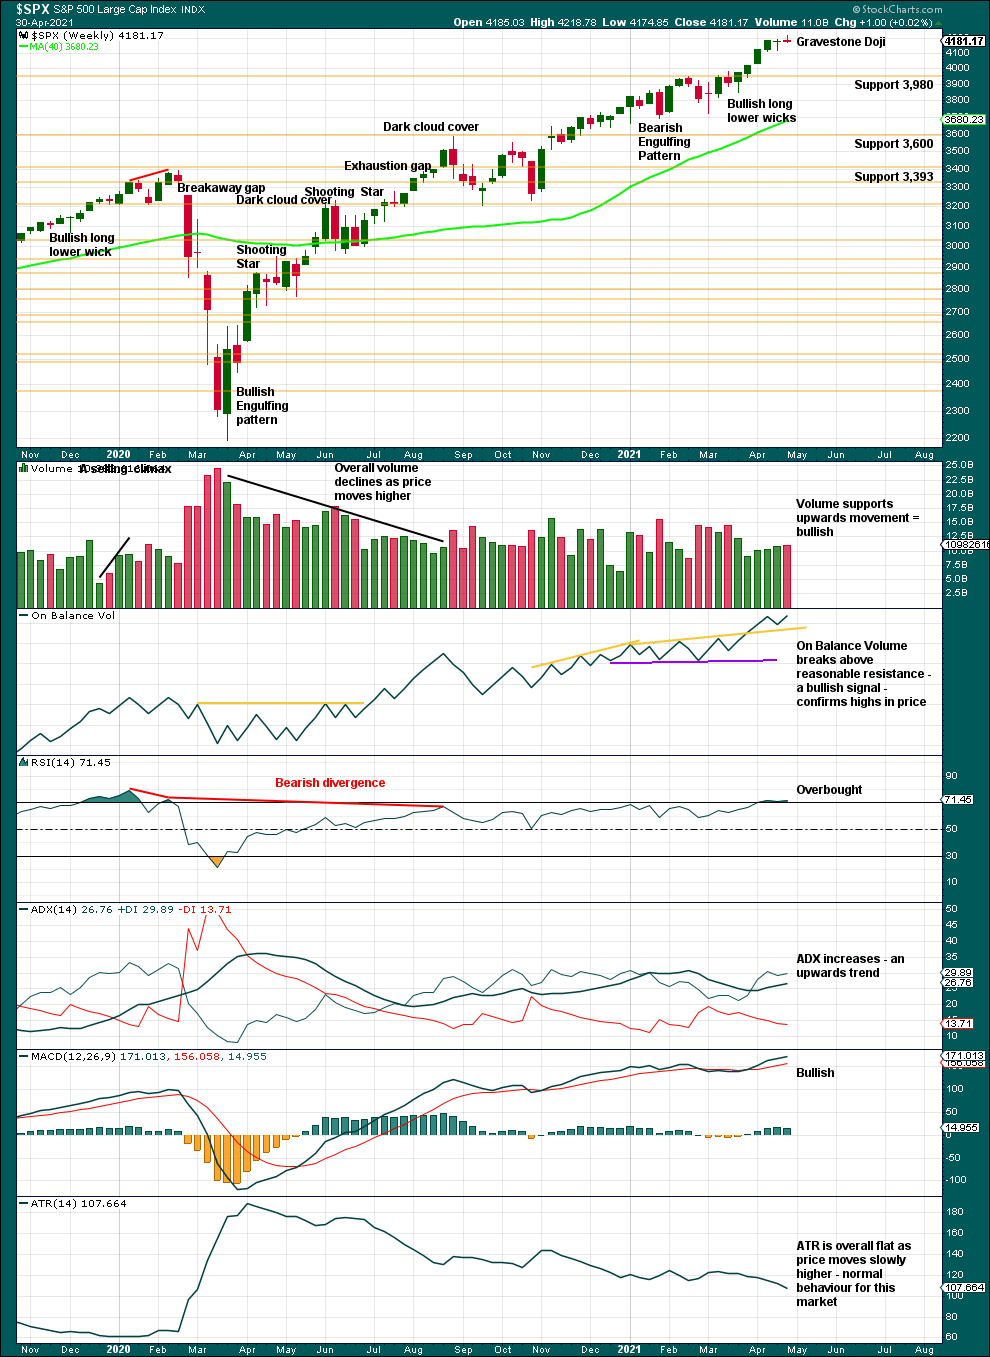
Click chart to enlarge. Chart courtesy of StockCharts.com.
A series of higher highs and higher lows off the low of March 2020 continues. The last short-term swing low is now at 3,723.34. While this remains intact, the dominant view should be of an upwards trend. There is a long way for this trend to run before conditions may become extreme.
This chart has the look of a sustainable bull market in a relatively early stage; there is as yet no evidence that a larger correction should begin here. Although RSI has just now reached overbought, this market has a strong bullish bias and RSI can move deeply overbought and remain there for years prior to the bull market ending.
For the short term, this week closes as a small Gravestone Doji, a bearish candlestick reversal pattern. This supports the second Elliott wave count.
DAILY CHART
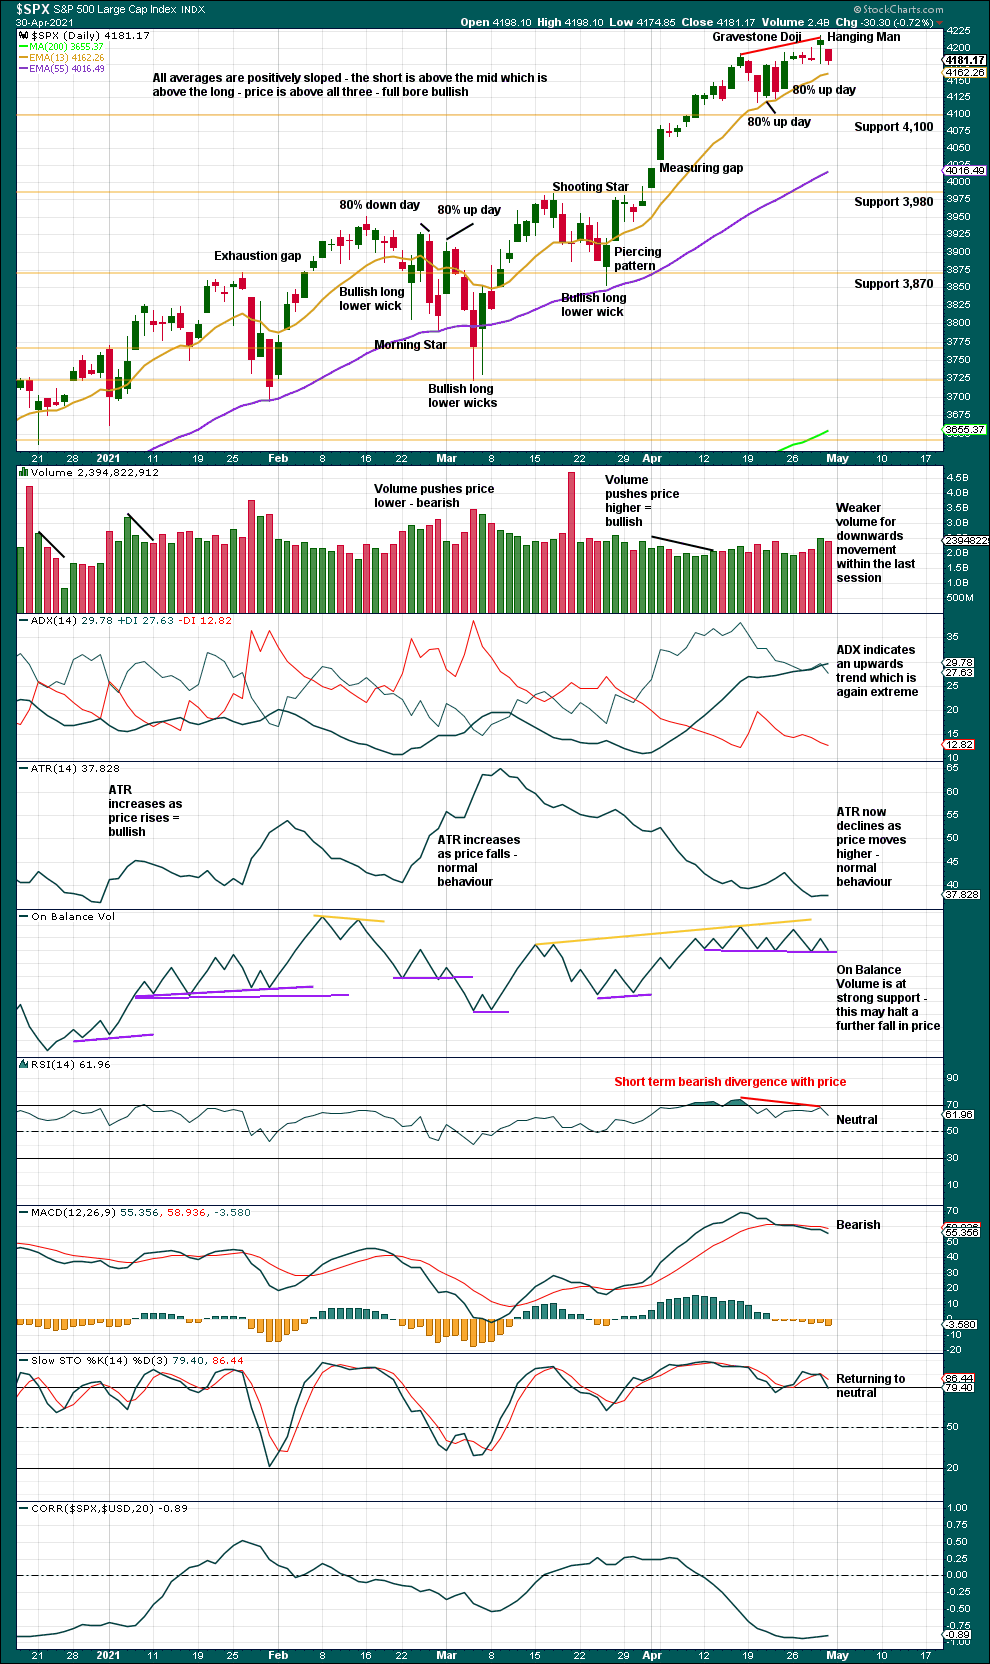
Click chart to enlarge. Chart courtesy of StockCharts.com.
The series of higher highs and higher lows from the low of the 30th of October continues.
Pullbacks are a normal and to be expected part of a bullish trend.
Support for On Balance Volume is strong. This supports the first Elliott wave count.
Two bearish candlestick reversal patterns (in conjunction with the pattern on the weekly chart), a Hanging Man and a Gravestone Doji, support the second Elliott wave count. Bearish divergence between price and RSI supports the second Elliott wave count.
BREADTH – AD LINE
WEEKLY CHART
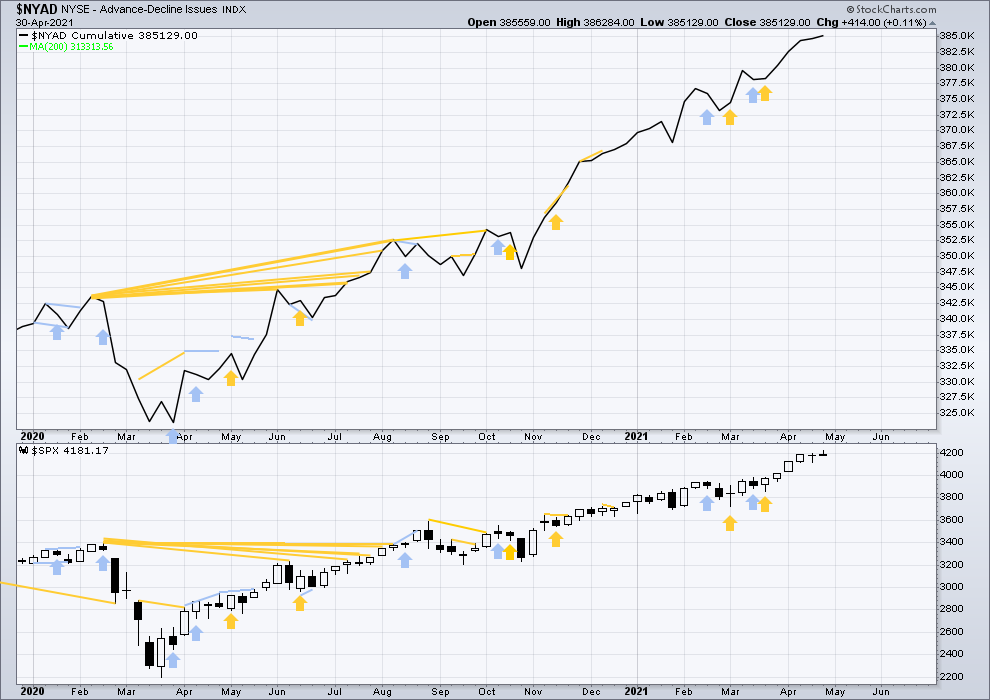
Click chart to enlarge. Chart courtesy of StockCharts.com. So that colour blind members are included, bearish signals will be noted with blue and bullish signals with yellow.
Breadth should be read as a leading indicator.
Lowry’s Operating Companies Only AD line has made a new all time high on the 29th of April. This supports the first Elliott wave count.
Large caps all time high: 4,218.78 on April 29, 2021.
Mid caps all time high: 2,778.84 on April 29, 2021.
Small caps all time high: 1,399.31 on March 12, 2021.
The last new high is found in large and mid caps. Small caps now have a fairly long lag of over a month; this fits with the main Elliott wave count, which expects a minor degree correction may continue. Small caps can lag and large caps can lead for some time while price travels a reasonable distance. Lagging small caps at this stage does not necessarily mean a larger correction should begin here.
This week again price and the AD line both make new all time highs. Upwards movement has support from rising market breadth. This is bullish and supports the first Elliott wave count.
DAILY CHART
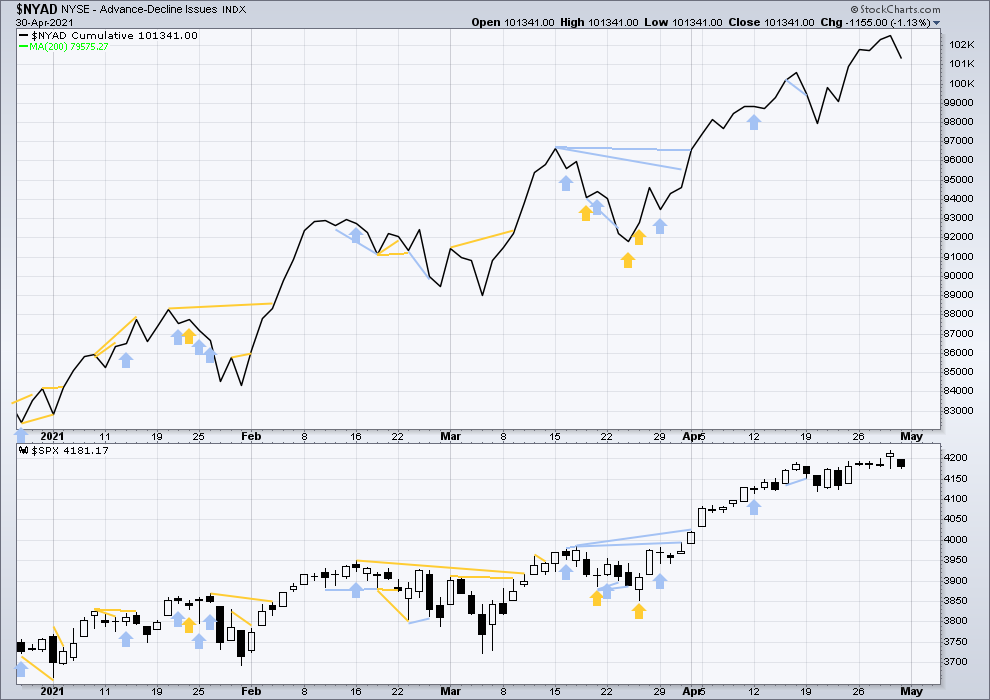
Click chart to enlarge. Chart courtesy of StockCharts.com. So that colour blind members are included, bearish signals will be noted with blue and bullish signals with yellow.
Both price and the AD line have moved lower today. There is no new short-term divergence.
VOLATILITY – INVERTED VIX CHART
WEEKLY CHART
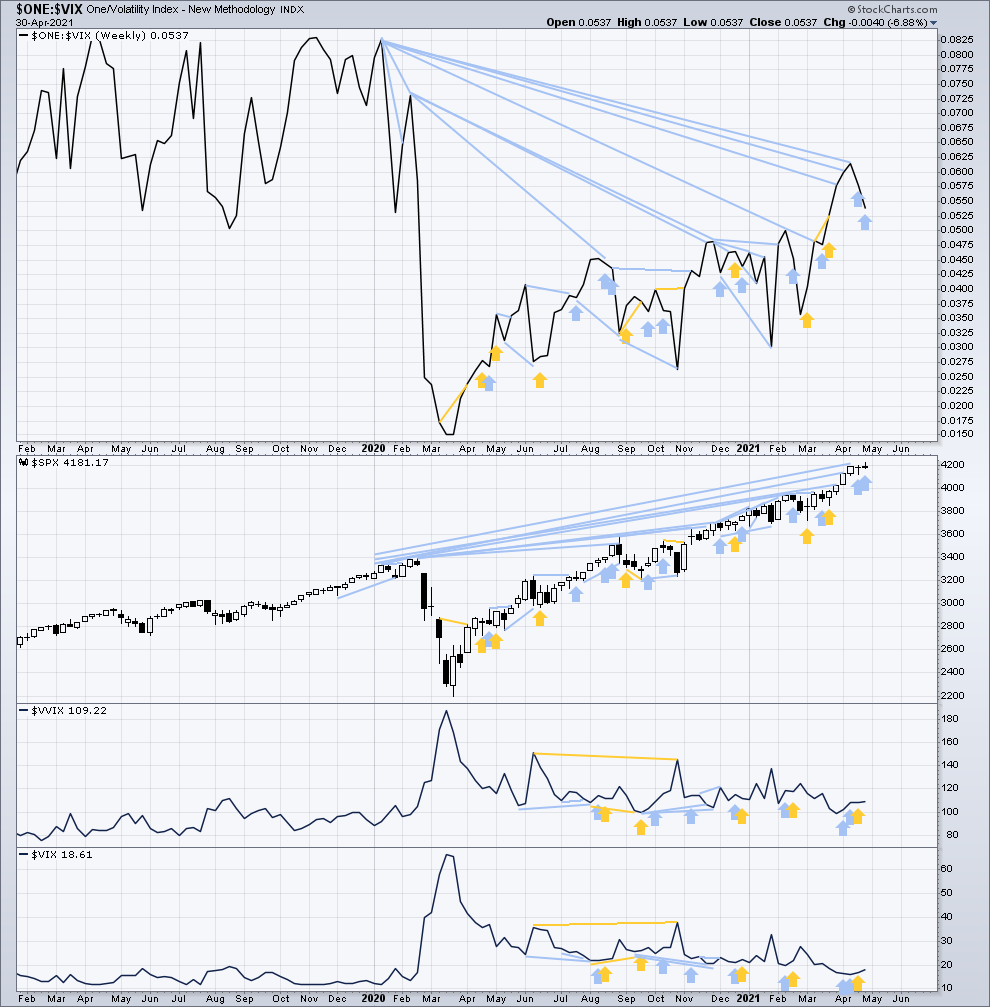
Click chart to enlarge. Chart courtesy of StockCharts.com. So that colour blind members are included, bearish signals will be noted with blue and bullish signals with yellow.
Inverted VIX remains well below all time highs. The all time high for inverted VIX was in the week beginning October 30, 2017. There is over 3 years of bearish divergence between price and inverted VIX. This bearish divergence may develop further before the bull market ends. It may be a very early indicator of an upcoming bear market, but it is not proving to be useful in timing.
For the second week in a row price has moved higher, but inverted VIX has moved lower. This bearish divergence supports the second Elliott wave count.
Comparing VIX and VVIX at the weekly chart level:
This week both VIX and VVIX have moved higher. There is no new divergence.
There is now a cluster of three weeks of short-term bearish divergence for price. This supports the main Elliott wave count.
DAILY CHART
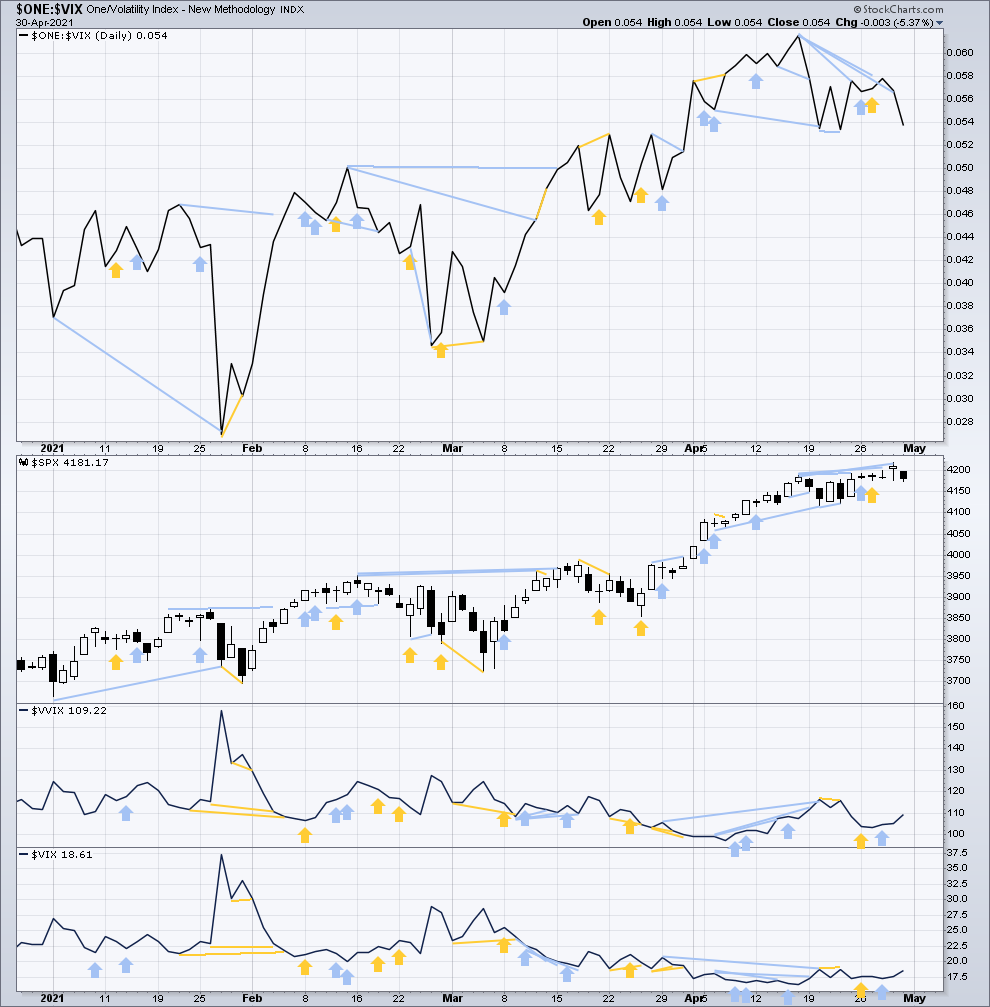
Click chart to enlarge. Chart courtesy of StockCharts.com. So that colour blind members are included, bearish signals will be noted with blue and bullish signals with yellow.
Both price and inverted VIX have moved lower on Friday. There is no new short-term divergence.
Comparing VIX and VVIX at the daily chart level:
Today both VIX and VVIX have moved higher. There is no new short-term divergence.
There is still a cluster of short-term bearish divergence for price.
DOW THEORY
Dow Theory confirms a new bull market with new highs made on a closing basis:
DJIA: 29,568.57 – closed above on 16th November 2020.
DJT: 11,623.58 – closed above on 7th October 2020.
Most recently, last week both DJIA and DJT have made new all time highs. An ongoing bull market is again confirmed by Dow Theory.
Adding in the S&P and Nasdaq for an extended Dow Theory, confirmation of a bull market would require new highs made on a closing basis:
S&P500: 3,393.52 – closed above on 21st August 2020.
Nasdaq: 9,838.37 – closed above on June 8, 2020.
The following major swing lows would need to be seen on a closing basis for Dow Theory to confirm a change from bull to a bear market:
DJIA: 18,213.65
DJT: 6,481.20
Adding in the S&P and Nasdaq for an extended Dow Theory, confirmation of a new bear market would require new lows on a closing basis:
S&P500: 2,191.86
Nasdaq: 6,631.42
Published @ 07:55 p.m. ET.
—
Careful risk management protects your trading account(s).
Follow my two Golden Rules:
1. Always trade with stops.
2. Risk only 1-5% of equity on any one trade.
—
New updates to this analysis are in bold.