
S&P 500: Elliott Wave and Technical Analysis | Charts – April 13, 2021
Both Elliott wave counts have been bullish for a long time. Multiple targets are provided to indicate where pullbacks or consolidations may be expected. The short-term target is getting closer.
Summary: The wave count is now very bullish. It expects a third wave at three large degrees may have moved through its middle and may now be completing.
A new short-term target is at 4,276; there may be from one to two more short-term pullbacks along the way up towards this next target. Now two days of bearish divergence between price and the AD line suggests a small pullback may occur tomorrow or very soon.
About this short-term target at 4,276 a pullback or consolidation to last about one to two weeks may begin.
The next mid-term target for the upwards trend is at 4,464 or 4,922. About one of these targets another multi-week pullback or consolidation may develop.
The biggest picture, Grand Super Cycle analysis, is here.
Monthly charts are last updated here with video here.
MAIN WAVE COUNT
WEEKLY CHART
Click chart to enlarge.
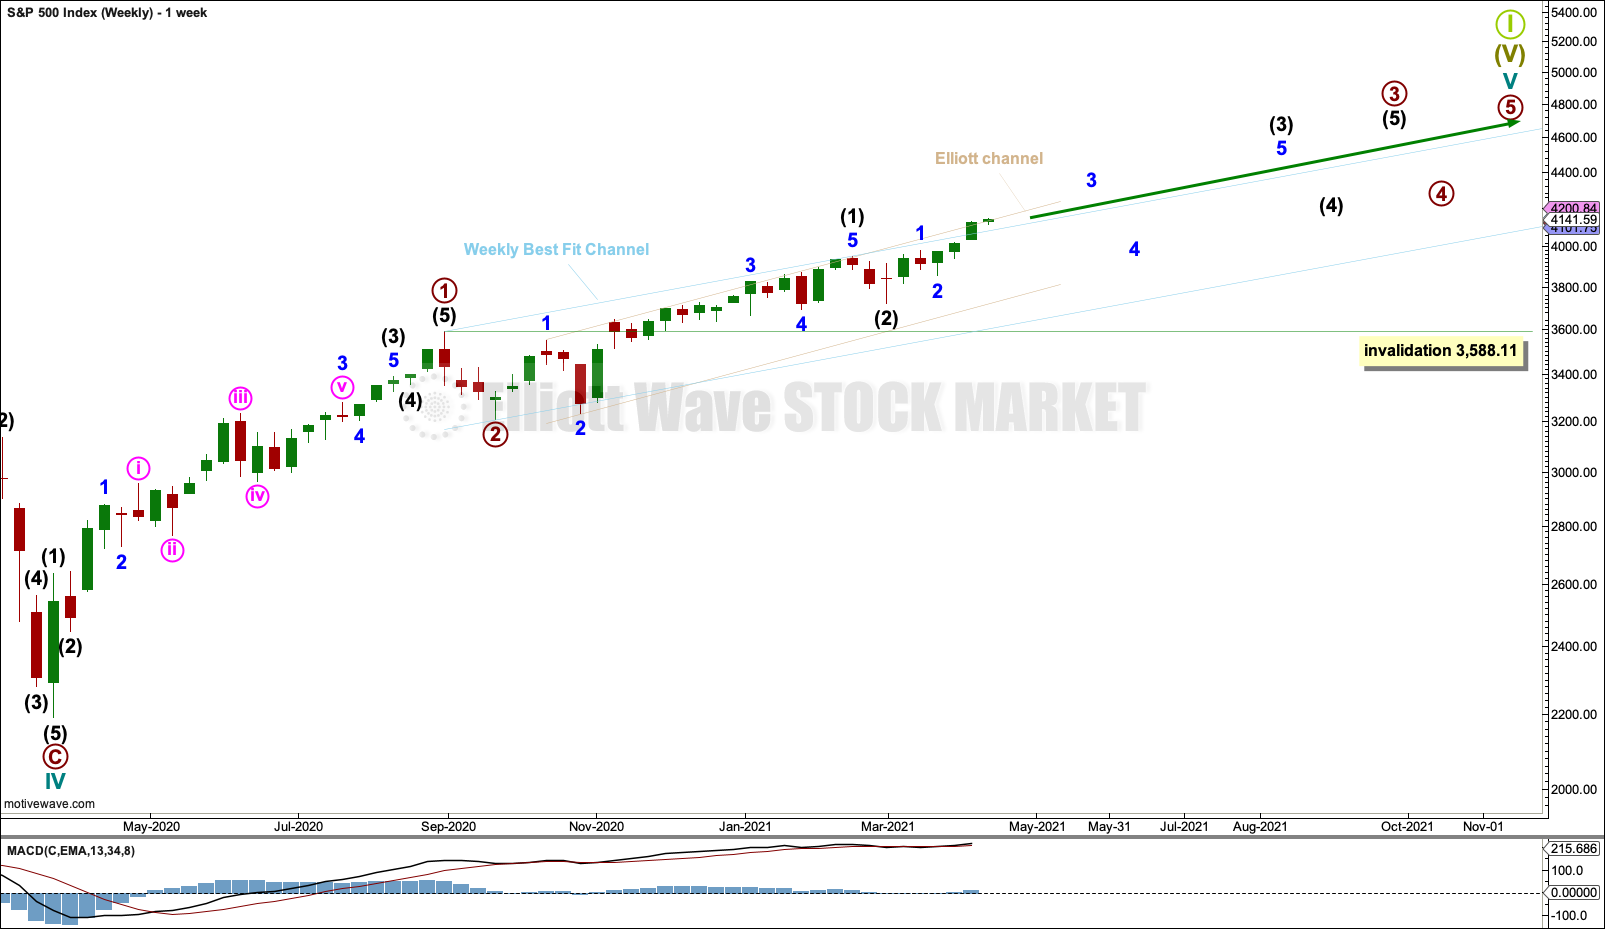
Cycle wave V may last from one to several years. So far it is in its thirteenth month.
This wave count may allow time for the AD line to diverge from price as price makes final highs before the end of the bull market. The AD line most commonly diverges a minimum of 4 months prior to the end of a bull market. A longer divergence is positively correlated with a deeper bear market. A shorter divergence is positively correlated with a more shallow bear market. With zero divergence at this stage, if a surprise bear market does develop here, then it would likely be shallow.
A longer divergence between price and the AD line would be expected towards the end of Grand Super Cycle wave I.
It is possible that cycle wave V may continue until 2029, if the 2020s mirror the 1920s.
Cycle wave V would most likely subdivide as an impulse. But if overlapping develops, then an ending diagonal should be considered. This chart considers the more common impulse.
Primary waves 1 and 2 may be complete.
Primary wave 3 may only subdivide as an impulse.
Primary wave 3 has now moved well above the end of primary wave 1. Primary wave 4 may not move into primary wave 1 price territory below 3,588.11.
There is already a Fibonacci ratio between cycle waves I and III within Super Cycle wave (V). The S&P500 often exhibits a Fibonacci ratio between two of its actionary waves but rarely between all three; it is less likely that cycle wave V would exhibit a Fibonacci ratio. The target for Super Cycle wave (V) to end would best be calculated at primary degree, but that cannot be done until all of primary waves 1, 2, 3 and 4 are complete.
The blue weekly best fit channel is slightly adjusted, so that the lower edge may better show where price may find support. Copy this over to the daily chart. Price has closed above the upper edge of this channel, which is bullish.
The beige Elliott channel is drawn about intermediate wave (1) using Elliott’s first technique: Draw the first trend line from the ends of minor waves 1 to 3, then place a parallel copy on the end of minor wave 2. The upper edge has initiated multiple pullbacks.
DAILY CHART
Click chart to enlarge.
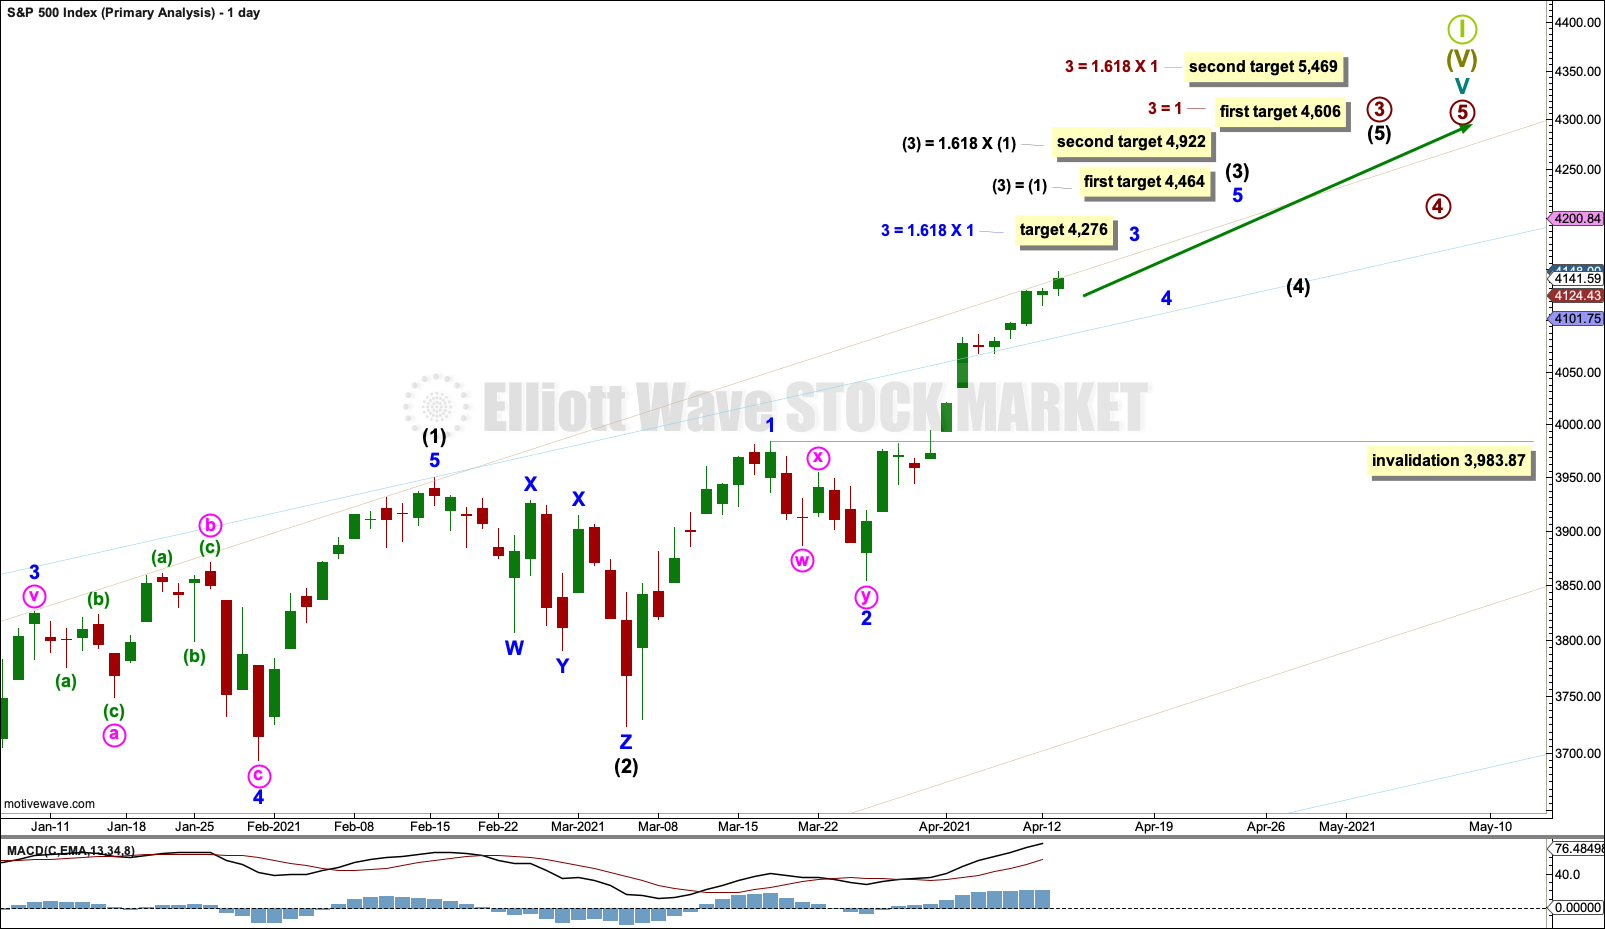
The daily chart focusses on the unfolding impulse of primary wave 3 from the low of minor wave 2 within it.
Intermediate wave (1) within primary wave 3 may be complete.
Intermediate wave (2) may also be complete as a triple zigzag.
Intermediate wave (3) within primary wave 3 may now be underway and may have passed its middle.
Minor waves 1 and 2 within intermediate wave (3) may now be complete. Minor wave 3 may now be underway. When minor wave 3 is complete, then the following pullback or consolidation for minor wave 4 may last about one to two weeks and may not move into minor wave 1 price territory below 3,983.87.
Targets are calculated for intermediate wave (3) and for primary wave 3. As price approaches the first target for intermediate wave (3) and if the structure is complete and technical analysis suggests a pullback may occur, then the target may be useful. But if price moves through the first target or the structure is incomplete, then the second target may be used.
Price is currently at the upper edge of the beige Elliott channel and has closed above it on the hourly chart (because daily charts are on a semi log scale and hourly charts are on an arithmetic scale the channel sits slightly differently). If this channel is more clearly breached this week, then upwards momentum may increase.
The current upwards wave for this wave count is expected to be a third wave at minor, intermediate and primary degree.
HOURLY CHART
Click chart to enlarge.
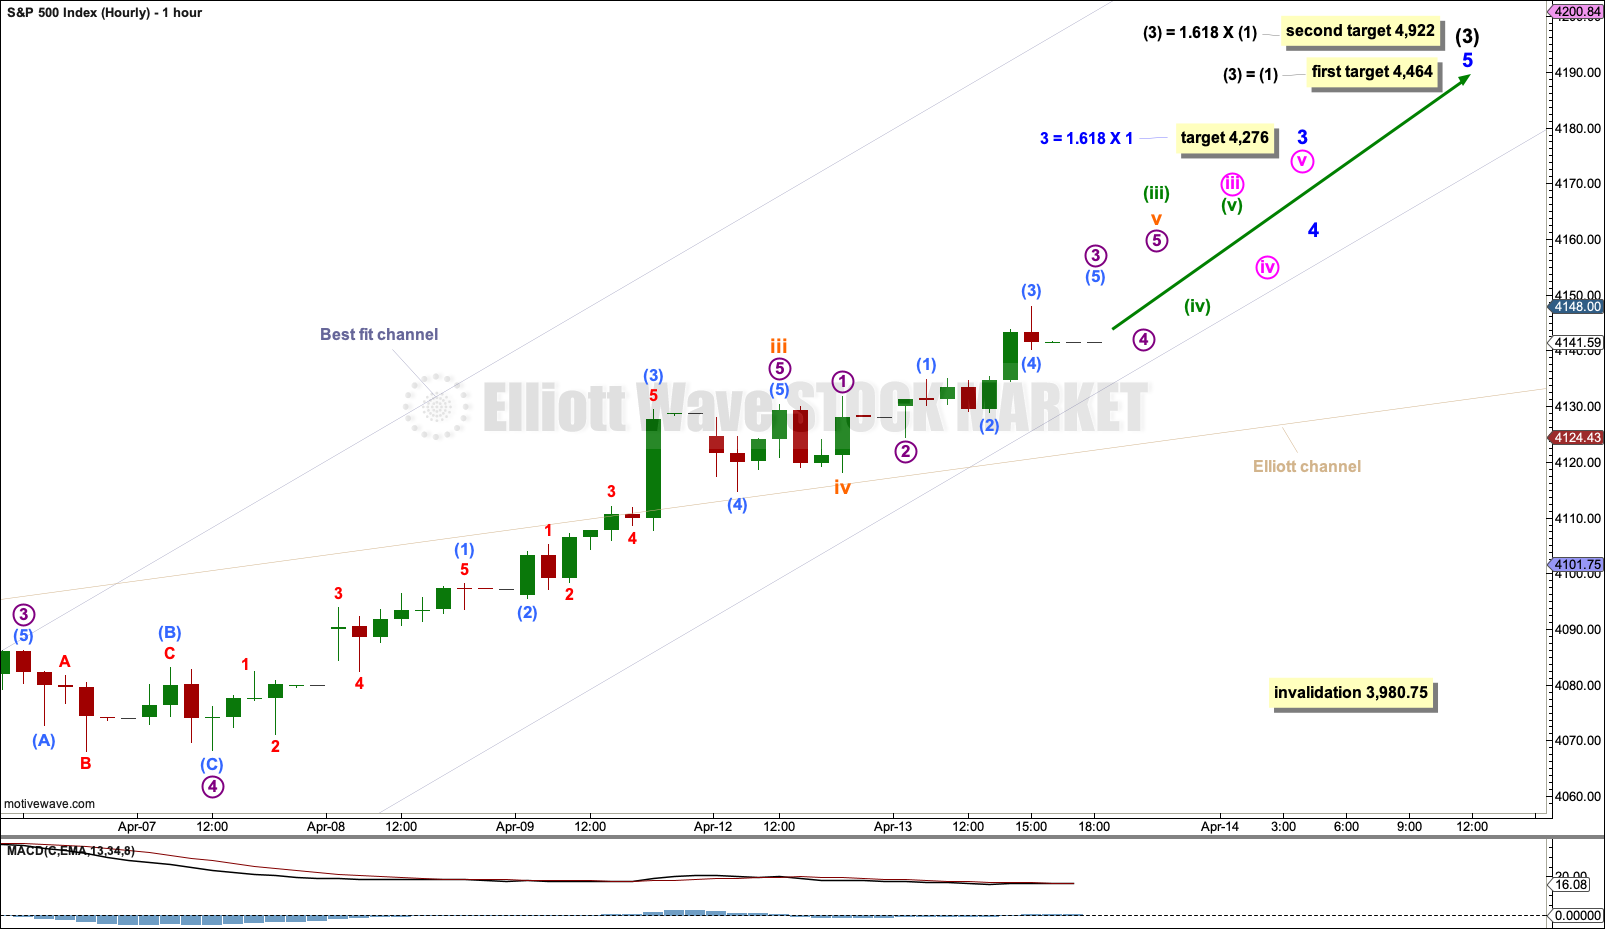
Minute waves i and ii within minor wave 3 may be complete.
The middle of a large third wave may have passed. Another two pullbacks (minuette wave (iv) and minute wave iv) may unfold along the way up to complete minor wave 3. Each must remain above its respective first wave price territory.
Minuette wave (iv) may not move into minuette wave (i) price territory below 3,980.75.
Each of minuette wave (iv) and minute wave iv may last from a few hours to about two days.
A target is calculated for minor wave 3 that expects a common Fibonacci ratio to minor wave 1.
ALTERNATE HOURLY CHART
Click chart to enlarge.
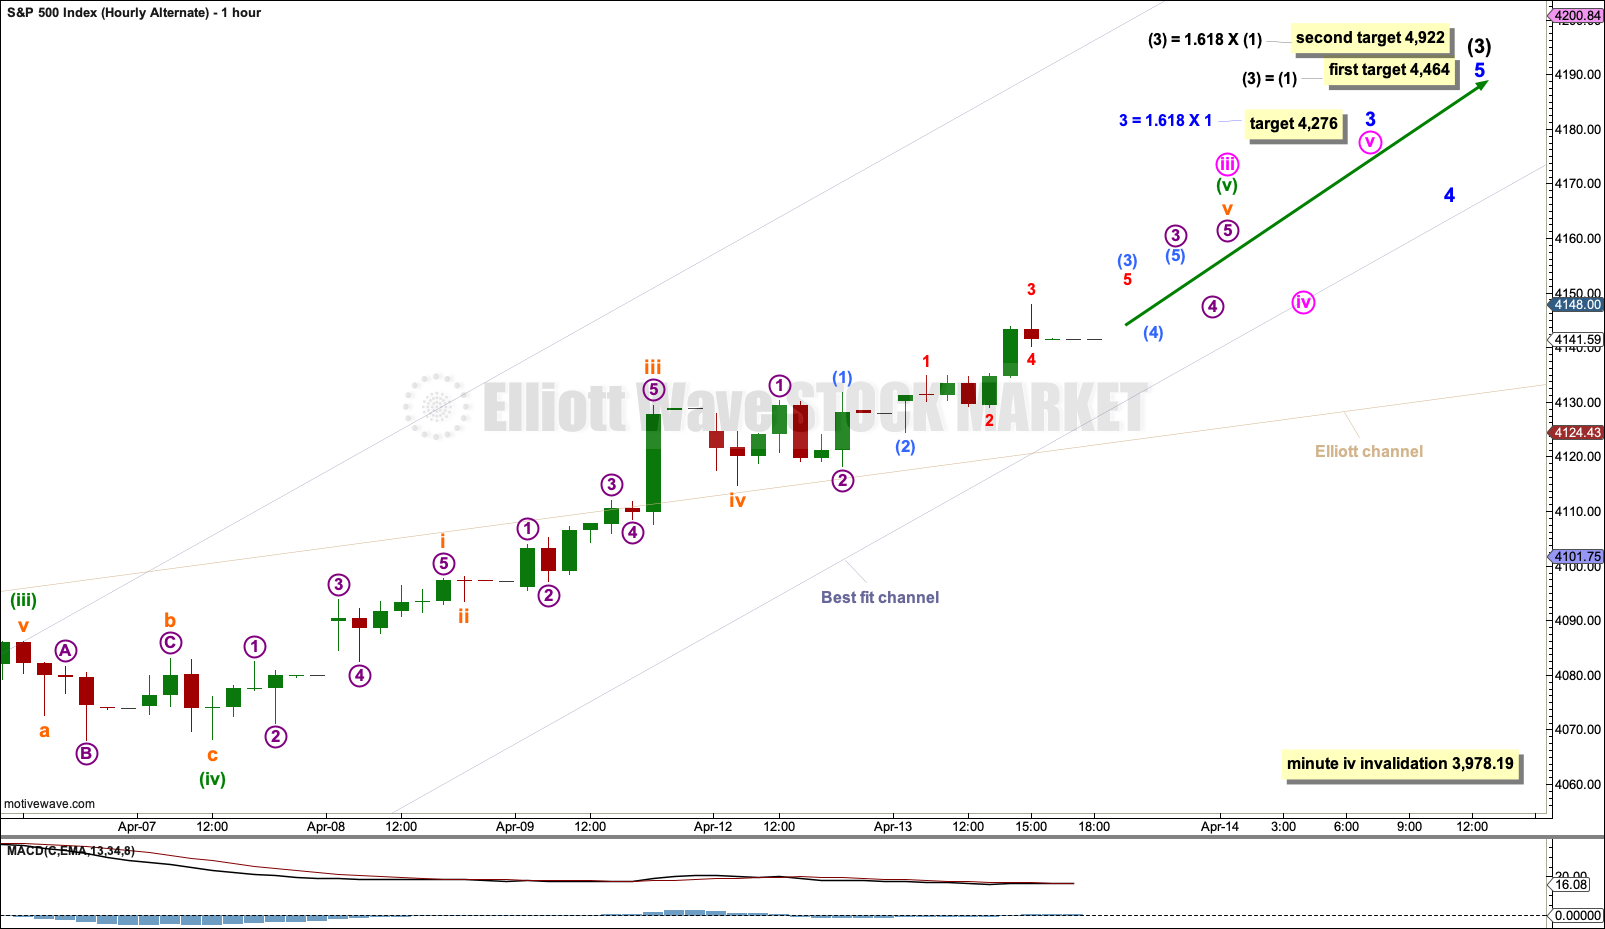
It is also possible that within minor wave 3 both of subminuette wave iv and minuette wave (iv) may be complete. Only one more short-term pullback along the way up to complete minor wave 3 may be required for minute wave iv. Minute wave iv may last one to three sessions.
Both of sub-micro wave (4) and micro wave 4 within the end of minute wave iii may last just a few hours and be over within a session.
Minute wave iv may not move into minute wave i price territory below 3,978.19.
ALTERNATE WAVE COUNT
WEEKLY CHART
Click chart to enlarge.
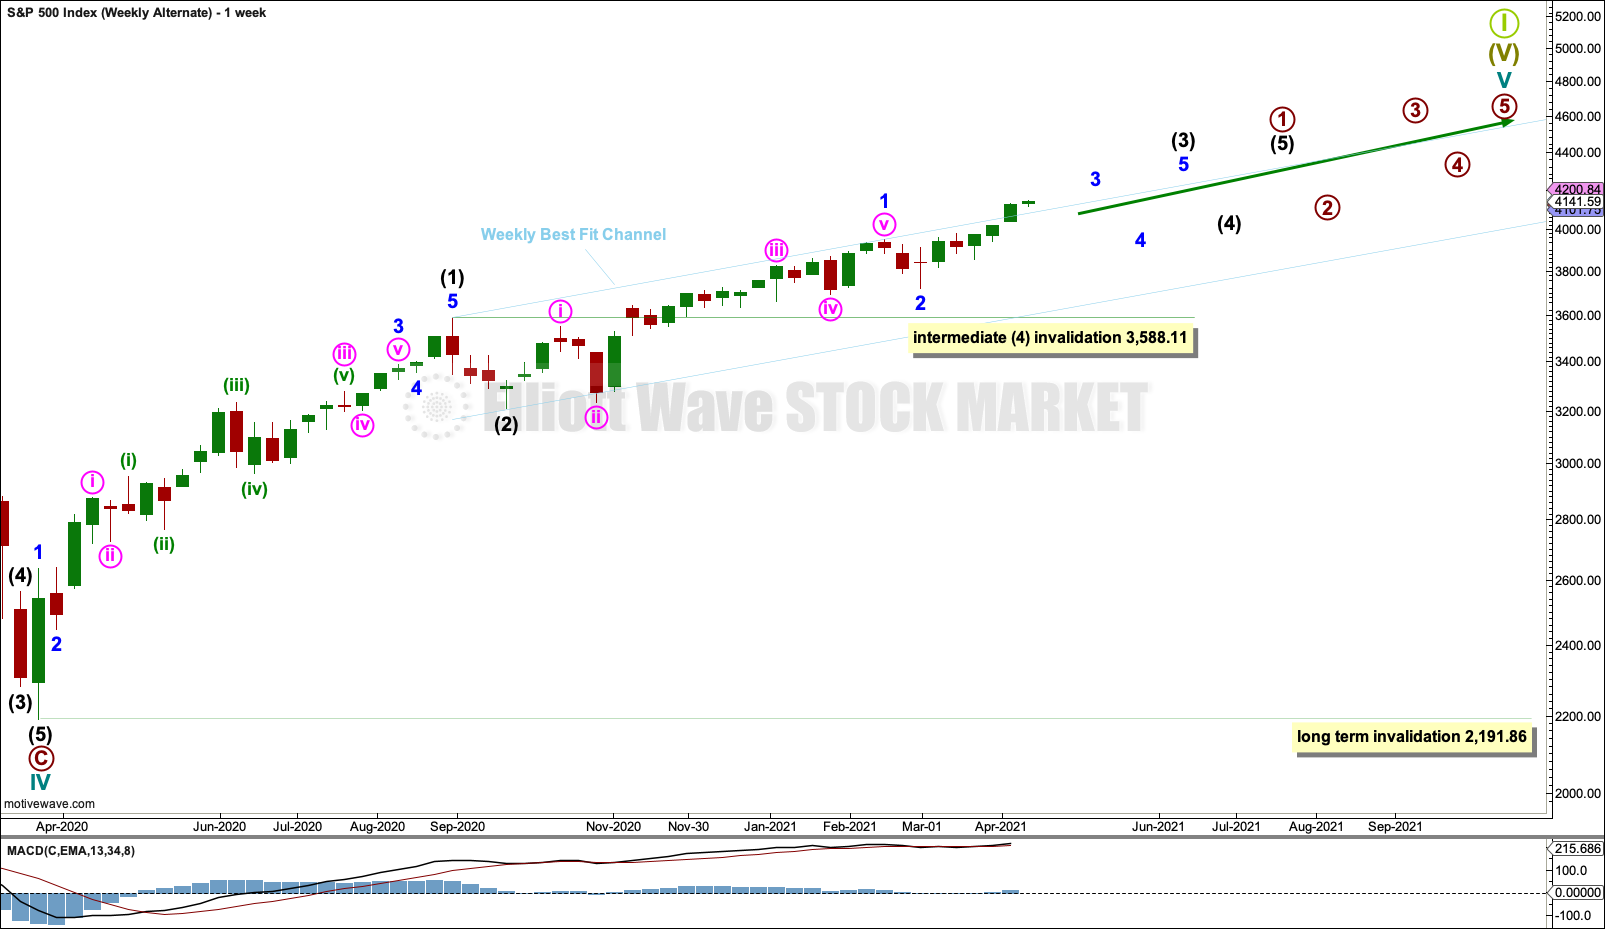
This wave count sees subdivisions within cycle wave V the same except the degree of labelling is moved down one degree. Primary wave 1 within cycle wave V may be incomplete.
Within primary wave 1: Intermediate waves (1) and (2) may be complete, intermediate wave (3) may be extending, and intermediate wave (4) may not move into intermediate wave (1) price territory below 3,588.11.
When primary wave 1 may be complete (in several months time), then a deeper and longer lasting pullback for primary wave 2 may unfold. Primary wave 2 may not move beyond the start of primary wave 1 below 2,191.86.
TECHNICAL ANALYSIS
WEEKLY CHART
Click chart to enlarge. Chart courtesy of StockCharts.com.
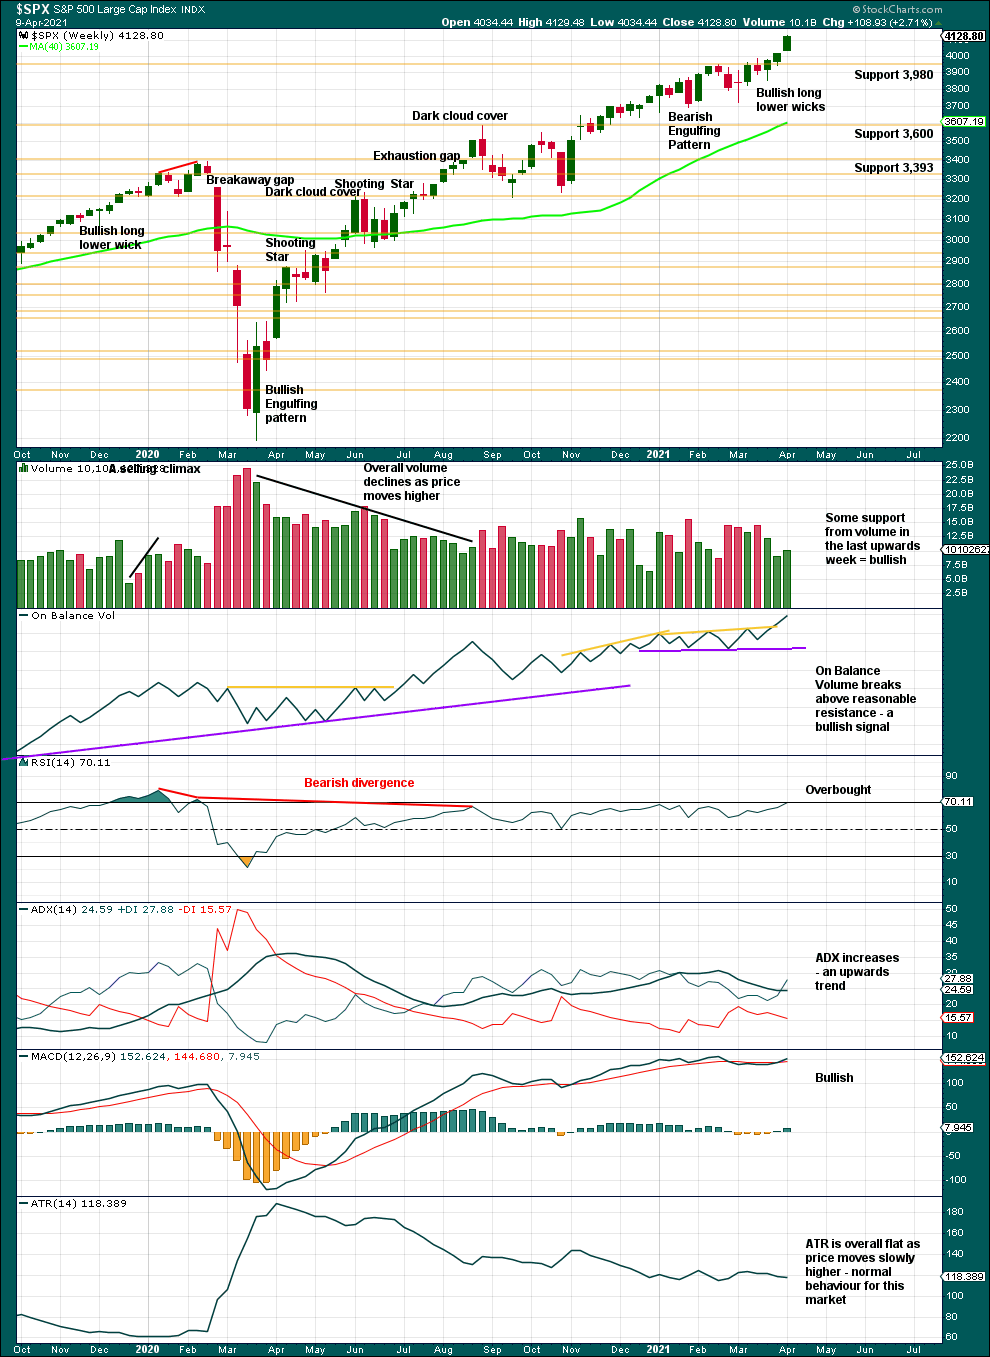
A series of higher highs and higher lows off the low of March 2020 continues. The last short-term swing low is now at 3,723.34. While this remains intact, the dominant view should be of an upwards trend. There is a long way for this trend to run before conditions may become extreme.
For the short term, an increase in range and volume for upwards movement this week and a bullish signal from On Balance Volume support a bullish Elliott wave count. ADX gives a bullish signal.
This chart has the look of a sustainable bull market in a relatively early stage; there is as yet no evidence that a larger correction should begin here. Although RSI has just now reached overbought, this market has a strong bullish bias and RSI can move deeply overbought and remain there for years prior to the bull market ending (for an example see May 1995 to March 2000).
DAILY CHART
Click chart to enlarge. Chart courtesy of StockCharts.com.
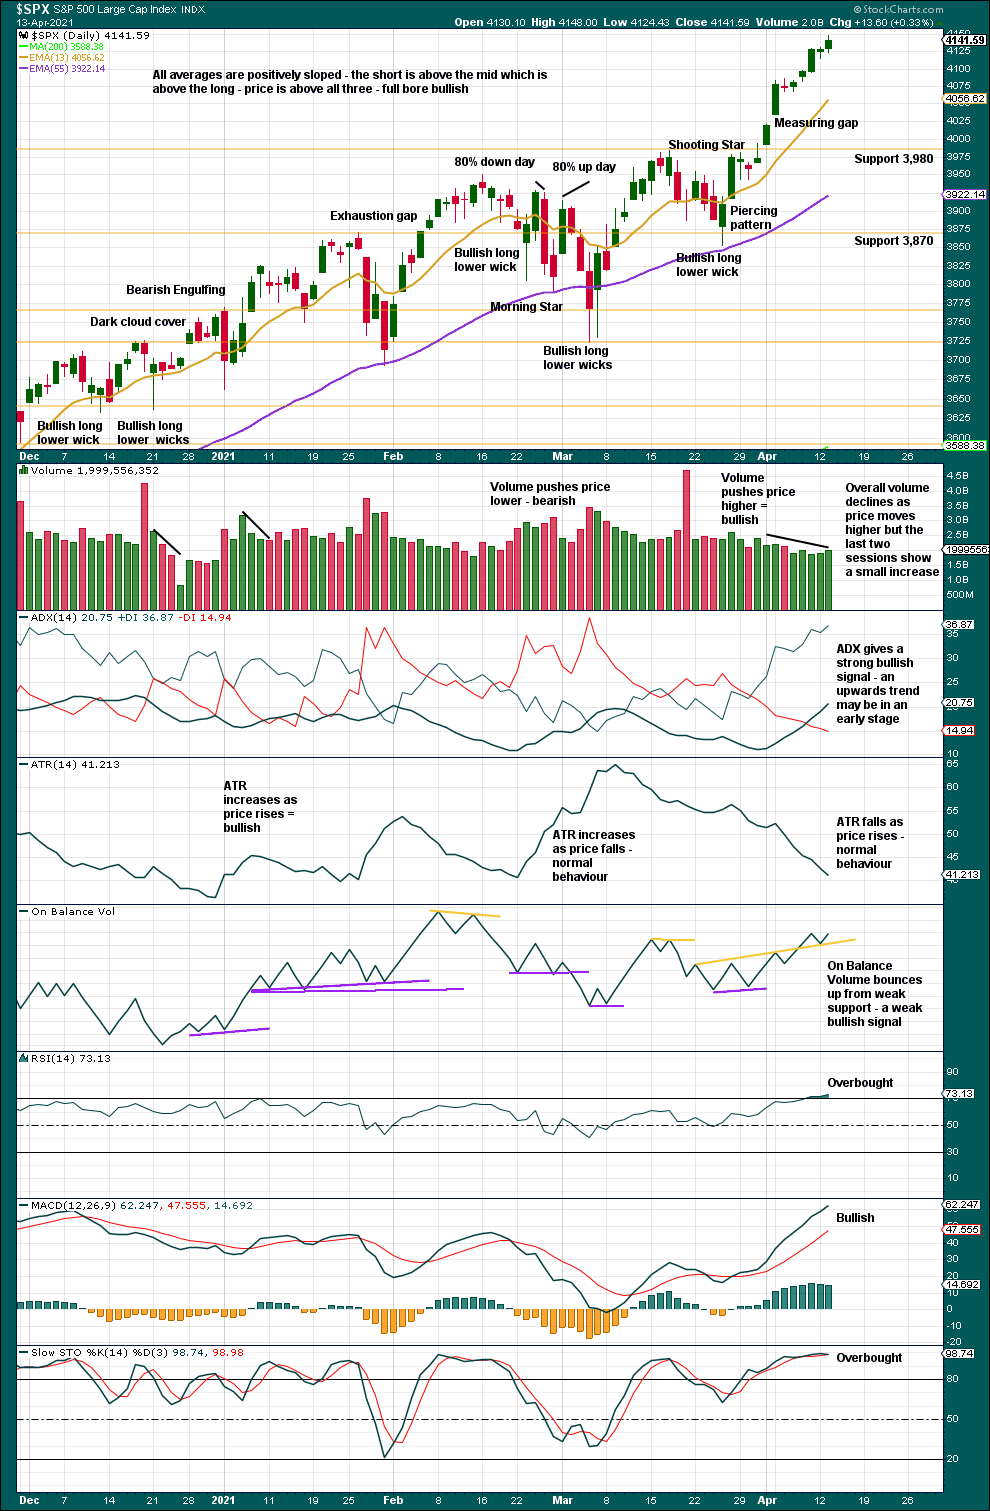
The series of higher highs and higher lows from the low of the 30th of October continues.
The last swing low is the 25th of March at 3,853.50. While this remains intact, the upwards trend may be assumed to continue. Pullbacks are a normal and to be expected part of a bullish trend. If a pullback develops here or soon, then it may test support about 3,980 or the round number pivot at 4,000.
ADX is not extreme. There is plenty of room for an upwards trend to continue. This market has a strong bullish bias. RSI may reach deeply overbought and then exhibit divergence between swing highs before a more substantial pullback occurs to relieve extreme conditions. That set up may not come until minor waves 3, 4 and 5 are complete.
The measuring gap gives a target at 4,201.57. This gap may offer support at 4,020.63.
Declining volume has for years been a feature of this bull market. In the long term it may become a problem as when a bear market arrives support below would be thin and price may fall dramatically, but for now the bull market remains healthy and has proven to be able to rise sustainably on light and declining volume. At this stage, it is not of a concern for the Elliott wave count.
Today some support from volume and a weak bullish signal from On Balance Volume support the Elliott wave count.
BREADTH – AD LINE
WEEKLY CHART
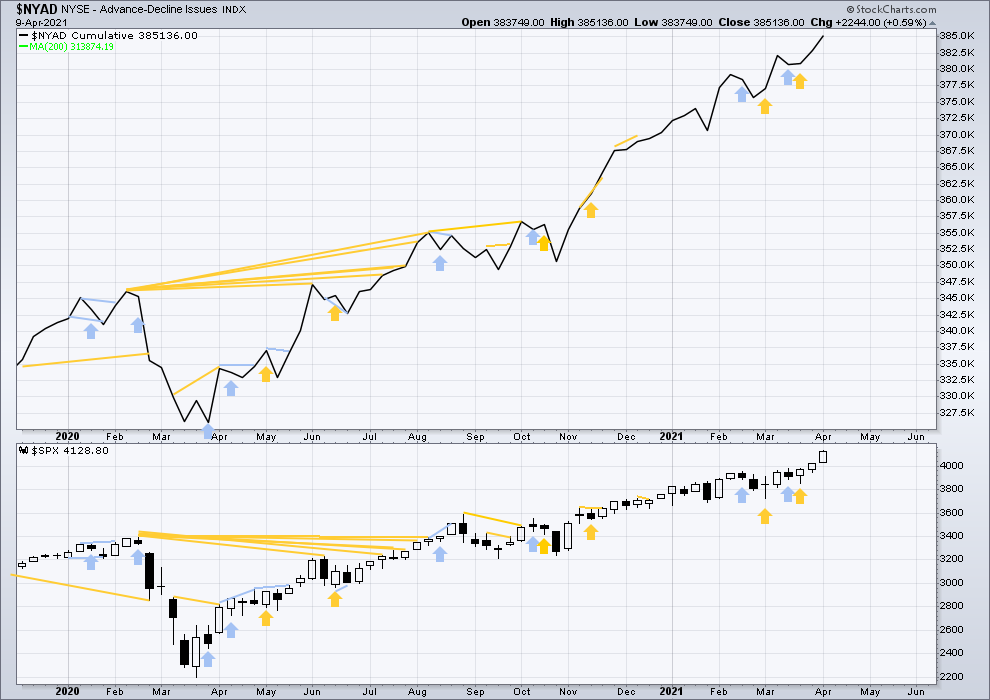
Click chart to enlarge. Chart courtesy of StockCharts.com. So that colour blind members are included, bearish signals will be noted with blue and bullish signals with yellow.
Breadth should be read as a leading indicator.
Lowry’s Operating Companies Only AD line has made a new all time high on the 15th of March. This supports the main Elliott wave count.
Large caps all time high: 4,148.00 on April 13, 2021.
Mid caps all time high: 2,685.43 on April 6, 2021.
Small caps all time high: 1,399.31 on March 12, 2021.
The last new high is found in large caps. With large caps leading and small caps lagging, this last rise is bearish for the short term. This fits with the Elliott wave count that now sees a third wave in its last stages prior to a pullback or consolidation for minor wave 4. Small caps can lag and large caps can lead for some time while price travels a reasonable distance. Lagging small caps at this stage does not necessarily mean price must turn here.
Again, last week both price and the AD line have made new all time highs at the weekly chart level. This is bullish.
DAILY CHART
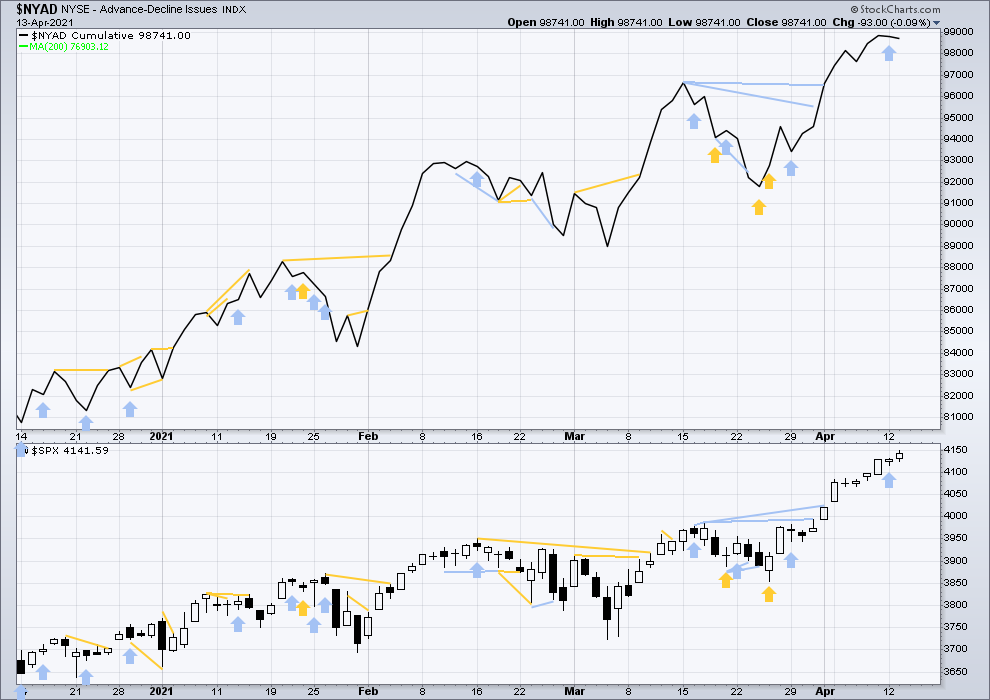
Click chart to enlarge. Chart courtesy of StockCharts.com. So that colour blind members are included, bearish signals will be noted with blue and bullish signals with yellow.
Price has made another new all time high, but the AD line has again declined very slightly today. This is another instance of a single day of bearish divergence. Now this signal is slightly stronger with two days of bearish divergence. It may develop a little further before a pullback arrives.
VOLATILITY – INVERTED VIX CHART
WEEKLY CHART

Click chart to enlarge. Chart courtesy of StockCharts.com. So that colour blind members are included, bearish signals will be noted with blue and bullish signals with yellow.
Inverted VIX remains well below all time highs. The all time high for inverted VIX was in the week beginning October 30, 2017. There is over 3 years of bearish divergence between price and inverted VIX. This bearish divergence may develop further before the bull market ends. It may be a very early indicator of an upcoming bear market, but it is not proving to be useful in timing.
Again, last week both price and inverted VIX have moved higher, but only price has made a new all time high. There is now mid and long-term bearish divergence, but there is no short-term bearish divergence.
Comparing VIX and VVIX at the weekly chart level:
Last week VIX has moved lower, but VVIX has moved higher. This is a single week instance of divergence, which is bearish for price for the short term.
DAILY CHART

Click chart to enlarge. Chart courtesy of StockCharts.com. So that colour blind members are included, bearish signals will be noted with blue and bullish signals with yellow.
Price has moved higher following a single day of bearish divergence, so this divergence may have failed.
Today both price and inverted VIX have moved higher. There is no new short-term divergence.
Comparing VIX and VVIX at the daily chart level:
Today both VIX and VVIX have moved lower. There is no new short-term divergence.
DOW THEORY
Dow Theory confirms a new bull market with new highs made on a closing basis:
DJIA: 29,568.57 – closed above on 16th November 2020.
DJT: 11,623.58 – closed above on 7th October 2020.
Adding in the S&P and Nasdaq for an extended Dow Theory, confirmation of a bull market would require new highs made on a closing basis:
S&P500: 3,393.52 – closed above on 21st August 2020.
Nasdaq: 9,838.37 – closed above on June 8, 2020.
The following major swing lows would need to be seen on a closing basis for Dow Theory to confirm a change from bull to a bear market:
DJIA: 18,213.65
DJT: 6,481.20
Adding in the S&P and Nasdaq for an extended Dow Theory, confirmation of a new bear market would require new lows on a closing basis:
S&P500: 2,191.86
Nasdaq: 6,631.42
Published @ 07:02 p.m. ET.
—
Careful risk management protects your trading account(s).
Follow my two Golden Rules:
1. Always trade with stops.
2. Risk only 1-5% of equity on any one trade.
—
New updates to this analysis are in bold.